You are not logged in.
This means you
CAN ONLY VIEW reports that were published prior to Sunday, February 25, 2024.
You
MUST UPGRADE YOUR MEMBERSHIP if you want to see any current reports.
AFTER MARKET UPDATE - THURSDAY, JUNE 18TH, 2020
Previous After Market Report Next After Market Report >>>
|
|
|
|
DOW |
-39.51 |
26,080.10 |
-0.15% |
|
Volume |
1,009,090,486 |
-0% |
|
Volume |
4,248,677,800 |
+0% |
|
NASDAQ |
+32.52 |
9,943.05 |
+0.33% |
|
Advancers |
1,281 |
44% |
|
Advancers |
1,631 |
49% |
|
S&P 500 |
+1.85 |
3,115.34 |
+0.06% |
|
Decliners |
1,613 |
56% |
|
Decliners |
1,675 |
51% |
|
Russell 2000 |
+0.54 |
1,427.08 |
+0.04% |
|
52 Wk Highs |
38 |
|
|
52 Wk Highs |
109 |
|
|
S&P 600 |
-2.91 |
829.29 |
-0.35% |
|
52 Wk Lows |
4 |
|
|
52 Wk Lows |
4 |
|
|
 |
Major Indices Were Mixed as Leadership Cooled
Kenneth J. Gruneisen - Passed the CAN SLIM® Master's Exam
The Dow slipped 39 points, while the S&P 500 ticked up less than 0.1%. The Nasdaq Composite added 0.3%, for the benchmark’s fifth straight day of gains amid strength in software companies. Decliners led advancers by a 4-3 margin on the NYSE while the mix was near even on the Nasdaq exchange. The reported volume totals were slightly lower than the prior session on the NYSE and slightly higher on the Nasdaq exchange. There were 34 high-ranked companies from the Leaders List that hit new 52-week highs and were listed on the BreakOuts Page, versus the total of 44 on the prior session. New 52-week highs totals contracted yet still outnumbered new 52-week lows totals on the NYSE and on the Nasdaq exchange. The major indices remain in a confirmed uptrend (M criteria). Any sustainable rally requires a healthy crop of new leaders, so it was encouraging to recently see the new highs totals improve. Charts used courtesy of www.stockcharts.com
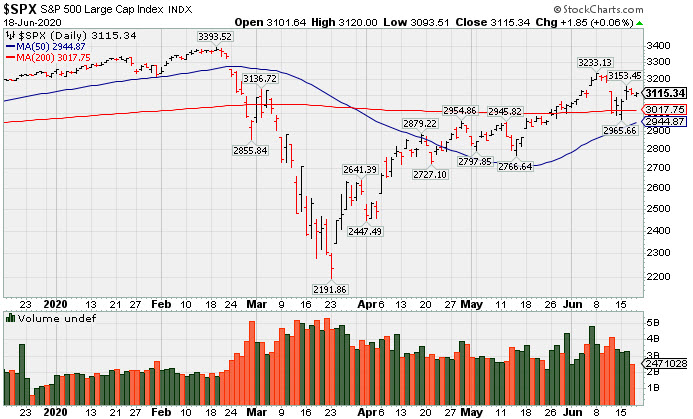
PICTURED: The S&P 500 Index is perched -8.2% off its record high.
U.S equities finished mixed Thursday, as investors weighed economic updates on the U.S. labor market and monitored coronavirus news. Several states reported record new COVID-19 infections and increased number of hospitalizations, while an infectious disease expert in China claimed the coronavirus outbreak in Beijing has been brought under control.
On the data front, initial jobless claims remained elevated at 1.5 million in the most recent week, marking the 13th straight week of more than 1 million Americans filing for unemployment. Separately, a gauge for the Philadelphia Fed business outlook unexpectedly rebounded into expansionary territory in June, contrasting from May’s negative 43.1 figure. Elsewhere, the leading economic index came in at 2.8% in May, beating consensus estimates of 2.4% and rebounding from the prior month’s downwardly revised negative 6.1% number. Treasuries strengthened, with the yield on the 10-year note falling three basis points to 0.70%.
Seven of 11 S&P 500 sectors finished the session in negative territory. However, the Energy sector outperformed with WTI crude rising 2.3% to $38.84/barrel. In earnings, Kroger (KR -3.05%) lost ground after opting not to reaffirm its guidance or offer new estimates following an earnings beat. In other corporate news, Spotify (SPOT +12.74%) spiked to a new all-time high after signing a Hollywood celebrity to an exclusive podcast deal. Shares of T-Mobile (TMUS +3.66%) rose after raising guidance on net customer additions for the second quarter. |
 Kenneth J. Gruneisen started out as a licensed stockbroker in August 1987, a couple of months prior to the historic stock market crash that took the Dow Jones Industrial Average down -22.6% in a single day. He has published daily fact-based fundamental and technical analysis on high-ranked stocks online for two decades. Through FACTBASEDINVESTING.COM, Kenneth provides educational articles, news, market commentary, and other information regarding proven investment systems that work in good times and bad.
Comments contained in the body of this report are technical opinions only and are not necessarily those of Gruneisen Growth Corp. The material herein has been obtained from sources believed to be reliable and accurate, however, its accuracy and completeness cannot be guaranteed. Our firm, employees, and customers may effect transactions, including transactions contrary to any recommendation herein, or have positions in the securities mentioned herein or options with respect thereto. Any recommendation contained in this report may not be suitable for all investors and it is not to be deemed an offer or solicitation on our part with respect to the purchase or sale of any securities. |
|
 |
Energy-Linked Groups and Biotech Index Rose
Kenneth J. Gruneisen - Passed the CAN SLIM® Master's Exam
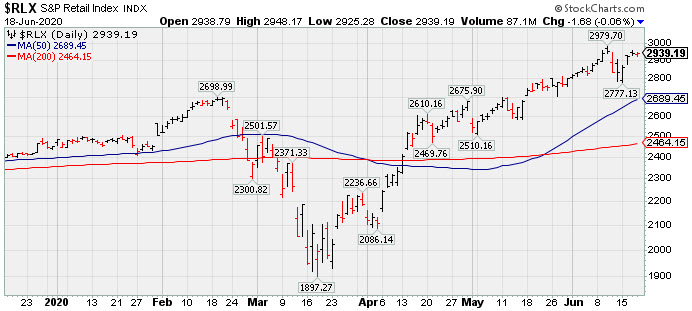
The Broker/Dealer Index ($XBD -0.44%) edged lower as the Retail Index ($RLX -0.06%) and Bank Index ($BKX -0.03%) both finished flat. The tech sector was mixed as the Biotech Index ($BTK +0.41%) edged higher while the Networking Index ($NWX -0.36%) and Semiconductor Index ($SOX -0.20%) both edged lower. Energy-linked groups had a positive bias as the Oil Services Index ($OSX +0.80%) and the Integrated Oil Index ($XOI +1.40%) both rose. The Gold & Silver Index ($XAU -1.60%) lost ground.
PICTURED: The Retail Index ($RLX -0.06%) is consolidating near its all-time high, above near-term support defined by its 50-day moving average (DMA) line and prior highs.
| Oil Services |
$OSX |
35.42 |
+0.28 |
+0.80% |
-54.76% |
| Integrated Oil |
$XOI |
824.08 |
+11.34 |
+1.40% |
-35.14% |
| Semiconductor |
$SOX |
1,980.14 |
-3.94 |
-0.20% |
+7.06% |
| Networking |
$NWX |
558.74 |
-2.00 |
-0.36% |
-4.23% |
| Broker/Dealer |
$XBD |
274.16 |
-1.22 |
-0.44% |
-5.59% |
| Retail |
$RLX |
2,939.19 |
-1.68 |
-0.06% |
+20.00% |
| Gold & Silver |
$XAU |
112.57 |
-1.84 |
-1.61% |
+5.28% |
| Bank |
$BKX |
78.94 |
-0.02 |
-0.03% |
-30.36% |
| Biotech |
$BTK |
5,631.57 |
+23.24 |
+0.41% |
+11.13% |
|
|
|
 |
Formed a Flat Base Perched Within Striking Distance of 52-Week High
Kenneth J. Gruneisen - Passed the CAN SLIM® Master's Exam
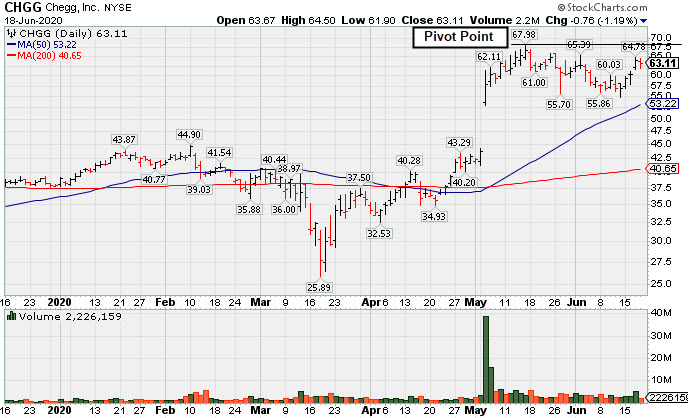
Chegg Inc (CHGG -$0.76 or -1.19% to $63.11) was highlighted in yellow in the prior mid-day report (read here) with a new pivot point cited based on its 5/15/20 high plus 10 cents after a flat 5-week base. Subsequent gains above the pivot point backed by at least +40% above average volume may trigger a technical buy signal.
Bullish action came after it reported earnings +47% on +35% sales revenues for the Mar '20 quarter, continuing its strong earnings track record of earnings increases well above the +25% minimum earnings guideline (C criteria). Annual earnings (A criteria) have been growing at a strong pace since turning profitable in FY '16 following years of losses.. Went through a choppy consolidation since dropped from the Featured Stocks list on 9/03/19. Fundamentals have remained strong. CHGG slumped back below its pivot point and into the prior base since it was last shown in this FSU section on 8/27/19 with an annotated graph under the headline, "Sputtering Below 50-Day Average Line in Recent Weeks".
It completed its $13 IPO in November of 2013 and another new Public Offering in August of 2017. It has 123.6 million shares outstanding. The number of high-ranked funds owning its shares rose from 360 in Sep '18 to 497 in Mar '20, a reassuring sign concerning the I criteria. Its current Up/Down Volume Ratio of 2.5 is an unbiased indication its shares have been under heavy accumulation over the past 50 days. It has earned a Timeliness Rating of A and Sponsorship Rating of C. |
|
|
Color Codes Explained :
Y - Better candidates highlighted by our
staff of experts.
G - Previously featured
in past reports as yellow but may no longer be buyable under the
guidelines.
***Last / Change / Volume data in this table is the closing quote data***
Symbol/Exchange
Company Name
Industry Group |
PRICE |
CHANGE
(%Change) |
Day High |
Volume
(% DAV)
(% 50 day avg vol) |
52 Wk Hi
% From Hi |
Featured
Date |
Price
Featured |
Pivot Featured |
|
Max Buy |
 FTNT
-
NASDAQ
FTNT
-
NASDAQ
Fortinet Inc
Computer Sftwr-Security
|
$135.64
|
+0.16
0.12% |
$136.98
|
1,187,320
66.85% of 50 DAV
50 DAV is 1,776,000
|
$149.69
-9.39%
|
5/7/2020
|
$134.40
|
PP = $121.92
|
|
MB = $128.02
|
 Most Recent Note - 6/18/2020 5:22:00 PM
G - Closed -9.4% off its all-time high today with volume totals cooling during the orderly consolidation. The prior low ($126.88 on 6/15/20) and its 50 DMA line ($126) define important near-term support to watch on pullbacks.
>>> FEATURED STOCK ARTICLE : Managed a "Positive Reversal" After Brief Dip Below "Max Buy" Level - 6/15/2020 |
View all notes |
Set NEW NOTE alert |
Company Profile |
SEC
News |
Chart |
Request a new note
C
A
S
I |
EBS
-
NYSE
Emergent Biosolutions
DRUGS - Biotechnology
|
$70.05
|
+0.10
0.14% |
$71.39
|
446,372
73.06% of 50 DAV
50 DAV is 611,000
|
$93.58
-25.14%
|
6/1/2020
|
$72.10
|
PP = $90.10
|
|
MB = $94.61
|
Most Recent Note - 6/18/2020 5:19:20 PM
G - Subsequent gains and a convincing rebound above the 50 DMA line ($76.14) are still needed to help its outlook improve. Any damaging losses below the recent low ($66.69) may trigger a more worrisome technical sell signal. Fundamentals remain strong.
>>> FEATURED STOCK ARTICLE : Still Below 50-Day Moving Average Following Damaging Gap Down - 6/16/2020 |
View all notes |
Set NEW NOTE alert |
Company Profile |
SEC
News |
Chart |
Request a new note
C
A
S
I |
NBIX
-
NASDAQ
Neurocrine Biosciences
DRUGS - Biotechnology
|
$121.03
|
+1.76
1.48% |
$121.47
|
530,940
64.59% of 50 DAV
50 DAV is 822,000
|
$128.29
-5.66%
|
5/19/2020
|
$123.71
|
PP = $119.75
|
|
MB = $125.74
|
Most Recent Note - 6/16/2020 6:05:42 PM
G - Rebounded near its pivot point with today's 3rd consecutive gain. Recent quarterly comparisons through Mar '20 showed greatly improved sales revenues and earnings increases versus year ago periods (C criteria). After years of losses it reported solid annual earnings (A criteria) in FY '18 and '19.
>>> FEATURED STOCK ARTICLE : Pullback Into Prior Base Negated Recent Breakout - 6/8/2020 |
View all notes |
Set NEW NOTE alert |
Company Profile |
SEC
News |
Chart |
Request a new note
C
A
S
I |
BMRN
-
NASDAQ
Biomarin Pharmaceutical
DRUGS - Drug Manufacturers - Other
|
$113.83
|
+2.51
2.25% |
$115.95
|
1,752,717
110.58% of 50 DAV
50 DAV is 1,585,000
|
$113.84
-0.01%
|
6/17/2020
|
$110.95
|
PP = $112.67
|
|
MB = $118.30
|
Most Recent Note - 6/18/2020 5:16:57 PM
Y - Posted a gain above its pivot point clearing an advanced "3-weeks tight" base pattern with only +34% above average volume behind its 5th consecutive. Subsequent gains above the pivot point backed by at least +40% above average volume may help clinch a convincing technical buy signal. Reported strong results for the Mar '20 quarter and recent comparisons showed improved earnings increases. Annual earnings (A criteria) history has been strong. See the latest FSU analysis for more details and an annotated graph.
>>> FEATURED STOCK ARTICLE : Hit New 52-Week High But Closed Below Pivot After 3-Weeks Tight - 6/17/2020 |
View all notes |
Set NEW NOTE alert |
Company Profile |
SEC
News |
Chart |
Request a new note
C
A
S
I |
AMD
-
NASDAQ
Advanced Micro Devices
ELECTRONICS - Semiconductor - Broad Line
|
$54.04
|
-0.51
-0.93% |
$55.12
|
40,094,061
60.72% of 50 DAV
50 DAV is 66,030,000
|
$59.27
-8.82%
|
6/9/2020
|
$55.41
|
PP = $56.98
|
|
MB = $59.83
|
Most Recent Note - 6/16/2020 6:13:38 PM
Y - Consolidating above important support at its 50 DMA line ($53.61) with volume totals cooling. Subsequent gains above the pivot point backed by at least +40% above average volume are still needed to trigger a convincing technical buy signal. Previously met stubborn resistance in the $57-59 area. Gains into new high territory may mark the beginning of a substantial leg higher. The 3 latest quarterly comparisons through Mar '20 showed very strong earnings increases with greatly improved sales revenues growth in the Dec '19 and Mar '20 comparisons versus the year ago period.
>>> FEATURED STOCK ARTICLE : Big Chip Firm Showing Strong Sales Revenues and Earnings Increases - 6/9/2020 |
View all notes |
Set NEW NOTE alert |
Company Profile |
SEC
News |
Chart |
Request a new note
C
A
S
I |
Symbol/Exchange
Company Name
Industry Group |
PRICE |
CHANGE
(%Change) |
Day High |
Volume
(% DAV)
(% 50 day avg vol) |
52 Wk Hi
% From Hi |
Featured
Date |
Price
Featured |
Pivot Featured |
|
Max Buy |
TREX
-
NYSE
Trex Company Inc
MATERIALS and CONSTRUCTION - General Building Materials
|
$119.96
|
-0.47
-0.39% |
$121.88
|
507,522
51.01% of 50 DAV
50 DAV is 995,000
|
$132.84
-9.70%
|
5/5/2020
|
$109.05
|
PP = $111.95
|
|
MB = $117.55
|
Most Recent Note - 6/15/2020 5:48:50 PM
Y - Managed a "positive reversal" today and closed near its "max buy" level. Prior highs in the $111 area define important support to watch above its 50 DMA line ($104.27). Fundamentals remain strong.
>>> FEATURED STOCK ARTICLE : Pullback Toward Prior Highs Which Define Near-Term Support - 6/11/2020 |
View all notes |
Set NEW NOTE alert |
Company Profile |
SEC
News |
Chart |
Request a new note
C
A
S
I |
NFLX
-
NASDAQ
Netflix Inc
SPECIALTY RETAIL - Music and Video Stores
|
$449.87
|
+2.10
0.47% |
$452.76
|
4,159,057
51.23% of 50 DAV
50 DAV is 8,118,000
|
$458.97
-1.98%
|
5/14/2020
|
$441.95
|
PP = $449.62
|
|
MB = $472.10
|
Most Recent Note - 6/17/2020 6:10:58 PM
Y - Found support near its 50 DMA line ($424.61) recently and posted a 3rd consecutive gain today with below average volume. Subsequent volume-driven gains above the pivot point may trigger a new (or add-on) technical buy signal. Any damaging losses below the 50 DMA line and prior lows would trigger a more worrisome technical sell signal.
>>> FEATURED STOCK ARTICLE : Weak Action Led to 50-Day Moving Average Violation - 6/12/2020 |
View all notes |
Set NEW NOTE alert |
Company Profile |
SEC
News |
Chart |
Request a new note
C
A
S
I |
CHGG
-
NYSE
Chegg Inc
Consumer Svcs-Education
|
$63.11
|
-0.76
-1.19% |
$64.50
|
2,200,543
56.89% of 50 DAV
50 DAV is 3,868,000
|
$67.98
-7.16%
|
6/17/2020
|
$63.71
|
PP = $68.08
|
|
MB = $71.48
|
Most Recent Note - 6/18/2020 5:07:45 PM
Y - Pulled back with lighter volume today. Highlighted in yellow in the prior mid-day report with a new pivot point cited based on its 5/15/20 high plus 10 cents after a flat 5-week base. Subsequent gains above the pivot point backed by at least +40% above average volume may trigger a technical buy signal. Bullish action came after it reported earnings +47% on +35% sales revenues for the Mar '20 quarter. Went through a choppy consolidation since dropped from the Featured Stocks list on 9/03/19. Fundamentals have remained strong. See the latest FSU analysis for more details and a new annotated graph.
>>> FEATURED STOCK ARTICLE : Formed a Flat Base Perched Within Striking Distance of 52-Week High - 6/18/2020 |
View all notes |
Set NEW NOTE alert |
Company Profile |
SEC
News |
Chart |
Request a new note
C
A
S
I |
NOW
-
NYSE
Servicenow Inc
Computer Sftwr-Enterprse
|
$401.03
|
+0.38
0.09% |
$404.49
|
1,307,825
60.89% of 50 DAV
50 DAV is 2,148,000
|
$407.59
-1.61%
|
4/30/2020
|
$343.05
|
PP = $363.05
|
|
MB = $381.20
|
Most Recent Note - 6/16/2020 6:21:44 PM
G - Posted a 3rd consecutive gain today with below average volume for its second best ever close. Recent gains above the pivot point were not backed by the +40% above average volume necessary to clinch a proper technical buy signal. Prior highs in the $362 area define initial support to watch above its 50 DMA line ($349.24).
>>> FEATURED STOCK ARTICLE : Quiet Pullback Below "Max Buy" Level for NOW - 6/4/2020 |
View all notes |
Set NEW NOTE alert |
Company Profile |
SEC
News |
Chart |
Request a new note
C
A
S
I |
TEAM
-
NASDAQ
Atlassian Corp Plc Cl A
Comp Sftwr-Spec Enterprs
|
$177.63
|
+0.92
0.52% |
$179.83
|
1,428,413
72.95% of 50 DAV
50 DAV is 1,958,000
|
$191.72
-7.35%
|
5/4/2020
|
$159.70
|
PP = $156.22
|
|
MB = $164.03
|
Most Recent Note - 6/16/2020 6:11:41 PM
G - Managed a "positive reversal" today for a gain with higher volume. Consolidating above its 50 DMA line ($165.65) which defines important near-term support above prior highs in the $156 area.
>>> FEATURED STOCK ARTICLE : Positive Reversal Near Prior High and 50 DMA Line - 6/5/2020 |
View all notes |
Set NEW NOTE alert |
Company Profile |
SEC
News |
Chart |
Request a new note
C
A
S
I |
Symbol/Exchange
Company Name
Industry Group |
PRICE |
CHANGE
(%Change) |
Day High |
Volume
(% DAV)
(% 50 day avg vol) |
52 Wk Hi
% From Hi |
Featured
Date |
Price
Featured |
Pivot Featured |
|
Max Buy |
TTD
-
NASDAQ
The Trade Desk Inc Cl A
Comml Svcs-Advertising
|
$394.39
|
+11.95
3.12% |
$396.49
|
1,782,001
82.16% of 50 DAV
50 DAV is 2,169,000
|
$395.04
-0.16%
|
6/3/2020
|
$240.61
|
PP = $327.35
|
|
MB = $343.72
|
Most Recent Note - 6/18/2020 5:13:00 PM
G - Hit another new high today with below average volume behind its 5th consecutive gain. Prior highs in the $327 area define important near-term support.
>>> FEATURED STOCK ARTICLE : Trade Desk Posts Powerful Gain for New High - 6/3/2020 |
View all notes |
Set NEW NOTE alert |
Company Profile |
SEC
News |
Chart |
Request a new note
C
A
S
I |
DOCU
-
NASDAQ
Docusign Inc
Computer Sftwr-Enterprse
|
$162.30
|
+0.59
0.36% |
$163.60
|
5,889,394
145.35% of 50 DAV
50 DAV is 4,052,000
|
$167.87
-3.32%
|
6/10/2020
|
$149.73
|
PP = $152.10
|
|
MB = $159.71
|
Most Recent Note - 6/16/2020 12:34:18 PM
G - Color code was changed to green after rallying above its "max buy" level on the prior session. Posted a big gain above the pivot point backed by +107% above average volume triggering a new (or add-on) technical buy signal.
>>> FEATURED STOCK ARTICLE : Advanced Ascending Base Formed for Strong E-Signature Firm - 6/10/2020 |
View all notes |
Set NEW NOTE alert |
Company Profile |
SEC
News |
Chart |
Request a new note
C
A
S
I |
PING
-
NYSE
Ping Identity Hldg Corp
Computer Sftwr-Security
|
$34.09
|
+2.70
8.60% |
$34.52
|
2,147,114
174.00% of 50 DAV
50 DAV is 1,234,000
|
$31.91
6.83%
|
6/1/2020
|
$29.24
|
PP = $29.90
|
|
MB = $31.40
|
Most Recent Note - 6/18/2020 12:29:35 PM
G - Hit a new all-time high and traded above its "max buy" level with volume running at an above average pace behind today's 3rd consecutive solid gain. Color code is changed to green. Last noted on 6/16/20 - "Subsequent gains for a new high close backed by at least +40% above average volume may help clinch a convincing technical buy signal. Found support at its 20-day moving average line ($28.44). More damaging losses below it and the prior low ($27.51 on 6/04/20) would raise greater concerns and trigger more worrisome technical sell signals."
>>> FEATURED STOCK ARTICLE : Strong Gain for New High Backed by 127% Above Average Volume - 6/1/2020 |
View all notes |
Set NEW NOTE alert |
Company Profile |
SEC
News |
Chart |
Request a new note
C
A
S
I |
AAXN
-
NASDAQ
Axon Enterprise Inc
Security/Sfty
|
$91.81
|
-3.04
-3.21% |
$96.35
|
1,176,675
106.68% of 50 DAV
50 DAV is 1,103,000
|
$104.90
-12.48%
|
5/8/2020
|
$84.86
|
PP = $90.20
|
|
MB = $94.71
|
Most Recent Note - 6/18/2020 5:11:19 PM
Y - Color code is changed to yellow after pulling back below its "max buy" level with a loss today on lighter (near average) volume. Completed a new Pubic Offering on 6/17/20. Prior highs in the $90-91 area have acted as support following a powerful breakout.
>>> FEATURED STOCK ARTICLE : Quietly Slumping Near 50-Day Moving Average Line - 5/28/2020 |
View all notes |
Set NEW NOTE alert |
Company Profile |
SEC
News |
Chart |
Request a new note
C
A
S
I |
GDDY
-
NYSE
Godaddy Inc Cl A
Computer Sftwr-Enterprse
|
$80.15
|
+0.23
0.29% |
$80.42
|
880,109
65.98% of 50 DAV
50 DAV is 1,334,000
|
$82.47
-2.81%
|
6/2/2020
|
$79.62
|
PP = $82.40
|
|
MB = $86.52
|
Most Recent Note - 6/18/2020 5:23:19 PM
Y - Posted a 5th consecutive gain today with below average volume. Perched within close striking distance of its 52-week high. Subsequent gains above the pivot point backed by at least +40% above average volume are needed to trigger a proper technical buy signal. It previously met stubborn resistance in the $82-84 area.
>>> FEATURED STOCK ARTICLE : Godaddy Could Be Ready to Go for New Highs - 6/2/2020 |
View all notes |
Set NEW NOTE alert |
Company Profile |
SEC
News |
Chart |
Request a new note
C
A
S
I |
Symbol/Exchange
Company Name
Industry Group |
PRICE |
CHANGE
(%Change) |
Day High |
Volume
(% DAV)
(% 50 day avg vol) |
52 Wk Hi
% From Hi |
Featured
Date |
Price
Featured |
Pivot Featured |
|
Max Buy |
|
|
|
THESE ARE NOT BUY RECOMMENDATIONS!
Comments contained in the body of this report are technical
opinions only. The material herein has been obtained
from sources believed to be reliable and accurate, however,
its accuracy and completeness cannot be guaranteed.
This site is not an investment advisor, hence it does
not endorse or recommend any securities or other investments.
Any recommendation contained in this report may not
be suitable for all investors and it is not to be deemed
an offer or solicitation on our part with respect to
the purchase or sale of any securities. All trademarks,
service marks and trade names appearing in this report
are the property of their respective owners, and are
likewise used for identification purposes only.
This report is a service available
only to active Paid Premium Members.
You may opt-out of receiving report notifications
at any time. Questions or comments may be submitted
by writing to Premium Membership Services 665 S.E. 10 Street, Suite 201 Deerfield Beach, FL 33441-5634 or by calling 1-800-965-8307
or 954-785-1121.
|
|
|