You are not logged in.
This means you
CAN ONLY VIEW reports that were published prior to Monday, April 14, 2025.
You
MUST UPGRADE YOUR MEMBERSHIP if you want to see any current reports.
AFTER MARKET UPDATE - TUESDAY, JUNE 18TH, 2013
Previous After Market Report Next After Market Report >>>
|
|
|
|
DOW |
+138.38 |
15,318.23 |
+0.91% |
|
Volume |
646,026,970 |
-5% |
|
Volume |
1,529,678,200 |
-1% |
|
NASDAQ |
+30.05 |
3,482.18 |
+0.87% |
|
Advancers |
2,070 |
66% |
|
Advancers |
1,729 |
67% |
|
S&P 500 |
+12.77 |
1,651.81 |
+0.78% |
|
Decliners |
977 |
31% |
|
Decliners |
749 |
29% |
|
Russell 2000 |
+12.15 |
999.99 |
+1.23% |
|
52 Wk Highs |
158 |
|
|
52 Wk Highs |
169 |
|
|
S&P 600 |
+6.84 |
561.72 |
+1.23% |
|
52 Wk Lows |
58 |
|
|
52 Wk Lows |
18 |
|
|
 |
Major Averages Rose With Positive Breadth But Less Volume
Kenneth J. Gruneisen - Passed the CAN SLIM® Master's Exam
The major averages rose to close near their best levels of the session on Tuesday. The volume totals were reported near or lower than the prior session totals on the NYSE and on the Nasdaq exchange, a hint that institutional investors were not increasing their buying efforts while the market rose. Breadth was positive as advancers led decliners by more than 2-1 on both the NYSE and Nasdaq exchange. There were 72 high-ranked companies from the CANSLIM.net Leaders List making new 52-week highs and appearing on the CANSLIM.net BreakOuts Page, up from the prior session total of 53 stocks. Stocks hitting new 52-week highs outnumbered new 52-week lows on the NYSE and on the Nasdaq exchange. There were gains for only 5 of the 11 high-ranked companies currently included on the Featured Stocks Page, a disconcertingly weak showing from leading stocks versus the broader market's bullish bias on the day.

The major average advanced for a second consecutive day as investors await the results of the Fed’s two-day policy for indications whether the central bank may start tapering its $85 billion a month bond-buying program. The market was also higher after this morning's economic releases. Before the open, a report showed prices paid by consumers edged +0.1% higher in May, slightly below projections for a +0.2% increase. Food prices declined for the first time in four years. Excluding food and energy, the consumer price index rose +0.2%, in line with consensus estimates. Separate releases showed housing starts were up +6.8% to 914,000 from a revised 856,000 in April while building permits fell -3.1% to 974,000 last month.
All 10 sectors in the S&P 500 advanced on the session. General Electric Co (GE +2.36%) and FedEx Corp (FDX +1.09%) rose as Industrials were the best performing group. Tech shares including Garmin Ltd (GRMN +2.35%) and financial companies including American Express Co (AXP +1.54%) also advanced on the session. Telecom and consumer discretionary stocks outperformed as AT&T Inc (T +1.15%) and Best Buy Co Inc (BBY +2.37%).Consumer staples were the worst performing sector with Hormel Foods Corp (HRL -3.59%) down after the meat producer lowered its full-year earnings forecast.
Treasuries were little changed with the 10-year note flat to yield 2.18%.
A follow-through day of meaningful gains from at least one of the major averages on higher volume is an important reassurance to watch for in the near-term before investors might seriously consider new buying efforts. Last week the market (M criteria) weakness was labeled a "correction" as this commentary reminded members - "Be protective of any gains, and limit losses! Be especially watchful for any individual issues flashing technical sell signals. It is vitally important to your success with the fact-based investment system to reduce exposure and preserve cash during market downdrafts."
As always, watch upcoming CANSLIM.net reports for new action-worthy leaders best matching the winning models to be covered as they emerge and then included on the Featured Stocks Page - with our Certified experts' latest notes and links to additional resources including detailed analysis with annotated graphs. The Premium Member Homepage - includes "dynamic archives" to all prior pay reports published. Watch for an announcement via email concerning the next WEBCAST.
PICTURED: The S&P 500 Index found support near its 50-day moving average (DMA) line and a multi-month upward trendline defining important near-term support. The window is now open for a follow-through day (FTD) of gains from the major averages within the most ideal period 4-7 days after the major averages halted their latest slide.
|
 Kenneth J. Gruneisen started out as a licensed stockbroker in August 1987, a couple of months prior to the historic stock market crash that took the Dow Jones Industrial Average down -22.6% in a single day. He has published daily fact-based fundamental and technical analysis on high-ranked stocks online for two decades. Through FACTBASEDINVESTING.COM, Kenneth provides educational articles, news, market commentary, and other information regarding proven investment systems that work in good times and bad.
Comments contained in the body of this report are technical opinions only and are not necessarily those of Gruneisen Growth Corp. The material herein has been obtained from sources believed to be reliable and accurate, however, its accuracy and completeness cannot be guaranteed. Our firm, employees, and customers may effect transactions, including transactions contrary to any recommendation herein, or have positions in the securities mentioned herein or options with respect thereto. Any recommendation contained in this report may not be suitable for all investors and it is not to be deemed an offer or solicitation on our part with respect to the purchase or sale of any securities. |
|
 |
Medical, Retail, Financial and Tech Groups Led Gainers
Kenneth J. Gruneisen - Passed the CAN SLIM® Master's Exam
Medical related shares had a positive bias as the Healthcare Index ($HMO +2.08%) and the Biotechnology Index ($BTK +1.20%) posted gains. The Semiconductor Index ($SOX +1.63%) led the tech sector higher while the Internet Index ($IIX +0.87%) and the Networking Index ($NWX +0.58%) posted smaller gains. The Retail Index ($RLX +1.05%) and gains in financial shares added a positive influence on the major averages as the Bank Index ($BKX +0.81%) and the Broker/Dealer Index ($XBD +0.96%) both ratcheted higher. Gains in energy-related shares also boosted the Oil Services Index ($OSX +0.72%) and the Integrated Oil Index ($XOI +0.27%). Meanwhile, the Gold & Silver Index ($XAU -2.61%) was a clear laggard as the classic "safe haven" group slumped for a big loss on the mostly positive session.
Charts courtesy www.stockcharts.com
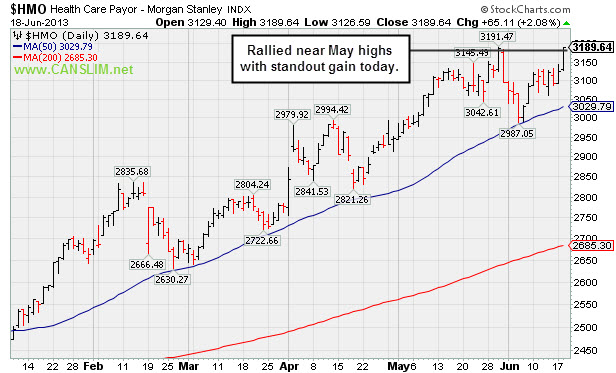
PICTURED: The Healthcare Index ($HMO +2.08%) was a standout gainer as it rallied near its May high.
| Oil Services |
$OSX |
259.46 |
+1.85 |
+0.72% |
+17.85% |
| Healthcare |
$HMO |
3,189.64 |
+65.11 |
+2.08% |
+26.87% |
| Integrated Oil |
$XOI |
1,379.73 |
+3.73 |
+0.27% |
+11.10% |
| Semiconductor |
$SOX |
480.06 |
+7.72 |
+1.63% |
+25.00% |
| Networking |
$NWX |
265.49 |
+1.52 |
+0.58% |
+17.19% |
| Internet |
$IIX |
385.44 |
+3.33 |
+0.87% |
+17.87% |
| Broker/Dealer |
$XBD |
127.65 |
+1.22 |
+0.96% |
+35.33% |
| Retail |
$RLX |
800.35 |
+8.28 |
+1.05% |
+22.55% |
| Gold & Silver |
$XAU |
100.32 |
-2.69 |
-2.61% |
-39.42% |
| Bank |
$BKX |
61.11 |
+0.49 |
+0.81% |
+19.17% |
| Biotech |
$BTK |
1,927.32 |
+22.81 |
+1.20% |
+24.58% |
|
|
|
 |
Wedging Higher on Track for 9th Weekly Gain
Kenneth J. Gruneisen - Passed the CAN SLIM® Master's Exam
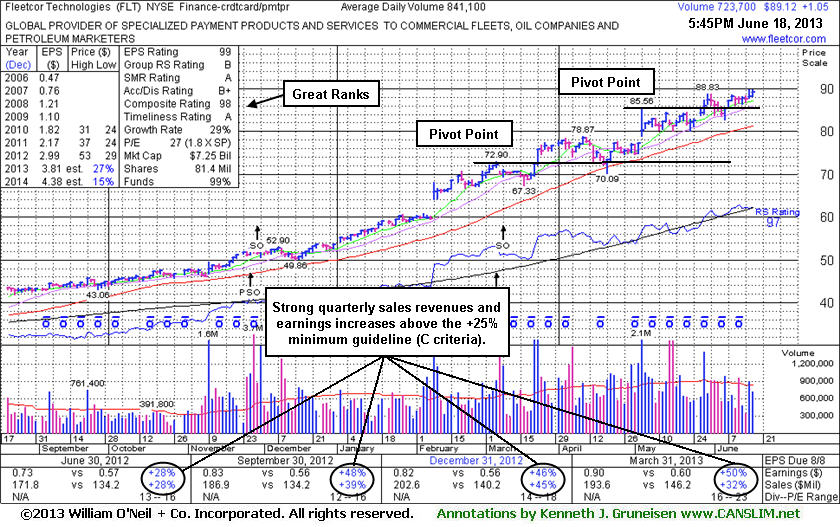
FleetCor Technologies, Inc. (FLT +$1.05 or +1.19% to $89.12) has been wedging to new all-time highs without especially strong volume behind its latest gains. FLT currently has a 9-week winning streak going and it was last shown in this FSU section on 5/31/13 with an annotated graph under the headline, "Institutional Accumulation Lifted This Leader", after noted in the mid-day report on 5/29/13 with a new pivot point cited based on its 5/03/13 high, and it rose from an advanced "3-weeks tight" base with a gain on the session backed by +56% above average volume. It may go on to produce more climactic gains, however this was a riskier "late-stage" base. Its 50-day moving average (DMA) line defines support where a violation would raise concerns and trigger a technical sell signal.
It reported earnings +50% on +32% sales for the Mar '13 quarter, marking its 5th consecutive quarterly comparison with earnings above the +25% guideline (C criteria). The company completed another Secondary Offering on 3/08/13 after a streak of volume-driven gains into new high territory. On 3/14/12, 6/11/12, and 11/29/12 it priced Secondary Offerings and it was previously noted, "Such offerings often are a short-term hindrance to upward price progress yet typically result in broader institutional ownership interest."
The number of top-rated funds owning its shares rose from 193 in Mar '12 to 365 in Mar '13, a reassuring sign concerning the I criteria. Its current Up/Down Volume Ratio of 1.5 is also an unbiased indication that its shares have been under accumulation over the past 50 days. The company hails from the Finance - Credit Card Payment Processing group which currently has a mediocre 65 Group Relative Strength Rating, however impressive strength and leadership from a couple of other firms in the same industry group is considered sufficient reassurance concerning the L criteria.
|
|
|
Color Codes Explained :
Y - Better candidates highlighted by our
staff of experts.
G - Previously featured
in past reports as yellow but may no longer be buyable under the
guidelines.
***Last / Change / Volume data in this table is the closing quote data***
Symbol/Exchange
Company Name
Industry Group |
PRICE |
CHANGE
(%Change) |
Day High |
Volume
(% DAV)
(% 50 day avg vol) |
52 Wk Hi
% From Hi |
Featured
Date |
Price
Featured |
Pivot Featured |
|
Max Buy |
AL
-
NYSE
Air Lease Corp Cl A
DIVERSIFIED SERVICES - Rental and Leasing Services
|
$28.40
|
+0.55
1.97% |
$28.46
|
283,913
50.78% of 50 DAV
50 DAV is 559,100
|
$31.00
-8.39%
|
5/9/2013
|
$30.95
|
PP = $29.38
|
|
MB = $30.85
|
Most Recent Note - 6/17/2013 1:14:30 PM
G - Still consolidating just below its 50 DMA line which may act as resistance. Completed a Secondary Offering on 5/31/13.
>>> The latest Featured Stock Update with an annotated graph appeared on 6/17/2013. Click here.
View all notes |
Alert me of new notes |
CANSLIM.net Company Profile |
SEC |
Zacks Reports |
StockTalk |
News |
Chart |
Request a new note
C
A N
S L
I M


|
AMBA
-
NASDAQ
Ambarella Inc
ELECTRONICS - Semiconductor - Specialized
|
$17.91
|
-0.23
-1.27% |
$18.58
|
1,336,418
131.86% of 50 DAV
50 DAV is 1,013,500
|
$18.21
-1.65%
|
5/6/2013
|
$15.31
|
PP = $16.10
|
|
MB = $16.91
|
 Most Recent Note - 6/18/2013 12:10:25 PM
G - Reversed into the red after touching a new 52-week high today following 3 consecutive gains. Tallied 8 consecutive weekly gains. Recent lows and its 50 DMA line ($15.03 now) define important chart support to watch on pullbacks.
>>> The latest Featured Stock Update with an annotated graph appeared on 6/14/2013. Click here.
View all notes |
Alert me of new notes |
CANSLIM.net Company Profile |
SEC |
Zacks Reports |
StockTalk |
News |
Chart |
Request a new note
C
A N
S L
I M
|
EQM
-
NYSE
E Q T Midstream Partners
ENERGY - Oil and Gas Pipelines
|
$50.57
|
-0.05
-0.10% |
$51.52
|
176,287
146.78% of 50 DAV
50 DAV is 120,100
|
$51.72
-2.22%
|
4/25/2013
|
$40.16
|
PP = $40.84
|
|
MB = $42.88
|
Most Recent Note - 6/17/2013 12:24:34 PM
G - Gapped up for a 2nd consecutive considerable gain with volume running at an above average pace while challenging its 52-week high. Recent low and its 50 DMA line define important near-term support in the $45 area.
>>> The latest Featured Stock Update with an annotated graph appeared on 6/6/2013. Click here.
View all notes |
Alert me of new notes |
CANSLIM.net Company Profile |
SEC |
Zacks Reports |
StockTalk |
News |
Chart |
Request a new note
C
A N
S L
I M
|
FLT
-
NYSE
Fleetcor Technologies
DIVERSIFIED SERVICES - Business/Management Services
|
$89.12
|
+1.05
1.19% |
$89.74
|
723,722
86.04% of 50 DAV
50 DAV is 841,100
|
$89.75
-0.70%
|
5/29/2013
|
$86.02
|
PP = $85.66
|
|
MB = $89.94
|
Most Recent Note - 6/18/2013 6:06:29 PM
Y- Recently wedging to new all-time highs without great volume conviction, on track for a 9th consecutive weekly gain. See the latest FSU analysis for more details and a new annotated graph.
>>> The latest Featured Stock Update with an annotated graph appeared on 6/18/2013. Click here.
View all notes |
Alert me of new notes |
CANSLIM.net Company Profile |
SEC |
Zacks Reports |
StockTalk |
News |
Chart |
Request a new note
C
A N
S L
I M
|
LOPE
-
NASDAQ
Grand Canyon Education
DIVERSIFIED SERVICES - Education and; Training Services
|
$31.18
|
-0.50
-1.58% |
$31.98
|
418,054
107.58% of 50 DAV
50 DAV is 388,600
|
$34.07
-8.48%
|
5/10/2013
|
$29.03
|
PP = $27.28
|
|
MB = $28.64
|
Most Recent Note - 6/14/2013 6:24:44 PM
G - Volume totals have still been cooling while holding its ground stubbornly, extended from its previous base. Its 50 DMA line defines initial support above prior highs in the $27 area.
>>> The latest Featured Stock Update with an annotated graph appeared on 6/3/2013. Click here.
View all notes |
Alert me of new notes |
CANSLIM.net Company Profile |
SEC |
Zacks Reports |
StockTalk |
News |
Chart |
Request a new note
C
A N
S L
I M
|
Symbol/Exchange
Company Name
Industry Group |
PRICE |
CHANGE
(%Change) |
Day High |
Volume
(% DAV)
(% 50 day avg vol) |
52 Wk Hi
% From Hi |
Featured
Date |
Price
Featured |
Pivot Featured |
|
Max Buy |
MRLN
-
NASDAQ
Marlin Business Services
DIVERSIFIED SERVICES - Rental and Leasing Services
|
$22.93
|
-0.15
-0.65% |
$23.11
|
27,892
115.26% of 50 DAV
50 DAV is 24,200
|
$25.97
-11.71%
|
3/15/2013
|
$22.29
|
PP = $23.18
|
|
MB = $24.34
|
Most Recent Note - 6/17/2013 1:08:17 PM
G - Slumping below its 50 DMA line today, weak amid a mostly positive market, and its color code is changed to green. Churned above average volume without making meaningful price progress in the past 2 weeks. Up/Down Volume Ratio is currently 0.7 which is an unbiased indication it has been encountering distributional pressure over the past 50 days. The recent low ($21.49 on 5/23/13) defines important near-term chart support where a violation would raise more serious concerns.
>>> The latest Featured Stock Update with an annotated graph appeared on 6/11/2013. Click here.
View all notes |
Alert me of new notes |
CANSLIM.net Company Profile |
SEC |
Zacks Reports |
StockTalk |
News |
Chart |
Request a new note
C
A N
S L
I M
|
NSM
-
NYSE
Nationstar Mtg Hldgs Inc
FINANCIAL SERVICES - Credit Services
|
$43.12
|
+0.92
2.18% |
$43.20
|
581,004
49.43% of 50 DAV
50 DAV is 1,175,300
|
$46.91
-8.08%
|
5/7/2013
|
$39.71
|
PP = $42.34
|
|
MB = $44.46
|
Most Recent Note - 6/13/2013 5:18:49 PM
Y - Volume totals have been cooling in recent weeks while consolidating near prior highs and above its 50 DMA line. Disciplined investors always limit losses if any stock falls more than -7% from their purchase price. See the latest FSU analysis for more details and a new annotated graph.
>>> The latest Featured Stock Update with an annotated graph appeared on 6/13/2013. Click here.
View all notes |
Alert me of new notes |
CANSLIM.net Company Profile |
SEC |
Zacks Reports |
StockTalk |
News |
Chart |
Request a new note
C
A N
S L
I M
|
PRAA
-
NASDAQ
Portfolio Recovery Assoc
DIVERSIFIED SERVICES - Business/Management Services
|
$160.23
|
-1.37
-0.85% |
$163.43
|
114,687
154.77% of 50 DAV
50 DAV is 74,100
|
$163.87
-2.22%
|
5/1/2013
|
$130.77
|
PP = $127.88
|
|
MB = $134.27
|
Most Recent Note - 6/18/2013 1:00:49 PM
G - On track for a 5th consecutive gain and perched at its all-time high today extended from any sound base. It has rallied with no resistance due to overhead supply, and its 50 DMA line ($139.85 now) defines important chart support.
>>> The latest Featured Stock Update with an annotated graph appeared on 6/10/2013. Click here.
View all notes |
Alert me of new notes |
CANSLIM.net Company Profile |
SEC |
Zacks Reports |
StockTalk |
News |
Chart |
Request a new note
C
A N
S L
I M
|
PRLB
-
NYSE
Proto Labs Inc
MANUFACTURING - Small Tools and Accessories
|
$62.53
|
+3.07
5.16% |
$63.50
|
1,198,034
230.26% of 50 DAV
50 DAV is 520,300
|
$59.84
4.50%
|
6/17/2013
|
$59.37
|
PP = $59.94
|
|
MB = $62.94
|
Most Recent Note - 6/18/2013 1:04:07 PM
Y- Gapped up again today, tallying a 4th consecutive gain and powering to a new 52-week high and above its pivot point with above average volume. On the prior session a new pivot point was cited based on its 5/10/13 high plus 10 cents as it was noted - "Volume-driven gains above the pivot point may trigger a new (or add-on) technical buy signal."
>>> The latest Featured Stock Update with an annotated graph appeared on 6/12/2013. Click here.
View all notes |
Alert me of new notes |
CANSLIM.net Company Profile |
SEC |
Zacks Reports |
StockTalk |
News |
Chart |
Request a new note
C
A N
S L
I M
|
RRTS
-
NYSE
Roadrunner Trans Systems
TRANSPORTATION - Air Delivery and Freight Service
|
$28.00
|
-0.24
-0.85% |
$28.50
|
135,952
63.98% of 50 DAV
50 DAV is 212,500
|
$29.52
-5.15%
|
4/3/2013
|
$22.77
|
PP = $23.75
|
|
MB = $24.94
|
Most Recent Note - 6/18/2013 6:10:41 PM
G - Following a "negative reversal" at its 52-week high on the prior session it pulled back today, meanwhile while the market had a positive bias. Fundamental concerns were raised by its sub par earnings increase in the Mar '13 quarter, below the +25% minimum guideline (C criteria).
>>> The latest Featured Stock Update with an annotated graph appeared on 6/4/2013. Click here.
View all notes |
Alert me of new notes |
CANSLIM.net Company Profile |
SEC |
Zacks Reports |
StockTalk |
News |
Chart |
Request a new note
C
A N
S L
I M
|
Symbol/Exchange
Company Name
Industry Group |
PRICE |
CHANGE
(%Change) |
Day High |
Volume
(% DAV)
(% 50 day avg vol) |
52 Wk Hi
% From Hi |
Featured
Date |
Price
Featured |
Pivot Featured |
|
Max Buy |
VRX
-
NYSE
Valeant Pharmaceuticals
DRUGS - Drug Manufacturers - Other
|
$85.86
|
+1.04
1.23% |
$88.67
|
2,439,756
144.90% of 50 DAV
50 DAV is 1,683,800
|
$96.25
-10.79%
|
4/30/2013
|
$60.24
|
PP = $76.66
|
|
MB = $80.49
|
Most Recent Note - 6/14/2013 6:27:45 PM
G- Concerns were raised by its sub par Mar '13 earnings report, however mostly bullish action has followed.Volume totals have been cooling while consolidating above prior highs. Support to watch is at prior highs coinciding with its 50 DMA near $76.
>>> The latest Featured Stock Update with an annotated graph appeared on 6/7/2013. Click here.
View all notes |
Alert me of new notes |
CANSLIM.net Company Profile |
SEC |
Zacks Reports |
StockTalk |
News |
Chart |
Request a new note
C
A N
S L
I M
|
|
|
|
THESE ARE NOT BUY RECOMMENDATIONS!
Comments contained in the body of this report are technical
opinions only. The material herein has been obtained
from sources believed to be reliable and accurate, however,
its accuracy and completeness cannot be guaranteed.
This site is not an investment advisor, hence it does
not endorse or recommend any securities or other investments.
Any recommendation contained in this report may not
be suitable for all investors and it is not to be deemed
an offer or solicitation on our part with respect to
the purchase or sale of any securities. All trademarks,
service marks and trade names appearing in this report
are the property of their respective owners, and are
likewise used for identification purposes only.
This report is a service available
only to active Paid Premium Members.
You may opt-out of receiving report notifications
at any time. Questions or comments may be submitted
by writing to Premium Membership Services 665 S.E. 10 Street, Suite 201 Deerfield Beach, FL 33441-5634 or by calling 1-800-965-8307
or 954-785-1121.
|
|
|

