You are not logged in.
This means you
CAN ONLY VIEW reports that were published prior to Monday, April 14, 2025.
You
MUST UPGRADE YOUR MEMBERSHIP if you want to see any current reports.
AFTER MARKET UPDATE - MONDAY, JUNE 17TH, 2013
Previous After Market Report Next After Market Report >>>
|
|
|
|
DOW |
+109.67 |
15,179.85 |
+0.73% |
|
Volume |
679,133,750 |
+7% |
|
Volume |
1,539,762,850 |
+9% |
|
NASDAQ |
+28.57 |
3,452.13 |
+0.83% |
|
Advancers |
2,035 |
65% |
|
Advancers |
1,588 |
61% |
|
S&P 500 |
+12.31 |
1,639.04 |
+0.76% |
|
Decliners |
1,007 |
32% |
|
Decliners |
903 |
35% |
|
Russell 2000 |
+6.46 |
987.84 |
+0.66% |
|
52 Wk Highs |
138 |
|
|
52 Wk Highs |
118 |
|
|
S&P 600 |
+3.90 |
554.88 |
+0.71% |
|
52 Wk Lows |
22 |
|
|
52 Wk Lows |
24 |
|
|
 |
Major Averages Rose With Better Volume Behind Gains
Kenneth J. Gruneisen - Passed the CAN SLIM® Master's Exam
On Monday the major averages finished with solid gains. The volume totals were reported higher than the prior session total on the NYSE and on the Nasdaq exchange, a reassuring sign that institutional investors increased their buying efforts. Breadth was positive as advancers led decliners by more than 2-1 on the NYSE and by nearly a 2-1 margin on the Nasdaq exchange. There were 53 high-ranked companies from the CANSLIM.net Leaders List making new 52-week highs and appearing on the CANSLIM.net BreakOuts Page, up from the prior session total of 33 stocks. The number of stocks hitting new 52-week highs outnumbered new 52-week lows on the NYSE and on the Nasdaq exchange. There were gains for 7 of the 11 high-ranked companies currently included on the Featured Stocks Page
The major averages ended the session in positive territory ahead of the Fed's two-day monetary policy meeting. Better-than-expected economic data also provided a tailwind to the market. Before the open, a report showed manufacturing activity in New York unexpectedly expanded in June. A separate release revealed homebuilder sentiment increased to its best level in seven years. Stocks pared gains heading into the closing bell after an article in the Financial Times suggested Chairman Bernanke may signal the central bank is close to tapering its bond-buying program during his press conference on Wednesday.
Nine of 10 sectors in the S&P 500 advanced on the session. Hess Corp (HES +2.30%) and Cisco Systems Inc (CSCO +2.53%) tallied gains as energy and technology were the best performing groups. Telecom was the worst performing sector with Verizon Communications Inc (VZ -0.70%) ended with a loss. Netflix Inc (NFLX +7.1%) was a notable gainer, rallying after announcing a content deal with DreamWorks Animation.
Treasuries were mostly lower with the 10-year note down 11/32 to yield 2.17%.
The damage worsened last week and the market (M criteria) weakness was labeled a "correction" as this commentary reminded members - "Be protective of any gains, and limit losses! Be especially watchful for any individual issues flashing technical sell signals. It is vitally important to your success with the fact-based investment system to reduce exposure and preserve cash during market downdrafts."
As always, watch upcoming CANSLIM.net reports for new action-worthy leaders best matching the winning models to be covered as they emerge and then included on the Featured Stocks Page - with our Certified experts' latest notes and links to additional resources including detailed analysis with annotated graphs. The Premium Member Homepage - includes "dynamic archives" to all prior pay reports published. Watch for an announcement via email concerning the next WEBCAST.
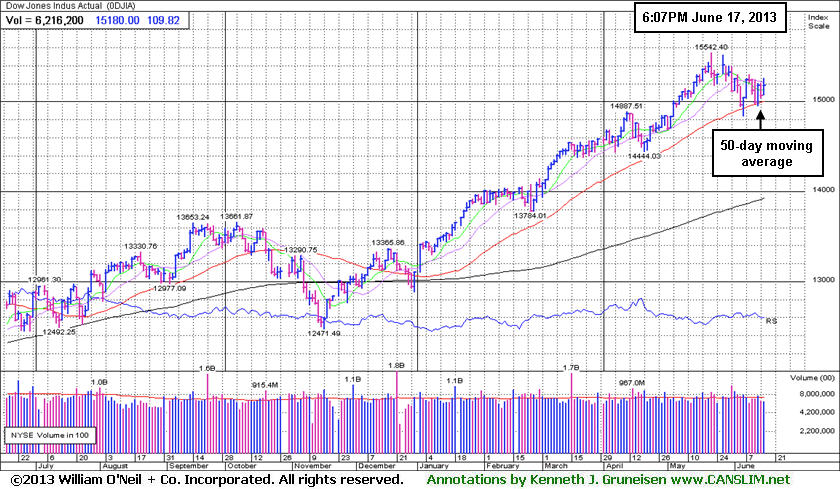
PICTURED: The Dow Jones Industrial Average is consolidating above its 50-day moving average (DMA) line and above recent lows defining near-term support. Time alone will tell if the correction continues with damage escalating, or if a new rally can produce meaningful confirmation and conviction behind additional gains. The window is now open for a follow-through day (FTD) of gains from the major averages within the most ideal period 4-7 days after the major averages halted their latest slide.
|
 Kenneth J. Gruneisen started out as a licensed stockbroker in August 1987, a couple of months prior to the historic stock market crash that took the Dow Jones Industrial Average down -22.6% in a single day. He has published daily fact-based fundamental and technical analysis on high-ranked stocks online for two decades. Through FACTBASEDINVESTING.COM, Kenneth provides educational articles, news, market commentary, and other information regarding proven investment systems that work in good times and bad.
Comments contained in the body of this report are technical opinions only and are not necessarily those of Gruneisen Growth Corp. The material herein has been obtained from sources believed to be reliable and accurate, however, its accuracy and completeness cannot be guaranteed. Our firm, employees, and customers may effect transactions, including transactions contrary to any recommendation herein, or have positions in the securities mentioned herein or options with respect thereto. Any recommendation contained in this report may not be suitable for all investors and it is not to be deemed an offer or solicitation on our part with respect to the purchase or sale of any securities. |
|
 |
Financial, Retail, Energy, and Tech Groups Rose
Kenneth J. Gruneisen - Passed the CAN SLIM® Master's Exam
Strength in financial shares underpinned the major averages' rally on Monday as the Broker/Dealer Index ($XBD +2.00%) outpaced the Bank Index ($BKX +0.76%). The Retail Index ($RLX +0.62%) posted a modest gain and also was a positive influence on the major averages. Gains in energy-related shares boosted the Oil Services Index ($OSX +1.76%) and the Integrated Oil Index ($XOI +1.06%). The Semiconductor Index ($SOX +1.46%) and Internet Index ($IIX +1.00%) led the tech sector higher while the Networking Index ($NWX +0.37%) posted a smaller gain, but the Biotechnology Index ($BTK -0.11%) ended the session slightly in the red. Meanwhile, the Healthcare Index ($HMO +1.08%) led defensive groups higher while the Gold & Silver Index ($XAU +0.44%) posted a smaller gain.
Charts courtesy www.stockcharts.com
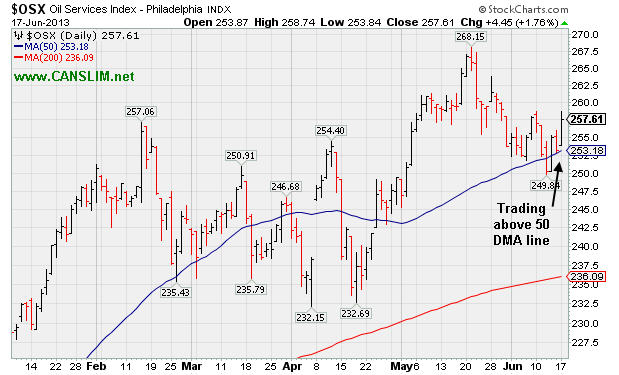
PICTURED: The Oil Services Index ($OSX +1.76%) is trading above its 50-day moving average (DMA) line while consolidating from May highs.
| Oil Services |
$OSX |
257.61 |
+4.45 |
+1.76% |
+17.01% |
| Healthcare |
$HMO |
3,124.53 |
+33.31 |
+1.08% |
+24.28% |
| Integrated Oil |
$XOI |
1,376.01 |
+14.37 |
+1.06% |
+10.80% |
| Semiconductor |
$SOX |
472.34 |
+6.81 |
+1.46% |
+22.99% |
| Networking |
$NWX |
263.97 |
+0.97 |
+0.37% |
+16.52% |
| Internet |
$IIX |
382.10 |
+3.77 |
+1.00% |
+16.85% |
| Broker/Dealer |
$XBD |
126.44 |
+2.48 |
+2.00% |
+34.04% |
| Retail |
$RLX |
792.07 |
+4.90 |
+0.62% |
+21.29% |
| Gold & Silver |
$XAU |
103.01 |
+0.45 |
+0.44% |
-37.80% |
| Bank |
$BKX |
60.62 |
+0.46 |
+0.76% |
+18.21% |
| Biotech |
$BTK |
1,904.51 |
-2.17 |
-0.11% |
+23.11% |
|
|
|
 |
Faltering Fundamental and Technical Characteristics Raise Concerns
Kenneth J. Gruneisen - Passed the CAN SLIM® Master's Exam
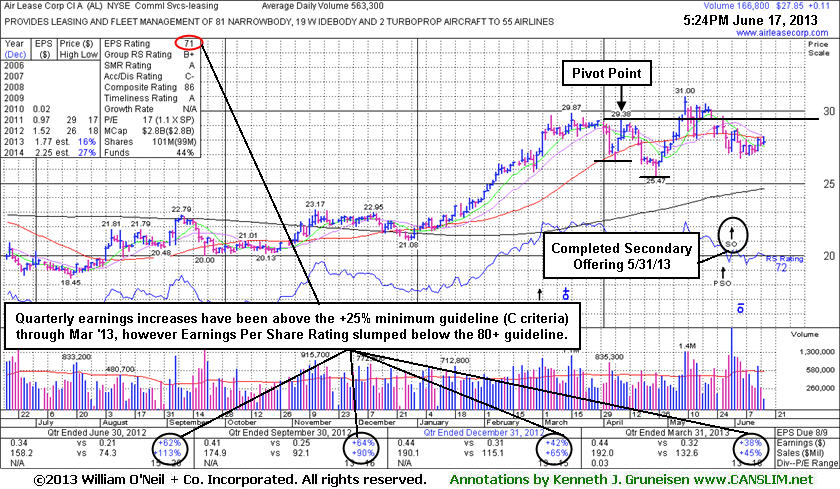
Air Lease Corp (AL +$0.11 or +0.40% to $27.85) is still consolidating below its 50-day moving average (DMA) line which may continue to act as resistance. Gains above that short-term average are needed for it to improve its technical stance and help its near-term outlook. It completed a Secondary Offering on 5/31/13. The company reported earnings +38% on +45% sales revenues for the quarter ended March 31, 2013 versus the year ago period. The result was below analysts' estimates yet well above the +25% minimum earnings guideline (C criteria). However, its earnings Per Share Rank has subsequently fallen from 84 to 71, below the 80+ minimum for buy candidates (see red circle). Its Relative Strength Rating has also slumped below the 80+ minimum guideline to 72. Decelerating sales revenues and earnings increases in sequential quarterly comparisons through Dec '12 were noted as cause for some concern, and the Mar '13 comparison continued that worrisome trend.
It is still a fairly good match with the fact-based investment system's fundamental guidelines (C and A criteria), however it would be more ideal for a company to show sales and earnings acceleration. Couple the fundamental concerns with its technical weakness and it gets harder to argue for giving the Commercial Services - Leasing firm much latitude. Disciplined investors always limit losses if any stock falls -7% from their purchase price.
The number of top-rated funds owning its shares edged higher from 177 in Sep '12 to 187 in Mar '13 which is slightly reassuring concerning the I criteria. AL was last shown in this FSU section on 5/30/13 with an annotated graph under the headline, "Weak Technical Action Triggered Sell Signal", after it violated important support at its 50-day moving average (DMA) line with volume-driven losses which raised concerns and triggered a technical sell signal.
|
|
|
Color Codes Explained :
Y - Better candidates highlighted by our
staff of experts.
G - Previously featured
in past reports as yellow but may no longer be buyable under the
guidelines.
***Last / Change / Volume data in this table is the closing quote data***
Symbol/Exchange
Company Name
Industry Group |
PRICE |
CHANGE
(%Change) |
Day High |
Volume
(% DAV)
(% 50 day avg vol) |
52 Wk Hi
% From Hi |
Featured
Date |
Price
Featured |
Pivot Featured |
|
Max Buy |
AL
-
NYSE
Air Lease Corp Cl A
DIVERSIFIED SERVICES - Rental and Leasing Services
|
$27.85
|
+0.11
0.40% |
$28.24
|
166,885
29.63% of 50 DAV
50 DAV is 563,300
|
$31.00
-10.16%
|
5/9/2013
|
$30.95
|
PP = $29.38
|
|
MB = $30.85
|
 Most Recent Note - 6/17/2013 1:14:30 PM
G - Still consolidating just below its 50 DMA line which may act as resistance. Completed a Secondary Offering on 5/31/13.
>>> The latest Featured Stock Update with an annotated graph appeared on 6/17/2013. Click here.
View all notes |
Alert me of new notes |
CANSLIM.net Company Profile |
SEC |
Zacks Reports |
StockTalk |
News |
Chart |
Request a new note
C
A N
S L
I M


|
AMBA
-
NASDAQ
Ambarella Inc
ELECTRONICS - Semiconductor - Specialized
|
$18.14
|
+0.67
3.84% |
$18.20
|
1,710,532
173.31% of 50 DAV
50 DAV is 987,000
|
$18.21
-0.38%
|
5/6/2013
|
$15.31
|
PP = $16.10
|
|
MB = $16.91
|
Most Recent Note - 6/17/2013 12:18:29 PM
G - Wedging higher without especially heavy volume behind today's 3rd consecutive gain. Tallied 8 consecutive weekly gains. Recent lows and its 50 DMA line ($14.87 now) define important chart support to watch on pullbacks. See the latest FSU analysis for more details and a new annotated graph.
>>> The latest Featured Stock Update with an annotated graph appeared on 6/14/2013. Click here.
View all notes |
Alert me of new notes |
CANSLIM.net Company Profile |
SEC |
Zacks Reports |
StockTalk |
News |
Chart |
Request a new note
C
A N
S L
I M
|
EQM
-
NYSE
E Q T Midstream Partners
ENERGY - Oil and Gas Pipelines
|
$50.62
|
+1.30
2.64% |
$51.58
|
293,825
256.17% of 50 DAV
50 DAV is 114,700
|
$51.72
-2.13%
|
4/25/2013
|
$40.16
|
PP = $40.84
|
|
MB = $42.88
|
Most Recent Note - 6/17/2013 12:24:34 PM
G - Gapped up for a 2nd consecutive considerable gain with volume running at an above average pace while challenging its 52-week high. Recent low and its 50 DMA line define important near-term support in the $45 area.
>>> The latest Featured Stock Update with an annotated graph appeared on 6/6/2013. Click here.
View all notes |
Alert me of new notes |
CANSLIM.net Company Profile |
SEC |
Zacks Reports |
StockTalk |
News |
Chart |
Request a new note
C
A N
S L
I M
|
FLT
-
NYSE
Fleetcor Technologies
DIVERSIFIED SERVICES - Business/Management Services
|
$88.07
|
+0.42
0.48% |
$89.75
|
903,434
105.88% of 50 DAV
50 DAV is 853,300
|
$88.83
-0.85%
|
5/29/2013
|
$86.02
|
PP = $85.66
|
|
MB = $89.94
|
Most Recent Note - 6/11/2013 3:50:28 PM
Y- Hovering near its all-time high with volume totals recently cooling. Rose from an advanced "3-weeks tight" base with its 5/29/13 gain on +56% above average volume. It may go on to produce more climactic gains, however this was a riskier "late-stage" base.
>>> The latest Featured Stock Update with an annotated graph appeared on 5/31/2013. Click here.
View all notes |
Alert me of new notes |
CANSLIM.net Company Profile |
SEC |
Zacks Reports |
StockTalk |
News |
Chart |
Request a new note
C
A N
S L
I M
|
LOPE
-
NASDAQ
Grand Canyon Education
DIVERSIFIED SERVICES - Education and; Training Services
|
$31.68
|
-0.03
-0.09% |
$32.00
|
415,444
107.91% of 50 DAV
50 DAV is 385,000
|
$34.07
-7.01%
|
5/10/2013
|
$29.03
|
PP = $27.28
|
|
MB = $28.64
|
Most Recent Note - 6/14/2013 6:24:44 PM
G - Volume totals have still been cooling while holding its ground stubbornly, extended from its previous base. Its 50 DMA line defines initial support above prior highs in the $27 area.
>>> The latest Featured Stock Update with an annotated graph appeared on 6/3/2013. Click here.
View all notes |
Alert me of new notes |
CANSLIM.net Company Profile |
SEC |
Zacks Reports |
StockTalk |
News |
Chart |
Request a new note
C
A N
S L
I M
|
Symbol/Exchange
Company Name
Industry Group |
PRICE |
CHANGE
(%Change) |
Day High |
Volume
(% DAV)
(% 50 day avg vol) |
52 Wk Hi
% From Hi |
Featured
Date |
Price
Featured |
Pivot Featured |
|
Max Buy |
MRLN
-
NASDAQ
Marlin Business Services
DIVERSIFIED SERVICES - Rental and Leasing Services
|
$23.08
|
-0.95
-3.95% |
$24.35
|
55,180
230.88% of 50 DAV
50 DAV is 23,900
|
$25.97
-11.13%
|
3/15/2013
|
$22.29
|
PP = $23.18
|
|
MB = $24.34
|
Most Recent Note - 6/17/2013 1:08:17 PM
G - Slumping below its 50 DMA line today, weak amid a mostly positive market, and its color code is changed to green. Churned above average volume without making meaningful price progress in the past 2 weeks. Up/Down Volume Ratio is currently 0.7 which is an unbiased indication it has been encountering distributional pressure over the past 50 days. The recent low ($21.49 on 5/23/13) defines important near-term chart support where a violation would raise more serious concerns.
>>> The latest Featured Stock Update with an annotated graph appeared on 6/11/2013. Click here.
View all notes |
Alert me of new notes |
CANSLIM.net Company Profile |
SEC |
Zacks Reports |
StockTalk |
News |
Chart |
Request a new note
C
A N
S L
I M
|
NSM
-
NYSE
Nationstar Mtg Hldgs Inc
FINANCIAL SERVICES - Credit Services
|
$42.20
|
-0.26
-0.61% |
$43.00
|
718,104
61.39% of 50 DAV
50 DAV is 1,169,700
|
$46.91
-10.04%
|
5/7/2013
|
$39.71
|
PP = $42.34
|
|
MB = $44.46
|
Most Recent Note - 6/13/2013 5:18:49 PM
Y - Volume totals have been cooling in recent weeks while consolidating near prior highs and above its 50 DMA line. Disciplined investors always limit losses if any stock falls more than -7% from their purchase price. See the latest FSU analysis for more details and a new annotated graph.
>>> The latest Featured Stock Update with an annotated graph appeared on 6/13/2013. Click here.
View all notes |
Alert me of new notes |
CANSLIM.net Company Profile |
SEC |
Zacks Reports |
StockTalk |
News |
Chart |
Request a new note
C
A N
S L
I M
|
PRAA
-
NASDAQ
Portfolio Recovery Assoc
DIVERSIFIED SERVICES - Business/Management Services
|
$161.60
|
+6.54
4.22% |
$163.87
|
160,446
224.09% of 50 DAV
50 DAV is 71,600
|
$155.59
3.86%
|
5/1/2013
|
$130.77
|
PP = $127.88
|
|
MB = $134.27
|
Most Recent Note - 6/17/2013 12:53:47 PM
G - Hitting a new all-time high with above average volume behind today's 4th consecutive gain, rallying with no resistance due to overhead supply. Its 50 DMA line defines important chart support.
>>> The latest Featured Stock Update with an annotated graph appeared on 6/10/2013. Click here.
View all notes |
Alert me of new notes |
CANSLIM.net Company Profile |
SEC |
Zacks Reports |
StockTalk |
News |
Chart |
Request a new note
C
A N
S L
I M
|
PRLB
-
NYSE
Proto Labs Inc
MANUFACTURING - Small Tools and Accessories
|
$59.46
|
+2.31
4.04% |
$59.74
|
605,280
116.83% of 50 DAV
50 DAV is 518,100
|
$59.84
-0.64%
|
6/17/2013
|
$59.37
|
PP = $59.94
|
|
MB = $62.94
|
Most Recent Note - 6/17/2013 1:12:55 PM
Y- Gapped up today challenging its 52-week high. A new pivot point is cited based on its 5/10/13 high plus 10 cents. Subsequent volume-driven gains above the pivot point may trigger a new (or add-on) technical buy signal.
>>> The latest Featured Stock Update with an annotated graph appeared on 6/12/2013. Click here.
View all notes |
Alert me of new notes |
CANSLIM.net Company Profile |
SEC |
Zacks Reports |
StockTalk |
News |
Chart |
Request a new note
C
A N
S L
I M
|
RRTS
-
NYSE
Roadrunner Trans Systems
TRANSPORTATION - Air Delivery and Freight Service
|
$28.24
|
-0.78
-2.69% |
$29.52
|
303,323
141.01% of 50 DAV
50 DAV is 215,100
|
$29.04
-2.75%
|
4/3/2013
|
$22.77
|
PP = $23.75
|
|
MB = $24.94
|
Most Recent Note - 6/11/2013 12:51:41 PM
G - Up from earlier lows after a gap down today following an analyst downgrade, retreating from a new all-time high hit on the prior session. Fundamental concerns were raised by its sub par earnings increase in the Mar '13 quarter, below the +25% minimum guideline (C criteria).
>>> The latest Featured Stock Update with an annotated graph appeared on 6/4/2013. Click here.
View all notes |
Alert me of new notes |
CANSLIM.net Company Profile |
SEC |
Zacks Reports |
StockTalk |
News |
Chart |
Request a new note
C
A N
S L
I M
|
Symbol/Exchange
Company Name
Industry Group |
PRICE |
CHANGE
(%Change) |
Day High |
Volume
(% DAV)
(% 50 day avg vol) |
52 Wk Hi
% From Hi |
Featured
Date |
Price
Featured |
Pivot Featured |
|
Max Buy |
VRX
-
NYSE
Valeant Pharmaceuticals
DRUGS - Drug Manufacturers - Other
|
$84.82
|
+0.62
0.74% |
$85.39
|
909,255
53.86% of 50 DAV
50 DAV is 1,688,100
|
$96.25
-11.88%
|
4/30/2013
|
$60.24
|
PP = $76.66
|
|
MB = $80.49
|
Most Recent Note - 6/14/2013 6:27:45 PM
G- Concerns were raised by its sub par Mar '13 earnings report, however mostly bullish action has followed.Volume totals have been cooling while consolidating above prior highs. Support to watch is at prior highs coinciding with its 50 DMA near $76.
>>> The latest Featured Stock Update with an annotated graph appeared on 6/7/2013. Click here.
View all notes |
Alert me of new notes |
CANSLIM.net Company Profile |
SEC |
Zacks Reports |
StockTalk |
News |
Chart |
Request a new note
C
A N
S L
I M
|
|
|
|
THESE ARE NOT BUY RECOMMENDATIONS!
Comments contained in the body of this report are technical
opinions only. The material herein has been obtained
from sources believed to be reliable and accurate, however,
its accuracy and completeness cannot be guaranteed.
This site is not an investment advisor, hence it does
not endorse or recommend any securities or other investments.
Any recommendation contained in this report may not
be suitable for all investors and it is not to be deemed
an offer or solicitation on our part with respect to
the purchase or sale of any securities. All trademarks,
service marks and trade names appearing in this report
are the property of their respective owners, and are
likewise used for identification purposes only.
This report is a service available
only to active Paid Premium Members.
You may opt-out of receiving report notifications
at any time. Questions or comments may be submitted
by writing to Premium Membership Services 665 S.E. 10 Street, Suite 201 Deerfield Beach, FL 33441-5634 or by calling 1-800-965-8307
or 954-785-1121.
|
|
|

