You are not logged in.
This means you
CAN ONLY VIEW reports that were published prior to Thursday, April 10, 2025.
You
MUST UPGRADE YOUR MEMBERSHIP if you want to see any current reports.
AFTER MARKET UPDATE - FRIDAY, JUNE 14TH, 2013
Previous After Market Report Next After Market Report >>>
|
|
|
|
DOW |
-105.90 |
15,070.18 |
-0.70% |
|
Volume |
633,859,870 |
-16% |
|
Volume |
1,406,585,710 |
-8% |
|
NASDAQ |
-21.81 |
3,423.56 |
-0.63% |
|
Advancers |
1,399 |
45% |
|
Advancers |
704 |
27% |
|
S&P 500 |
-9.63 |
1,626.73 |
-0.59% |
|
Decliners |
1,642 |
52% |
|
Decliners |
1,790 |
69% |
|
Russell 2000 |
-8.31 |
981.38 |
-0.84% |
|
52 Wk Highs |
84 |
|
|
52 Wk Highs |
77 |
|
|
S&P 600 |
-5.10 |
550.98 |
-0.92% |
|
52 Wk Lows |
27 |
|
|
52 Wk Lows |
26 |
|
|
 |
Indices End in Negative Territory for the Week
Kenneth J. Gruneisen - Passed the CAN SLIM® Master's Exam
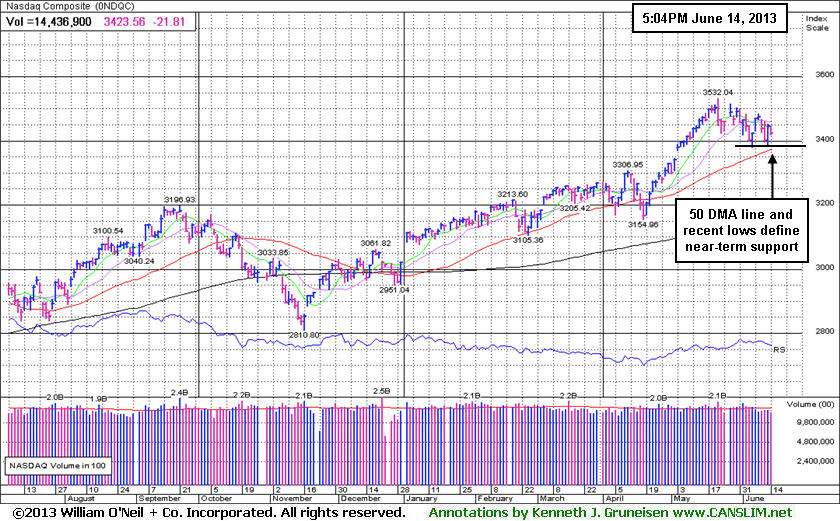
Friday's losses pushed the major averages further into negative territory for the week. The Dow Jones Industrial Average finished with a weekly loss of -1.2%, the S&P 500 Index declined -1% and the Nasdaq Composite Index fell -1.3%. Friday's trading session volume totals were reported lighter than the prior session total on the NYSE and on the Nasdaq exchange, which was a slightly reassuring sign that institutional investors were not increasing their selling efforts. Breadth was negative as decliners led advancers by more than 2-1 on the Nasdaq exchange and by an 8-7 margin on the NYSE. There were 33 high-ranked companies from the CANSLIM.net Leaders List making new 52-week highs and appearing on the CANSLIM.net BreakOuts Page, up little from the prior session total of 31 stocks. The number of stocks hitting new 52-week highs outnumbered new 52-week lows on the NYSE and on the Nasdaq exchange. There were gains for 6 of the 11 high-ranked companies currently included on the Featured Stocks Page.
A batch of mixed economic data weighed on the major averages. The International Monetary Fund lowered its 2014 U.S. growth forecast and urged the Fed to carefully manage its stimulus exit strategy to avoid market disruption. Investors also digested mixed economic data. Industrial production was surprisingly unchanged in May and the University of Michigan consumer confidence survey unexpectedly fell from a six-year high this month. A separate report showed the producer-price index advanced in May for the first time in three months.
Nine of the 10 sectors on the S&P were lower, led by declines in financial stocks including JP Morgan Chase & Co (JPM -1.92%) and Citigroup Inc (C -2.13%). Also in the space, American Express Co (AXP -2.98%) fell after the shares received an analyst downgrade. Materials and Energy stocks were also under pressure with DuPont down (DD -2.23%) and Occidental Petroleum Corp (OXY -1.24%). The more defensive Utilities group held onto minor gains, led by NextEra Energy Inc (NEE +0.9%) advance to $79.81. On the earnings front, Restoration Hardware Holdings Inc (RH +16.13%) rallied after the company posted a better-than-expected quarterly profit tally. In other news, Smith & Wesson Holding Co (SWHC +5.16%) rallied as the company announced preliminary net sales and earnings per share that were ahead of estimates.
In fixed-income, Treasuries were up for a second day. The 10-year note gained 5/32 to yield 2.13% and the 30-year bond rose 6/32 to yield 3.31%.
The damage worsened on Wednesday after market (M criteria) weakness was labeled a "correction" Tuesday evening by writers at the newspaper. There is no denying that the weak and damaging action in the broader market serves as a clear reminder for investors - be protective of any gains, and limit losses! Be especially watchful for any individual issues flashing technical sell signals. It is vitally important to your success with the fact-based investment system to reduce exposure and preserve cash during market downdrafts.
As always, watch upcoming CANSLIM.net reports for new action-worthy leaders best matching the winning models to be covered as they emerge and then included on the Featured Stocks Page - with our Certified experts' latest notes and links to additional resources including detailed analysis with annotated graphs. The Premium Member Homepage - includes "dynamic archives" to all prior pay reports published. Watch for an announcement via email concerning the next WEBCAST.
PICTURED: The Nasdaq Composite Index is consolidating above its 50-day moving average (DMA) line and recent lows defining near-term support. Any more damaging losses would raise serious concerns, however, the market being noted above as in a "correction" already has alerted members in recent days to play smart defense, rather than making a priority of any new buying efforts.
|
 Kenneth J. Gruneisen started out as a licensed stockbroker in August 1987, a couple of months prior to the historic stock market crash that took the Dow Jones Industrial Average down -22.6% in a single day. He has published daily fact-based fundamental and technical analysis on high-ranked stocks online for two decades. Through FACTBASEDINVESTING.COM, Kenneth provides educational articles, news, market commentary, and other information regarding proven investment systems that work in good times and bad.
Comments contained in the body of this report are technical opinions only and are not necessarily those of Gruneisen Growth Corp. The material herein has been obtained from sources believed to be reliable and accurate, however, its accuracy and completeness cannot be guaranteed. Our firm, employees, and customers may effect transactions, including transactions contrary to any recommendation herein, or have positions in the securities mentioned herein or options with respect thereto. Any recommendation contained in this report may not be suitable for all investors and it is not to be deemed an offer or solicitation on our part with respect to the purchase or sale of any securities. |
|
 |
Financial, Defensive, Tech, and Energy-Related Groups Fell
Kenneth J. Gruneisen - Passed the CAN SLIM® Master's Exam
Weakness in financial shares was a negative influence on the major averages as the Broker/Dealer Index ($XBD -1.75%) and the Bank Index ($BKX -1.60%) fell on Friday. The Retail Index ($RLX -0.28%) showed resilience as it suffered a smaller loss. Defensive groups faced pressure as the Gold & Silver Index ($XAU -1.62%) and the Healthcare Index ($HMO -0.96%) both lost ground. The Biotechnology Index ($BTK -1.64%) and Networking Index ($NWX -0.84%) led the tech sector lower while the Internet Index ($IIX -0.67%) and the Semiconductor Index ($SOX -0.40%) finished the session with smaller losses. Weakness in energy-related shares also dragged the Integrated Oil Index ($XOI -1.10%) and the Oil Services Index ($OSX -0.73%) lower on Friday's mostly negative session.
Charts courtesy www.stockcharts.com
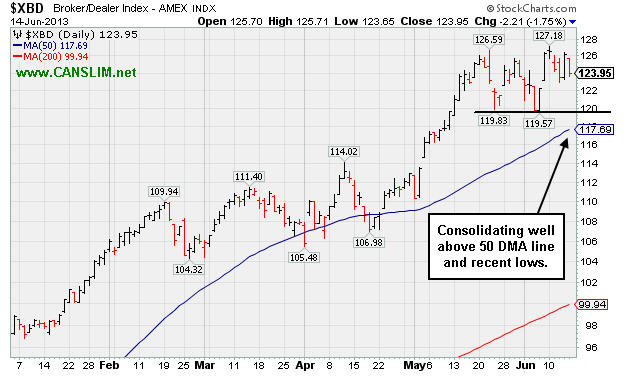
PICTURED: The Broker/Dealer Index ($XBD -1.75%) is consolidating above its 50-day moving average (DMA) line and recent lows.
| Oil Services |
$OSX |
253.16 |
-1.85 |
-0.73% |
+14.99% |
| Healthcare |
$HMO |
3,091.22 |
-30.08 |
-0.96% |
+22.95% |
| Integrated Oil |
$XOI |
1,361.63 |
-15.11 |
-1.10% |
+9.65% |
| Semiconductor |
$SOX |
465.53 |
-1.85 |
-0.40% |
+21.21% |
| Networking |
$NWX |
262.99 |
-2.22 |
-0.84% |
+16.09% |
| Internet |
$IIX |
378.33 |
-2.54 |
-0.67% |
+15.70% |
| Broker/Dealer |
$XBD |
123.95 |
-2.21 |
-1.75% |
+31.40% |
| Retail |
$RLX |
787.17 |
-2.24 |
-0.28% |
+20.54% |
| Gold & Silver |
$XAU |
102.56 |
-1.69 |
-1.62% |
-38.07% |
| Bank |
$BKX |
60.16 |
-0.98 |
-1.60% |
+17.32% |
| Biotech |
$BTK |
1,906.68 |
-31.75 |
-1.64% |
+23.25% |
|
|
|
 |
Eight Consecutive Weekly Gains for Strong Leader
Kenneth J. Gruneisen - Passed the CAN SLIM® Master's Exam
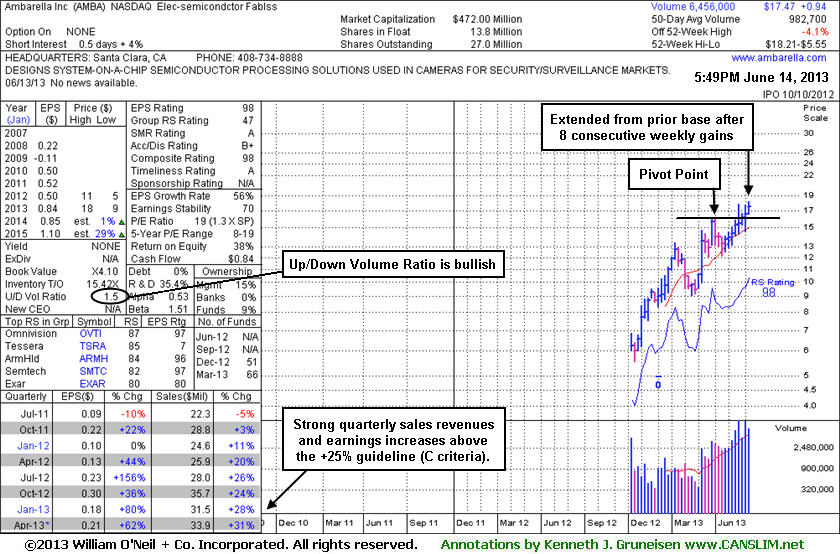
Ambarella Corporation (AMBA +$0.43 or +2.52% to $17.47) has tallied 8 consecutive weekly gains and it is extended from its prior base. It recently reported strong earnings and revenues increases for the April '13 quarter, continuing its streak of strong quarterly earnings comparisons versus the year ago periods - satisfying the C criteria with increases above the +25% minimum guideline. Recent lows and its 50-day moving average (DMA) line ($14.69 now) define important chart support to watch on pullbacks.
AMBA's last appearance in this FSU section was on 5/29/13 with an annotated graph under the headline, "Found Support Above 50-Day Moving Average After Whipsaw Action Negated Recent Breakout". Members were reminded - "A stock sold based on triggering the fact-based investment system's strict sell rules can be bought back at a later time if impressive strength returns. In fact, in the Certification it is taught that experts should buy a slightly larger dollar amount (+10% more) in the same stock if it later flashes especially bullish action. This tactic reinforces their commitment and confidence in the fact-based investment system. As always, there is a chance the stock might turn negative again, in which case the -7% sell rule may apply yet again. However, it is crucial to investors' long-term success to do a good job of limiting losses while they are small. The best approach is to never hang on for a weak stock to possibly become a -20%, -30%, -40%, or more devastating loss. In a bullish market environment, patient and disciplined investors investors can find their fair share of great winners by following the rules."
It stayed above its 50 DMA line and was noted on 6/4/2013 as it tallied a solid gain with above average volume against a mostly negative market backdrop. Then it gapped up on 6/05/13 after reporting strong earnings and revenues increases for the April '13 quarter versus the year ago period. The high-ranked Electronics - Semiconductor firm saw the number of top-rated funds owning its shares rise from 51 in Dec '12 to 66 in Mar '13, a reassuring indication concerning the I criteria. Its current Up/Down Volume Ratio of 1.5 is also an unbiased indication that its shares have been under accumulation over the past 50 days. Its small supply (S criteria) of only 13.8 million shares in the public float can contribute to great price volatility in the event of institutional buying or selling.
 |
|
|
Color Codes Explained :
Y - Better candidates highlighted by our
staff of experts.
G - Previously featured
in past reports as yellow but may no longer be buyable under the
guidelines.
***Last / Change / Volume data in this table is the closing quote data***
Symbol/Exchange
Company Name
Industry Group |
PRICE |
CHANGE
(%Change) |
Day High |
Volume
(% DAV)
(% 50 day avg vol) |
52 Wk Hi
% From Hi |
Featured
Date |
Price
Featured |
Pivot Featured |
|
Max Buy |
AL
-
NYSE
Air Lease Corp Cl A
DIVERSIFIED SERVICES - Rental and Leasing Services
|
$27.74
|
-0.27
-0.96% |
$28.08
|
267,752
47.03% of 50 DAV
50 DAV is 569,300
|
$31.00
-10.52%
|
5/9/2013
|
$30.95
|
PP = $29.38
|
|
MB = $30.85
|
Most Recent Note - 6/10/2013 5:45:32 PM
G - Posted a gain today with below average volume and it remains below its 50 DMA line which may now act as resistance. Completed a Secondary Offering on 5/31/13.
>>> The latest Featured Stock Update with an annotated graph appeared on 5/30/2013. Click here.
View all notes |
Alert me of new notes |
CANSLIM.net Company Profile |
SEC |
Zacks Reports |
StockTalk |
News |
Chart |
Request a new note
C
A N
S L
I M


|
AMBA
-
NASDAQ
Ambarella Inc
ELECTRONICS - Semiconductor - Specialized
|
$17.47
|
+0.43
2.52% |
$17.75
|
819,297
83.37% of 50 DAV
50 DAV is 982,700
|
$18.21
-4.06%
|
5/6/2013
|
$15.31
|
PP = $16.10
|
|
MB = $16.91
|
 Most Recent Note - 6/14/2013 6:21:52 PM
G - Tallied its 8th consecutive weekly gain. Recent lows and its 50 DMA line ($14.87 now) define important chart support to watch on pullbacks. See the latest FSU analysis for more details and a new annotated graph.
>>> The latest Featured Stock Update with an annotated graph appeared on 6/14/2013. Click here.
View all notes |
Alert me of new notes |
CANSLIM.net Company Profile |
SEC |
Zacks Reports |
StockTalk |
News |
Chart |
Request a new note
C
A N
S L
I M
|
EQM
-
NYSE
E Q T Midstream Partners
ENERGY - Oil and Gas Pipelines
|
$49.32
|
+2.68
5.75% |
$49.70
|
360,561
334.47% of 50 DAV
50 DAV is 107,800
|
$51.72
-4.64%
|
4/25/2013
|
$40.16
|
PP = $40.84
|
|
MB = $42.88
|
Most Recent Note - 6/14/2013 12:11:33 PM
G - Gapped up today for a considerable gain with volume running at an above average pace. Found support above its 50 DMA line during its recent consolidation. Recent low and its 50 DMA line define important near-term support.
>>> The latest Featured Stock Update with an annotated graph appeared on 6/6/2013. Click here.
View all notes |
Alert me of new notes |
CANSLIM.net Company Profile |
SEC |
Zacks Reports |
StockTalk |
News |
Chart |
Request a new note
C
A N
S L
I M
|
FLT
-
NYSE
Fleetcor Technologies
DIVERSIFIED SERVICES - Business/Management Services
|
$87.65
|
-0.14
-0.16% |
$88.46
|
351,971
40.45% of 50 DAV
50 DAV is 870,100
|
$88.83
-1.33%
|
5/29/2013
|
$86.02
|
PP = $85.66
|
|
MB = $89.94
|
Most Recent Note - 6/11/2013 3:50:28 PM
Y- Hovering near its all-time high with volume totals recently cooling. Rose from an advanced "3-weeks tight" base with its 5/29/13 gain on +56% above average volume. It may go on to produce more climactic gains, however this was a riskier "late-stage" base.
>>> The latest Featured Stock Update with an annotated graph appeared on 5/31/2013. Click here.
View all notes |
Alert me of new notes |
CANSLIM.net Company Profile |
SEC |
Zacks Reports |
StockTalk |
News |
Chart |
Request a new note
C
A N
S L
I M
|
LOPE
-
NASDAQ
Grand Canyon Education
DIVERSIFIED SERVICES - Education and; Training Services
|
$31.71
|
-0.29
-0.91% |
$32.30
|
175,889
45.37% of 50 DAV
50 DAV is 387,700
|
$34.07
-6.93%
|
5/10/2013
|
$29.03
|
PP = $27.28
|
|
MB = $28.64
|
Most Recent Note - 6/14/2013 6:24:44 PM
G - Volume totals have still been cooling while holding its ground stubbornly, extended from its previous base. Its 50 DMA line defines initial support above prior highs in the $27 area.
>>> The latest Featured Stock Update with an annotated graph appeared on 6/3/2013. Click here.
View all notes |
Alert me of new notes |
CANSLIM.net Company Profile |
SEC |
Zacks Reports |
StockTalk |
News |
Chart |
Request a new note
C
A N
S L
I M
|
Symbol/Exchange
Company Name
Industry Group |
PRICE |
CHANGE
(%Change) |
Day High |
Volume
(% DAV)
(% 50 day avg vol) |
52 Wk Hi
% From Hi |
Featured
Date |
Price
Featured |
Pivot Featured |
|
Max Buy |
MRLN
-
NASDAQ
Marlin Business Services
DIVERSIFIED SERVICES - Rental and Leasing Services
|
$24.03
|
-0.19
-0.78% |
$24.32
|
51,092
220.22% of 50 DAV
50 DAV is 23,200
|
$25.97
-7.47%
|
3/15/2013
|
$22.29
|
PP = $23.18
|
|
MB = $24.34
|
Most Recent Note - 6/14/2013 6:33:03 PM
Y - Churned above average volume near its 50 DMA line without making meaningful price progress this past 2 weeks. Up/Down Volume Ratio is currently 0.7 which is an unbiased indication it has been encountering distributional pressure over the past 50 days. The recent low ($21.49 on 5/23/13) defines important near-term chart support where a violation would raise more serious concerns.
>>> The latest Featured Stock Update with an annotated graph appeared on 6/11/2013. Click here.
View all notes |
Alert me of new notes |
CANSLIM.net Company Profile |
SEC |
Zacks Reports |
StockTalk |
News |
Chart |
Request a new note
C
A N
S L
I M
|
NSM
-
NYSE
Nationstar Mtg Hldgs Inc
FINANCIAL SERVICES - Credit Services
|
$42.46
|
+0.49
1.17% |
$43.18
|
1,009,844
87.03% of 50 DAV
50 DAV is 1,160,300
|
$46.91
-9.49%
|
5/7/2013
|
$39.71
|
PP = $42.34
|
|
MB = $44.46
|
Most Recent Note - 6/13/2013 5:18:49 PM
Y - Volume totals have been cooling in recent weeks while consolidating near prior highs and above its 50 DMA line. Disciplined investors always limit losses if any stock falls more than -7% from their purchase price. See the latest FSU analysis for more details and a new annotated graph.
>>> The latest Featured Stock Update with an annotated graph appeared on 6/13/2013. Click here.
View all notes |
Alert me of new notes |
CANSLIM.net Company Profile |
SEC |
Zacks Reports |
StockTalk |
News |
Chart |
Request a new note
C
A N
S L
I M
|
PRAA
-
NASDAQ
Portfolio Recovery Assoc
DIVERSIFIED SERVICES - Business/Management Services
|
$155.06
|
+1.03
0.67% |
$155.59
|
64,213
89.43% of 50 DAV
50 DAV is 71,800
|
$154.81
0.16%
|
5/1/2013
|
$130.77
|
PP = $127.88
|
|
MB = $134.27
|
Most Recent Note - 6/10/2013 5:36:19 PM
G - Endured mild distributional pressure last week yet it remains perched near its high holding its ground with no resistance due to overhead supply. Its 50 DMA line defines important chart support. See the latest FSU analysis for more details and a new annotated graph.
>>> The latest Featured Stock Update with an annotated graph appeared on 6/10/2013. Click here.
View all notes |
Alert me of new notes |
CANSLIM.net Company Profile |
SEC |
Zacks Reports |
StockTalk |
News |
Chart |
Request a new note
C
A N
S L
I M
|
PRLB
-
NYSE
Proto Labs Inc
MANUFACTURING - Small Tools and Accessories
|
$57.15
|
+1.78
3.21% |
$57.58
|
228,818
44.21% of 50 DAV
50 DAV is 517,600
|
$59.84
-4.50%
|
5/3/2013
|
$54.77
|
PP = $54.01
|
|
MB = $56.71
|
Most Recent Note - 6/12/2013 6:03:36 PM
Y - Pulled back on light volume today, consolidating above important support at its 50 DMA line. A subsequent violation may trigger a technical sell signal. See the latest FSU analysis for more details and a new annotated graph.
>>> The latest Featured Stock Update with an annotated graph appeared on 6/12/2013. Click here.
View all notes |
Alert me of new notes |
CANSLIM.net Company Profile |
SEC |
Zacks Reports |
StockTalk |
News |
Chart |
Request a new note
C
A N
S L
I M
|
RRTS
-
NYSE
Roadrunner Trans Systems
TRANSPORTATION - Air Delivery and Freight Service
|
$29.02
|
+0.81
2.87% |
$29.04
|
172,662
80.01% of 50 DAV
50 DAV is 215,800
|
$28.62
1.40%
|
4/3/2013
|
$22.77
|
PP = $23.75
|
|
MB = $24.94
|
Most Recent Note - 6/11/2013 12:51:41 PM
G - Up from earlier lows after a gap down today following an analyst downgrade, retreating from a new all-time high hit on the prior session. Fundamental concerns were raised by its sub par earnings increase in the Mar '13 quarter, below the +25% minimum guideline (C criteria).
>>> The latest Featured Stock Update with an annotated graph appeared on 6/4/2013. Click here.
View all notes |
Alert me of new notes |
CANSLIM.net Company Profile |
SEC |
Zacks Reports |
StockTalk |
News |
Chart |
Request a new note
C
A N
S L
I M
|
Symbol/Exchange
Company Name
Industry Group |
PRICE |
CHANGE
(%Change) |
Day High |
Volume
(% DAV)
(% 50 day avg vol) |
52 Wk Hi
% From Hi |
Featured
Date |
Price
Featured |
Pivot Featured |
|
Max Buy |
VRX
-
NYSE
Valeant Pharmaceuticals
DRUGS - Drug Manufacturers - Other
|
$84.20
|
-1.61
-1.88% |
$86.03
|
1,127,575
64.59% of 50 DAV
50 DAV is 1,745,800
|
$96.25
-12.52%
|
4/30/2013
|
$60.24
|
PP = $76.66
|
|
MB = $80.49
|
Most Recent Note - 6/14/2013 6:27:45 PM
G- Concerns were raised by its sub par Mar '13 earnings report, however mostly bullish action has followed.Volume totals have been cooling while consolidating above prior highs. Support to watch is at prior highs coinciding with its 50 DMA near $76.
>>> The latest Featured Stock Update with an annotated graph appeared on 6/7/2013. Click here.
View all notes |
Alert me of new notes |
CANSLIM.net Company Profile |
SEC |
Zacks Reports |
StockTalk |
News |
Chart |
Request a new note
C
A N
S L
I M
|
|
|
|
THESE ARE NOT BUY RECOMMENDATIONS!
Comments contained in the body of this report are technical
opinions only. The material herein has been obtained
from sources believed to be reliable and accurate, however,
its accuracy and completeness cannot be guaranteed.
This site is not an investment advisor, hence it does
not endorse or recommend any securities or other investments.
Any recommendation contained in this report may not
be suitable for all investors and it is not to be deemed
an offer or solicitation on our part with respect to
the purchase or sale of any securities. All trademarks,
service marks and trade names appearing in this report
are the property of their respective owners, and are
likewise used for identification purposes only.
This report is a service available
only to active Paid Premium Members.
You may opt-out of receiving report notifications
at any time. Questions or comments may be submitted
by writing to Premium Membership Services 665 S.E. 10 Street, Suite 201 Deerfield Beach, FL 33441-5634 or by calling 1-800-965-8307
or 954-785-1121.
|
|
|

