You are not logged in.
This means you
CAN ONLY VIEW reports that were published prior to Monday, April 14, 2025.
You
MUST UPGRADE YOUR MEMBERSHIP if you want to see any current reports.
AFTER MARKET UPDATE - FRIDAY, JUNE 17TH, 2011
Previous After Market Report Next After Market Report >>>
|
|
|
|
DOW |
+42.92 |
12,004.44 |
+0.36% |
|
Volume |
1,604,552,270 |
+53% |
|
Volume |
2,340,699,780 |
+21% |
|
NASDAQ |
-7.22 |
2,616.48 |
-0.28% |
|
Advancers |
1,897 |
61% |
|
Advancers |
1,368 |
50% |
|
S&P 500 |
+3.89 |
1,271.53 |
+0.31% |
|
Decliners |
1,121 |
36% |
|
Decliners |
1,302 |
47% |
|
Russell 2000 |
+0.21 |
781.75 |
+0.03% |
|
52 Wk Highs |
26 |
|
|
52 Wk Highs |
28 |
|
|
S&P 600 |
+0.20 |
421.31 |
+0.05% |
|
52 Wk Lows |
46 |
|
|
52 Wk Lows |
112 |
|
|
 |
S&P 500 Index Narrowly Avoids 7th Consecutive Weekly Loss
Kenneth J. Gruneisen - Passed the CAN SLIM® Master's Exam
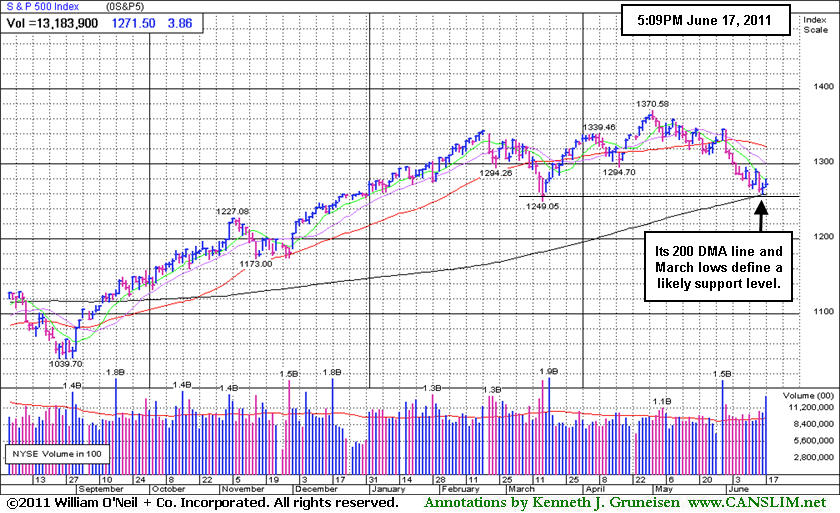
The S&P 500 Index narrowly avoided tallying its 7th consecutive weekly loss with the help of Friday's small gain. Meanwhile, the Nasdaq Composite Index was down -1% for the week for its 5th weekly loss in a row. For the week, the Dow gained +0.4%, making the blue chip index the exception. The major averages finished mixed on Friday. Advancers led decliners by 3-2 on the NYSE with the mix was close to even on the Nasdaq exchange. Options expirations contributed to higher volume totals reported on the NYSE and on the Nasdaq exchange. New 52-week lows solidly outnumbered new 52-week highs on both the NYSE and on the Nasdaq exchange. There were 8 high-ranked companies from the CANSLIM.net Leaders List that made new 52-week highs and appeared on the CANSLIM.net BreakOuts Page, up from 2 on the prior session. There were 5 gainers out of the 14 of the high-ranked leaders currently included on the Featured Stocks Page.
Stocks were said to have bounced in response to news this morning that Greece has appointed a new finance minister and that German and French officials support quick implementation of plans to address the country's fiscal woes. Meanwhile, Moody's reminded investors about the precarious fiscal conditions extant in the eurozone and announced that Italy's debt rating is on review for possible downgrade.
An unexpected gain of 0.8% in U.S. leading economic indicators was a sign that growth may pick up by the end of the year. At the same time, the International Monetary Fund cut its forecast for U.S. growth in 2011. The energy group was hurt by a 2% drop in oil prices to about $93 per barrel.
Weakness in the tech sector was largely attributable to sharp losses among semiconductor stocks, contributing to the tech-heavy Nasdaq composite Index's further technical deterioration. Research In Motion Ltd (RIMM -21.45%) upset investors with downside guidance and sank to its lowest level in more than four years. The company warned quarterly revenue may drop for the first time in nine years.
The June 2011 issue of CANSLIM.net News (read here) is now available to all upgraded members. Only UPGRADED members will also have access to the upcoming Q2 2011 Webcast scheduled for Wednesday, June 29th at 8PM EST.
Recent weak action was noted as the market (M criteria) correction caused more worrisome technical damage, reminding investors to raise cash and reduce exposure until a new confirmed rally with follow-through day (FTD) occurs.
PICTURED: The S&P 500 Index has slumped near it 200-day moving average (DMA) line and March lows which define a likely support level.
|
 Kenneth J. Gruneisen started out as a licensed stockbroker in August 1987, a couple of months prior to the historic stock market crash that took the Dow Jones Industrial Average down -22.6% in a single day. He has published daily fact-based fundamental and technical analysis on high-ranked stocks online for two decades. Through FACTBASEDINVESTING.COM, Kenneth provides educational articles, news, market commentary, and other information regarding proven investment systems that work in good times and bad.
Comments contained in the body of this report are technical opinions only and are not necessarily those of Gruneisen Growth Corp. The material herein has been obtained from sources believed to be reliable and accurate, however, its accuracy and completeness cannot be guaranteed. Our firm, employees, and customers may effect transactions, including transactions contrary to any recommendation herein, or have positions in the securities mentioned herein or options with respect thereto. Any recommendation contained in this report may not be suitable for all investors and it is not to be deemed an offer or solicitation on our part with respect to the purchase or sale of any securities. |
|
 |
Tech Sector Weakness Continues Causing Damage
Kenneth J. Gruneisen - Passed the CAN SLIM® Master's Exam
A modest gains for the Retail Index ($RLX +0.75%) along with gains from the Broker/Dealer Index ($XBD +0.71%) and Bank Index ($BKX +1.09%) helped offset weakness in other groups on Friday. The tech sector lagged as the Semiconductor Index ($SOX -1.44%), Biotechnology Index ($BTK -1.16%), Internet Index ($IIX -0.65%), and Networking Index ($NWX -0.24%) finished the session with unanimous losses. The Healthcare Index ($HMO -0.64%) ended modestly lower and commodity-linked groups were quiet as the Oil Services Index ($OSX -0.63%) and Integrated Oil Index ($XOI -0.05%) edged lower and the Gold & Silver Index ($XAU +0.33%) posted a small gain.
Charts courtesy www.stockcharts.com
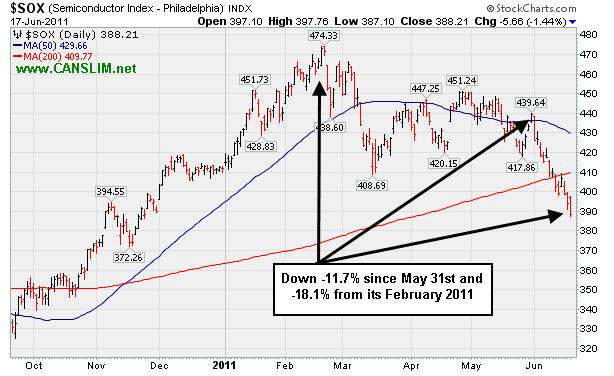
PICTURED: The Semiconductor Index ($SOX -1.44%) is down -11.7% since the end of May and -18.1% from its February 2011 high. The tech sector is typically an important contributor to market rallies. Its poor performance has clearly been a factor in the deterioration of the tech-heavy Nasdaq Composite Index (shown violating its 200-day moving average line in the prior Market Commentary - click here).
| Oil Services |
$OSX |
250.48 |
-1.58 |
-0.63% |
+2.19% |
| Healthcare |
$HMO |
2,301.02 |
-14.91 |
-0.64% |
+35.99% |
| Integrated Oil |
$XOI |
1,244.30 |
-0.68 |
-0.05% |
+2.57% |
| Semiconductor |
$SOX |
388.21 |
-5.66 |
-1.44% |
-5.73% |
| Networking |
$NWX |
279.67 |
-0.68 |
-0.24% |
-0.31% |
| Internet |
$IIX |
289.57 |
-1.89 |
-0.65% |
-5.90% |
| Broker/Dealer |
$XBD |
106.63 |
+0.75 |
+0.71% |
-12.25% |
| Retail |
$RLX |
502.58 |
+3.72 |
+0.75% |
-1.14% |
| Gold & Silver |
$XAU |
190.12 |
+0.63 |
+0.33% |
-16.09% |
| Bank |
$BKX |
47.45 |
+0.51 |
+1.09% |
-9.12% |
| Biotech |
$BTK |
1,393.95 |
-16.37 |
-1.16% |
+7.42% |
|
|
|
 |
Computer Software Firm Extended From Last Base Pattern
Kenneth J. Gruneisen - Passed the CAN SLIM® Master's Exam
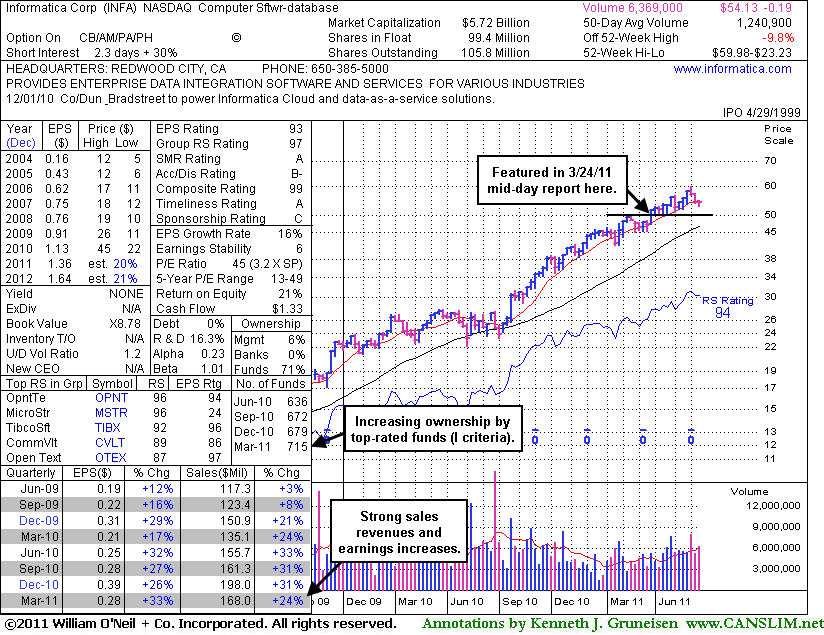
Informatica Corp. (INFA +$0.59 or +1.10% to $54.13) posted a small gain today, finding support near its 50-day moving average (DMA) line. It hit a new 52-week high on 6/01/11 but then there was a negative reversal noted. This high-ranked Computer Software - Database firm did not form a sound new base pattern. Following its last appearance in this FSU section with an annotated daily graph on 5/24/11 under the headline "Prior Highs and 50-Day Average Define Support to Watch", it surged to new highs with volume-driven gains. It is extended from its latest sound base pattern. Disciplined investors may watch for a new base to form and new (or add-on) buy signals to possibly develop and be noted. Since the 3/24/11 mid-day report highlighted this Redwood City, CA-based Computer Software - Database firm in yellow it has traded as much as +19.86% higher.
It reported +33% earnings on +24% sales revenues for the quarter ended March 31, 2011 versus the year ago period. That followed prior strong results after its Jun, Sep, and Dec '10 earnings increases were all above the +25% minimum guidelines. It has also maintained a steady annual earnings (A criteria) history. The number of top-rated funds owning its shares rose from 634 in Mar '10 to 715 in Mar '11, a reassuring sign concerning the I criteria.
|
|
|
Color Codes Explained :
Y - Better candidates highlighted by our
staff of experts.
G - Previously featured
in past reports as yellow but may no longer be buyable under the
guidelines.
***Last / Change / Volume data in this table is the closing quote data***
Symbol/Exchange
Company Name
Industry Group |
PRICE |
CHANGE
(%Change) |
Day High |
Volume
(% DAV)
(% 50 day avg vol) |
52 Wk Hi
% From Hi |
Featured
Date |
Price
Featured |
Pivot Featured |
|
Max Buy |
CACC
-
NASDAQ
Credit Acceptance Corp
FINANCIAL SERVICES - Credit Services
|
$76.71
|
-1.98
-2.52% |
$79.30
|
46,626
122.38% of 50 DAV
50 DAV is 38,100
|
$82.29
-6.78%
|
6/2/2011
|
$76.10
|
PP = $82.39
|
|
MB = $86.51
|
 Most Recent Note - 6/17/2011 3:53:08 PM
Y - This high-ranked leader in the Finance - Consumer Loans industry has been consolidating in a tight range above its 50 DMA line. Its color code is changed back to yellow after its recent resilience. Disciplined investors may watch for gains above its recent highs and wait for a follow-through day to confirm a new rally. Meanwhile, recent lows near $75 define important support to watch.
>>> The latest Featured Stock Update with an annotated graph appeared on 6/6/2011. Click here.
View all notes |
Alert me of new notes |
CANSLIM.net Company Profile |
SEC |
Zacks Reports |
StockTalk |
News |
Chart |
Request a new note
C
A N
S L
I M


|
CEVA
-
NASDAQ
Ceva Inc
ELECTRONICS - Semiconductor - Specialized
|
$27.43
|
-1.87
-6.38% |
$30.05
|
522,181
238.44% of 50 DAV
50 DAV is 219,000
|
$35.60
-22.95%
|
5/25/2011
|
$32.98
|
PP = $32.05
|
|
MB = $33.65
|
Most Recent Note - 6/17/2011 3:35:14 PM
Damaging loss today with above average volume has violated the previously noted low ($27.82 on 5/17/11) triggering a more worrisome technical sell signal. Based on weak action it will be dropped from the featured stocks list tonight.
>>> The latest Featured Stock Update with an annotated graph appeared on 5/25/2011. Click here.
View all notes |
Alert me of new notes |
CANSLIM.net Company Profile |
SEC |
Zacks Reports |
StockTalk |
News |
Chart |
Request a new note
C
A N
S L
I M
|
CMG
-
NYSE
Chipotle Mexican Grill
LEISURE - Restaurants
|
$268.97
|
-2.84
-1.04% |
$275.44
|
940,300
91.07% of 50 DAV
50 DAV is 1,032,500
|
$295.99
-9.13%
|
4/1/2011
|
$274.00
|
PP = $275.10
|
|
MB = $288.86
|
Most Recent Note - 6/16/2011 5:36:12 PM
G - Small loss today, slumping below its 50 DMA line which has acted as resistance now. It has not formed a sound base pattern. It finished near an upward trendline connecting its July 2010 and May 2011 lows which defines an initial technical support level to watch.
>>> The latest Featured Stock Update with an annotated graph appeared on 6/15/2011. Click here.
View all notes |
Alert me of new notes |
CANSLIM.net Company Profile |
SEC |
Zacks Reports |
StockTalk |
News |
Chart |
Request a new note
C
A N
S L
I M
|
EZPW
-
NASDAQ
Ezcorp Inc Cl A
SPECIALTY RETAIL - Specialty Retail, Other
|
$30.32
|
-0.51
-1.65% |
$31.12
|
436,088
123.89% of 50 DAV
50 DAV is 352,000
|
$33.31
-8.98%
|
6/13/2011
|
$31.18
|
PP = $33.41
|
|
MB = $35.08
|
Most Recent Note - 6/17/2011 3:40:19 PM
Y - Consolidating -9% off its 52-week high now, poised to close the week slumping just under its 50 DMA line with its 3rd consecutive loss on below average volume. Recent lows also help define important near-term chart support in the $29 area. The M criteria argues against new buying efforts without a FTD from at least one of the major averages as confirmation of a new rally.
>>> The latest Featured Stock Update with an annotated graph appeared on 6/13/2011. Click here.
View all notes |
Alert me of new notes |
CANSLIM.net Company Profile |
SEC |
Zacks Reports |
StockTalk |
News |
Chart |
Request a new note
C
A N
S L
I M
|
FCFS
-
NASDAQ
First Cash Financial Svs
SPECIALTY RETAIL - Specialty Retail, Other
|
$38.94
|
-0.34
-0.87% |
$39.86
|
238,174
124.24% of 50 DAV
50 DAV is 191,700
|
$42.36
-8.07%
|
5/31/2011
|
$42.00
|
PP = $40.23
|
|
MB = $42.24
|
Most Recent Note - 6/16/2011 5:39:45 PM
G - Down today on above average volume, slumping toward its 50 DMA line and prior lows. Its color code was changed to green after damaging losses on higher volume negated its latest breakout.
>>> The latest Featured Stock Update with an annotated graph appeared on 5/31/2011. Click here.
View all notes |
Alert me of new notes |
CANSLIM.net Company Profile |
SEC |
Zacks Reports |
StockTalk |
News |
Chart |
Request a new note
C
A N
S L
I M
|
Symbol/Exchange
Company Name
Industry Group |
PRICE |
CHANGE
(%Change) |
Day High |
Volume
(% DAV)
(% 50 day avg vol) |
52 Wk Hi
% From Hi |
Featured
Date |
Price
Featured |
Pivot Featured |
|
Max Buy |
FOSL
-
NASDAQ
Fossil Inc
CONSUMER DURABLES - Recreational Goods, Other
|
$106.68
|
-0.85
-0.79% |
$109.29
|
826,657
111.32% of 50 DAV
50 DAV is 742,600
|
$110.61
-3.55%
|
2/1/2011
|
$73.30
|
PP = $74.44
|
|
MB = $78.16
|
Most Recent Note - 6/16/2011 5:41:51 PM
G - Gain today with slightly above average volume for its second best close ever. Inching higher after 5 weeks of trading in a very tight range forming a "late-stage" base. Prior highs near $96 define initial support to watch coinciding with its 50 DMA line.
>>> The latest Featured Stock Update with an annotated graph appeared on 6/7/2011. Click here.
View all notes |
Alert me of new notes |
CANSLIM.net Company Profile |
SEC |
Zacks Reports |
StockTalk |
News |
Chart |
Request a new note
C
A N
S L
I M
|
HS
-
NYSE
Healthspring Inc
HEALTH SERVICES - Health Care Plans
|
$43.04
|
+0.60
1.41% |
$43.82
|
1,229,092
149.69% of 50 DAV
50 DAV is 821,100
|
$45.11
-4.59%
|
6/16/2011
|
$42.44
|
PP = $45.21
|
|
MB = $47.47
|
Most Recent Note - 6/17/2011 4:22:06 PM
Y - Small gap up gain today with above average volume. Consolidating above its 50 DMA line, its color code was changed to yellow with new pivot point cited based on its 52-week high plus 10 cents. The M criteria argues against new buying efforts without a follow-through day confirming a new rally. See the latest FSU analysis for more details and a new annotated graph.
>>> The latest Featured Stock Update with an annotated graph appeared on 6/16/2011. Click here.
View all notes |
Alert me of new notes |
CANSLIM.net Company Profile |
SEC |
Zacks Reports |
StockTalk |
News |
Chart |
Request a new note
C
A N
S L
I M
|
INFA
-
NASDAQ
Informatica Corp
COMPUTER SOFTWARE and SERVICES - Business Software and Services
|
$54.13
|
+0.59
1.10% |
$54.43
|
1,290,423
103.99% of 50 DAV
50 DAV is 1,240,900
|
$59.98
-9.75%
|
3/24/2011
|
$50.04
|
PP = $49.86
|
|
MB = $52.35
|
Most Recent Note - 6/17/2011 6:00:19 PM
G - Posted a small gain today, finding support near its 50 DMA line. Hit a new 52-week high on 6/01/11 but then there was a negative reversal noted. This high-ranked Computer Software - Database firm did not form a sound new base pattern. See the latest FSU analysis for more details and a new annotated weekly graph.
>>> The latest Featured Stock Update with an annotated graph appeared on 6/17/2011. Click here.
View all notes |
Alert me of new notes |
CANSLIM.net Company Profile |
SEC |
Zacks Reports |
StockTalk |
News |
Chart |
Request a new note
C
A N
S L
I M
|
MWIV
-
NASDAQ
M W I Veterinary Supply
HEALTH SERVICES - Medical Instruments and; Supplies
|
$79.25
|
+0.06
0.08% |
$79.50
|
88,674
102.99% of 50 DAV
50 DAV is 86,100
|
$86.99
-8.90%
|
11/4/2010
|
$61.79
|
PP = $59.60
|
|
MB = $62.58
|
Most Recent Note - 6/17/2011 4:04:46 PM
G - It may be forming a new base, however gains have lacked volume conviction following its 50 DMA line violation. Technically, that important short-term average has acted as resistance and a gain above it is needed for its outlook to improve.
>>> The latest Featured Stock Update with an annotated graph appeared on 6/9/2011. Click here.
View all notes |
Alert me of new notes |
CANSLIM.net Company Profile |
SEC |
Zacks Reports |
StockTalk |
News |
Chart |
Request a new note
C
A N
S L
I M
|
OPNT
-
NASDAQ
Opnet Technologies
INTERNET - Internet Software and Services
|
$36.36
|
-0.24
-0.66% |
$37.25
|
108,225
86.51% of 50 DAV
50 DAV is 125,100
|
$42.51
-14.47%
|
5/11/2011
|
$41.21
|
PP = $40.50
|
|
MB = $42.53
|
Most Recent Note - 6/15/2011 5:02:54 PM
G - Gapped down today and its loss on light volume led to its lowest close since 4/12/11. It slumped further below its 50 DMA line, and subsequent deterioration under its prior low would raise more serious concerns.
>>> The latest Featured Stock Update with an annotated graph appeared on 6/10/2011. Click here.
View all notes |
Alert me of new notes |
CANSLIM.net Company Profile |
SEC |
Zacks Reports |
StockTalk |
News |
Chart |
Request a new note
C
A N
S L
I M
|
Symbol/Exchange
Company Name
Industry Group |
PRICE |
CHANGE
(%Change) |
Day High |
Volume
(% DAV)
(% 50 day avg vol) |
52 Wk Hi
% From Hi |
Featured
Date |
Price
Featured |
Pivot Featured |
|
Max Buy |
OTEX
-
NASDAQ
Open Text Corp
INTERNET - Internet Software and Services
|
$58.86
|
+0.24
0.41% |
$59.74
|
233,986
73.77% of 50 DAV
50 DAV is 317,200
|
$67.08
-12.25%
|
6/1/2011
|
$65.86
|
PP = $67.18
|
|
MB = $70.54
|
Most Recent Note - 6/15/2011 5:05:03 PM
G - This week it halted its losing streak near highs prior to its 3/29/11 breakout. It now faces resistance due to the overhead supply created while trading at higher levels in recent months. Technically, gains above its 50 DMA line are needed for its outlook to improve.
>>> The latest Featured Stock Update with an annotated graph appeared on 6/2/2011. Click here.
View all notes |
Alert me of new notes |
CANSLIM.net Company Profile |
SEC |
Zacks Reports |
StockTalk |
News |
Chart |
Request a new note
C
A N
S L
I M
|
SWI
-
NYSE
Solarwinds Inc
COMPUTER SOFTWARE and SERVICES - Application Software
|
$25.01
|
-0.41
-1.61% |
$25.69
|
835,918
122.23% of 50 DAV
50 DAV is 683,900
|
$26.68
-6.26%
|
6/7/2011
|
$24.22
|
PP = $25.05
|
|
MB = $26.30
|
Most Recent Note - 6/17/2011 3:42:56 PM
Y - Quietly slumping under its pivot point today. Following its recent breakout there was a worrisome negative reversal on 6/15/11 with volume 4 times average after hitting a new 52-week high. Prior resistance in the $24-25 area may now act as an initial support level. Previously noted - "Concerns remain until a follow-through day confirms the broader market (M criteria) is truly favorable."
>>> The latest Featured Stock Update with an annotated graph appeared on 6/8/2011. Click here.
View all notes |
Alert me of new notes |
CANSLIM.net Company Profile |
SEC |
Zacks Reports |
StockTalk |
News |
Chart |
Request a new note
C
A N
S L
I M
|
ULTA
-
NASDAQ
Ulta Salon Cosm & Frag
SPECIALTY RETAIL - Specialty Retail, Other
|
$57.42
|
+0.54
0.95% |
$57.96
|
1,093,294
155.52% of 50 DAV
50 DAV is 703,000
|
$59.40
-3.33%
|
1/6/2011
|
$36.12
|
PP = $37.34
|
|
MB = $39.21
|
Most Recent Note - 6/16/2011 12:38:24 PM
G - Perched near its all-time high, extended from any sound base pattern. The M criteria argues against new buying efforts in stocks until a new confirmed rally with follow-through day from at least one of the major averages.
>>> The latest Featured Stock Update with an annotated graph appeared on 5/26/2011. Click here.
View all notes |
Alert me of new notes |
CANSLIM.net Company Profile |
SEC |
Zacks Reports |
StockTalk |
News |
Chart |
Request a new note
C
A N
S L
I M
|
ZAGG
-
NASDAQ
Zagg Inc
SPECIALTY RETAIL - Specialty Retail, Other
|
$12.30
|
-0.04
-0.32% |
$12.61
|
853,026
67.18% of 50 DAV
50 DAV is 1,269,800
|
$13.05
-5.75%
|
6/1/2011
|
$10.92
|
PP = $10.59
|
|
MB = $11.12
|
Most Recent Note - 6/16/2011 11:45:35 AM
G - Up today, getting more extended from the previously noted cup-with-handle type base pattern. Its recent low ($10.15 on 6/07/11) now defines an important near-term chart support level to watch on pullbacks.
>>> The latest Featured Stock Update with an annotated graph appeared on 6/1/2011. Click here.
View all notes |
Alert me of new notes |
CANSLIM.net Company Profile |
SEC |
Zacks Reports |
StockTalk |
News |
Chart |
Request a new note
C
A N
S L
I M
|
|
|
|
THESE ARE NOT BUY RECOMMENDATIONS!
Comments contained in the body of this report are technical
opinions only. The material herein has been obtained
from sources believed to be reliable and accurate, however,
its accuracy and completeness cannot be guaranteed.
This site is not an investment advisor, hence it does
not endorse or recommend any securities or other investments.
Any recommendation contained in this report may not
be suitable for all investors and it is not to be deemed
an offer or solicitation on our part with respect to
the purchase or sale of any securities. All trademarks,
service marks and trade names appearing in this report
are the property of their respective owners, and are
likewise used for identification purposes only.
This report is a service available
only to active Paid Premium Members.
You may opt-out of receiving report notifications
at any time. Questions or comments may be submitted
by writing to Premium Membership Services 665 S.E. 10 Street, Suite 201 Deerfield Beach, FL 33441-5634 or by calling 1-800-965-8307
or 954-785-1121.
|
|
|

