You are not logged in.
This means you
CAN ONLY VIEW reports that were published prior to Monday, April 14, 2025.
You
MUST UPGRADE YOUR MEMBERSHIP if you want to see any current reports.
AFTER MARKET UPDATE - WEDNESDAY, JUNE 17TH, 2009
Previous After Market Report Next After Market Report >>>
|
|
|
|
DOW |
-7.49 |
8,497.18 |
-0.09% |
|
Volume |
1,316,028,490 |
+12% |
|
Volume |
2,565,578,790 |
+11% |
|
NASDAQ |
+11.88 |
1,808.06 |
+0.66% |
|
Advancers |
1,264 |
41% |
|
Advancers |
1,427 |
50% |
|
S&P 500 |
-1.26 |
910.71 |
-0.14% |
|
Decliners |
1,730 |
56% |
|
Decliners |
1,279 |
45% |
|
Russell 2000 |
+3.29 |
507.03 |
+0.65% |
|
52 Wk Highs |
4 |
|
|
52 Wk Highs |
17 |
|
|
S&P 600 |
+1.74 |
266.25 |
+0.66% |
|
52 Wk Lows |
4 |
|
|
52 Wk Lows |
14 |
|
|
 |
Major Averages Post Mixed Results
Adam Sarhan, Contributing Writer,
The Dow Jones Industrial Average and the benchmark S&P 500 Index ended lower for a third consecutive day while the Nasdaq Composite Index snapped its losing streak and ended with modest gains on the session. Sentiment turned sour after FedEx Corp (FDX -1.40%) reported lackluster sales data, increasing concerns that the economic rebound will slow. Volume totals were reported higher on both major US exchanges. Decliners led advancers by almost a 3-to-2 ratio on the NYSE, yet advancers narrowly led decliners on the Nasdaq exchange. There were 5 high-ranked companies from the CANSLIM.net Leaders List that made a new 52-week high and appeared on the CANSLIM.net BreakOuts Page, higher than the 3 issues that appeared on the prior session. A further expansion in the new highs list would offer encouraging news for growth oriented investors.
Before Wednesday's opening bell, FedEx released a disappointing earnings forecast and said the economy is "extremely difficult." The delivery giant said revenues were down while earnings were up. The primary concern here is that this is not sustainable, as the main way to increase earnings on lower revenues is to slash your workforce. That could work for one or two quarters, but beyond that it is simply an unsustainable means of boosting earnings. The company did not provide a full-year outlook which also hurt the stock.
Elsewhere, the rating giant, Standard & Poor's downgraded the credit ratings of 18 banks as Congress prepared legislation to address the financial industry. Several of the country's largest banks began repaying TARP funds, yet this was a foregone conclusion and investors largely yawned at the news. In other economic news, the Labor Department released the consumer prices index (CPI) which showed that the cost of living in the US rose at a slower-than-expected pace in May. This helped allay inflation concerns and was the largest 12-month drop in prices in almost 60 years! The consumer price index rose +0.1% after no change a month earlier. From May 2008- May 2009, the consumer price index fell -1.3% which was the largest decline since 1950. Remember that prices last year were way out of whack with historical norms, so a pullback of some sort is not necessarily a bad thing. At this point, how many people do you know who are really upset at paying lower bills each month?
PICTURED: The Nasdaq Composite index ended higher after successfully testing support, boosted by the tech sector's gains.
|
|
|
 |
Tech Gains Helped Nasdaq Composite Outpace Peers
Kenneth J. Gruneisen - Passed the CAN SLIM® Master's Exam
There was little net change for the Networking ($NWX -0.13%) and Internet ($IIX +0.07%) indexes, yet the tech sector saw decent gains from the Semiconductor ($SOX +0.93%) and Biotechnology ($BTK +1.23%) indexes. That tech strength helped the Nasdaq Composite Index post a small gain and outpace its peers which ended in the red. Gains for the Retail Index ($RLX +1.03%) and the Healthcare ($HMO +1.24%) group worked to help offset losses elsewhere.Weakness on Wednesday was mostly confined to the financial and commodity-linked groups as the Bank ($BKX -3.29%) and Broker/Dealer ($XBD -1.90%) indexes fell along with the Oil Services ($OSX -2.79%) and Integrated Oil ($XOI -1.76%) indexes. The Gold & Silver Index ($XAU -0.56%) suffered a smaller gain.
Charts courtesy www.stockcharts.com
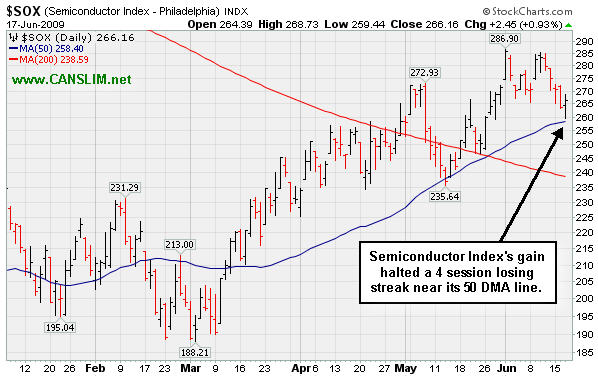
PICTURED: The Semiconductor Index ($SOX +0.93%) posted a gain, halting a 4 session losing streak just above its 50-day moving average (DMA) line.
| Oil Services |
$OSX |
167.71 |
-4.82 |
-2.79% |
+38.16% |
| Healthcare |
$HMO |
1,029.94 |
+12.61 |
+1.24% |
+7.27% |
| Integrated Oil |
$XOI |
931.61 |
-16.68 |
-1.76% |
-4.91% |
| Semiconductor |
$SOX |
266.16 |
+2.45 |
+0.93% |
+25.45% |
| Networking |
$NWX |
185.19 |
-0.25 |
-0.13% |
+28.70% |
| Internet |
$IIX |
187.37 |
+0.13 |
+0.07% |
+40.07% |
| Broker/Dealer |
$XBD |
96.91 |
-1.88 |
-1.90% |
+25.09% |
| Retail |
$RLX |
320.66 |
+3.27 |
+1.03% |
+14.82% |
| Gold & Silver |
$XAU |
139.77 |
-0.79 |
-0.56% |
+12.85% |
| Bank |
$BKX |
35.52 |
-1.21 |
-3.29% |
-19.86% |
| Biotech |
$BTK |
660.80 |
+8.01 |
+1.23% |
+2.11% |
|
|
|
 |
Important Support Tested Near Prior Highs And 50-Day Moving Average
Kenneth J. Gruneisen - Passed the CAN SLIM® Master's Exam
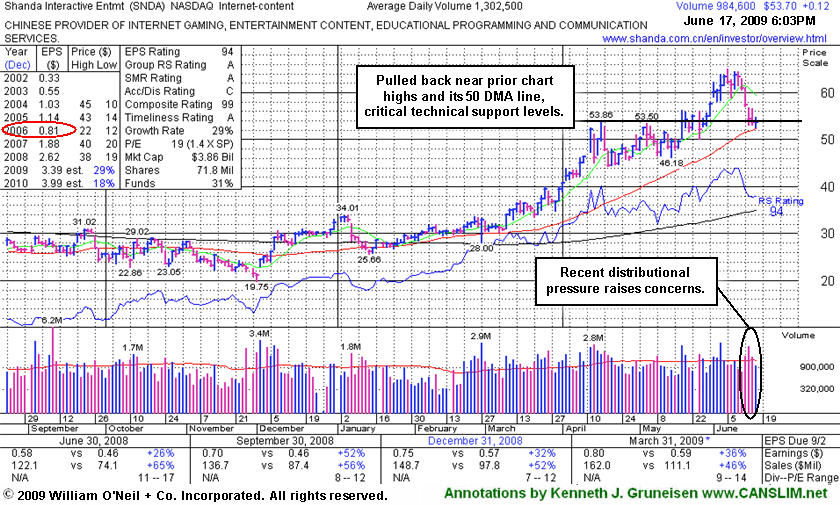
Shanda Interactive Ent Ltd (SNDA $+0.12 or +0.22% to $53.70) posted a tiny gain today on light volume. That followed 3 straight losses with above average volume, yet ended a 5-day losing streak near its latest pivot point. It is now testing prior chart highs and its 50-day moving average line which are very important support levels to watch. Violations could trigger worrisome technical sell signals, especially if volume spikes higher behind subsequent losses.
Just after featured in the June 2009 issue of CANSLIM.net News, it quickly got too extended from a proper buy point. In the stock's latest Featured Stock Update section appearance on June 3rd it was noted that, "Patient investors may watch for a pullback near its 50-day moving average (DMA) line, an important support level which has not been tested since breaking out above resistance at $34.00 back in March." Its color code has been changed to yellow now, however the recently noted distributional pressure (6/12 and 6/15) in this stock does not bode well, and distributional pressure recently evident in the broader market averages (the M criteria) has not been an encouraging sign. Investors who may be considering SNDA trades now should be sure to review the additional analysis that was included in the "What to Look Out For" section of the June 2009 issue of CANSLIM.net News - read here).
|
|
|
Color Codes Explained :
Y - Better candidates highlighted by our
staff of experts.
G - Previously featured
in past reports as yellow but may no longer be buyable under the
guidelines.
***Last / Change / Volume quote data in this table corresponds with the timestamp on the note***
Symbol/Exchange
Company Name
Industry Group |
Last |
Chg. |
Vol
% DAV |
Date Featured |
Price Featured |
Latest Pivot Point
Featured |
Status |
| Latest Max Buy Price |
GMCR
- NASDAQ
Green Mtn Coffee Roastrs
FOOD & BEVERAGE - Processed & Packaged Goods
|
$56.17
|
N/A
|
N/A
N/A
|
1/1/2008
(Date
Featured) |
$27.13
(Price
Featured) |
PP = $28.66 |
G |
| MB = $30.09 |
Most Recent Note - 6/17/2009
G - Small loss on lighter volume today while consolidating well above its 50 DMA line -important support to watch. 3:2 stock split effective 6/09/09. GMCR has traded up more than +144% since appearing with an annotated graph under the headline "It May Soon Be Time To Go Green" when featured in the January 2009 CANSLIM.net News (read here).
>>> The latest Featured Stock Update with an annotated graph appeared on 6/8/2009. click here.
|
|
C
A
S
I |
News |
Chart |
SEC
View all notes Alert
me of new notes
Company
Profile
|
HMSY
- NASDAQ
H M S Holdings Corp
COMPUTER SOFTWARE & SERVICES - Healthcare Information Service
|
$38.87
|
N/A
|
N/A
N/A
|
2/20/2009
(Date
Featured) |
$34.08
(Price
Featured) |
PP = $38.38 |
Y |
| MB = $40.30 |
Most Recent Note - 6/17/2009 5:18:20 PM
Y - Small gap up and gain today with above average volume for a new high close. That added to its gain after a gap up on the prior session triggered a technical buy signal. No overhead supply is left to hinder the progress for this Commercial Services - Healthcare firm.
>>> The latest Featured Stock Update with an annotated graph appeared on 6/16/2009. click here.
|
|
C
A
S
I |
News |
Chart |
SEC
View all notes Alert
me of new notes
Company
Profile
|
LFT
-
|
$26.00
|
N/A
|
N/A
N/A
|
4/2/2009
(Date
Featured) |
$22.19
(Price
Featured) |
PP = $21.81 |
G |
| MB = $22.90 |
Most Recent Note - 6/17/2009 5:41:12 PM
G - Positive reversal today and close near the session high with a gain on higher volume was a very encouraging sign of institiutional support after an earlier intra-day violation of its 50 DMA line. At its low of the session it had completely negated its 5/28/09 gap up gain and all gains that had followed. Previously noted on 6/05/09 as it rose from a choppy (improper) base pattern. Its progress could be hindered by future share offerings. Prompt repair of its recent 50 DMA line violation, and its gap up, were noted as signs of solid institutional (the I criteria) support and buying demand. This Chinese Computer Software firm recently filed a registration of approximately 16 million shares for resale, and it also revealed a planned acquisition of another Chinese service provider.
>>> The latest Featured Stock Update with an annotated graph appeared on 6/4/2009. click here.
|
|
C
A
S
I |
News |
Chart |
SEC
View all notes Alert
me of new notes
Company
Profile
|
NTES
- NASDAQ
Netease Inc Adr
INTERNET - Internet Information Providers
|
$35.08
|
N/A
|
N/A
N/A
|
5/21/2009
(Date
Featured) |
$31.19
(Price
Featured) |
PP = $32.75 |
G |
| MB = $34.39 |
Most Recent Note - 6/17/2009 5:43:58 PM
G - This strong leader is quietly consolidating after encountering some distributional pressure late last week. It is still a bit too extended from its second-stage base, while prior chart highs and its 50 DMA line (both near $32) are an important support level to watch on pullbacks. Its 5/28/09 gap up and considerable gain with +79% above average volume confirmed a technical buy signal as it rose above its pivot point. Indications of institutional (the I criteria) buying demand have been noted after earnings news on 5/20/09 a shakeout tested support near its 50 DMA line. First featured at $26.75 in the 3/31/09 CANSLIM.net Mid-Day Breakouts Report (read here). This high-ranked Chinese Internet - Content firm was also summarized in greater detail including an annotated graph in the April 2009 issue of CANSLIM.net News (read here).
>>> The latest Featured Stock Update with an annotated graph appeared on 6/5/2009. click here.
|
|
C
A
S
I |
News |
Chart |
SEC
View all notes Alert
me of new notes
Company
Profile
|
NVEC
- NASDAQ
N V E Corp
ELECTRONICS - Semiconductor - Specialized
|
$45.11
|
N/A
|
N/A
N/A
|
3/13/2009
(Date
Featured) |
$33.85
(Price
Featured) |
PP = $39.01 |
G |
| MB = $40.96 |
Most Recent Note - 6/17/2009 5:45:52 PM
G - Gain today with slightly higher volume for a new high close added to the prior session's gap up gain on below average volume. Found support above its 50 DMA line in May which was an encouraging sign. Earnings per share rose +38% over the year ago period, yet sales were up just +14% and still rather minuscule.
>>> The latest Featured Stock Update with an annotated graph appeared on 6/9/2009. click here.
|
|
C
A
S
I |
News |
Chart |
SEC
View all notes Alert
me of new notes
Company
Profile
|
SNDA
-
|
$53.70
|
N/A
|
N/A
N/A
|
5/31/2009
(Date
Featured) |
$57.62
(Price
Featured) |
PP = $53.95 |
Y |
| MB = $56.65 |
Most Recent Note - 6/17/2009 5:57:45 PM
Y - Tiny gain today on light volume followed 3 straight losses with above average volume, yet ended a 5-day losing streak near its previously cited pivot point. Its color code is changed to yellow. Prior chart highs and its 50 DMA line are still important support levels to watch, where violations could trigger technical sell signals. Detailed analysis was included when recently featured in the June 2009 issue of CANSLIM.net News. Be sure to review the "What to Look Out For" section and entire detailed summary - read here).
>>> The latest Featured Stock Update with an annotated graph appeared on 6/17/2009. click here.
|
|
C
A
S
I |
News |
Chart |
SEC
View all notes Alert
me of new notes
Company
Profile
|
SYNA
- NASDAQ
Synaptics Inc
COMPUTER SOFTWARE & SERVICES - Information Technology Service
|
$38.18
|
N/A
|
N/A
N/A
|
5/18/2009
(Date
Featured) |
$32.58
(Price
Featured) |
PP = $34.52 |
G |
| MB = $36.25 |
Most Recent Note - 6/17/2009 5:59:18 PM
G - Gain today on average volume ended a 4 session losing streak while consolidating above its August 2008 chart highs ($36), its 50 DMA line, and recent chart highs that define an important support level. First featured in yellow in the May 18, 2009 mid-day report (read here). The number of top-rated funds owning its shares rose from 123 in June '08 to 194 in March '09, which is good news concerning the I criteria. Its annual earnings (the A criteria) history showed a dowturn in 2006, leaving concerns, but it followed that up with strong growth the next 2 years. Its small supply of shares (the S criteria) outstanding could contribute to especially great volatility in the event of institutional accumulation or distribution.
>>> The latest Featured Stock Update with an annotated graph appeared on 6/15/2009. click here.
|
|
C
A
S
I |
News |
Chart |
SEC
View all notes Alert
me of new notes
Company
Profile
|
TNDM
- NASDAQ
Tandem Diabetes Care Inc
TELECOMMUNICATIONS - Wireless Communications
|
$26.79
|
N/A
|
N/A
N/A
|
3/2/2009
(Date
Featured) |
$18.89
(Price
Featured) |
PP = $29.85 |
G |
| MB = $31.34 |
Most Recent Note - 6/17/2009 6:01:33 PM
G - Gapped up today after an analyst upgrade, yet it still is trading below its 50 DMA line which may now act as a resistance level. It triggered a technical sell signal when it violated its 50 DMA line last week with big losses on heavy volume which were indicative of worrisome distributional pressure. A sound base needs to form before new buying efforts might be justified under the investment system's guidelines. Its impressive "positive reversal" on 5/14/09 was noted as a sign of prompt institutional support arriving in the lower $20 range. Technically, it also recently negated gains from when it gapped for a new all-time high on 4/30/09 and afterward. It traded up as much as +72.42% since first featured at $18.89 in the 3/02/09 Mid-Day BreakOuts Report (read here).
>>> The latest Featured Stock Update with an annotated graph appeared on 6/10/2009. click here.
|
|
C
A
S
I |
News |
Chart |
SEC
View all notes Alert
me of new notes
Company
Profile
|
|
|
|
THESE ARE NOT BUY RECOMMENDATIONS!
Comments contained in the body of this report are technical
opinions only. The material herein has been obtained
from sources believed to be reliable and accurate, however,
its accuracy and completeness cannot be guaranteed.
This site is not an investment advisor, hence it does
not endorse or recommend any securities or other investments.
Any recommendation contained in this report may not
be suitable for all investors and it is not to be deemed
an offer or solicitation on our part with respect to
the purchase or sale of any securities. All trademarks,
service marks and trade names appearing in this report
are the property of their respective owners, and are
likewise used for identification purposes only.
This report is a service available
only to active Paid Premium Members.
You may opt-out of receiving report notifications
at any time. Questions or comments may be submitted
by writing to Premium Membership Services 665 S.E. 10 Street, Suite 201 Deerfield Beach, FL 33441-5634 or by calling 1-800-965-8307
or 954-785-1121.
|
|
|


