You are not logged in.
This means you
CAN ONLY VIEW reports that were published prior to Monday, February 26, 2024.
You
MUST UPGRADE YOUR MEMBERSHIP if you want to see any current reports.
AFTER MARKET UPDATE - TUESDAY, JUNE 16TH, 2020
Previous After Market Report Next After Market Report >>>
|
|
|
|
DOW |
+526.82 |
26,289.98 |
+2.04% |
|
Volume |
1,268,497,591 |
+4% |
|
Volume |
4,597,199,900 |
+4% |
|
NASDAQ |
+162.85 |
9,888.87 |
+1.67% |
|
Advancers |
2,361 |
82% |
|
Advancers |
2,491 |
75% |
|
S&P 500 |
+58.15 |
3,124.74 |
+1.90% |
|
Decliners |
522 |
18% |
|
Decliners |
826 |
25% |
|
Russell 2000 |
+32.65 |
1,452.26 |
+2.30% |
|
52 Wk Highs |
44 |
|
|
52 Wk Highs |
127 |
|
|
S&P 600 |
+20.87 |
850.16 |
+2.52% |
|
52 Wk Lows |
1 |
|
|
52 Wk Lows |
5 |
|
|
 |
Major Indices Rose With Greater Volume and More Leadership
Kenneth J. Gruneisen - Passed the CAN SLIM® Master's Exam
The Dow climbed 526 points, while the S&P 500 rose 1.9%. The Nasdaq Composite gained 1.8%. Advancers led decliners by more than a 4-1 margin on the NYSE and 3-1 on the Nasdaq exchange. The reported volume totals were higher than the prior session on the NYSE and on the Nasdaq exchange, indicative of another increase in institutional buying demand. There were 43 high-ranked companies from the Leaders List that hit new 52-week highs and were listed on the BreakOuts Page, more than doubling the total of 18 on the prior session. New 52-week highs totals expanded and outnumbered new 52-week lows totals on the NYSE and on the Nasdaq exchange. The major indices remain in a confirmed uptrend (M criteria). Any sustainable rally requires a healthy crop of new leaders, so it was encouraging to see the new highs totals improve. Charts used courtesy of www.stockcharts.com
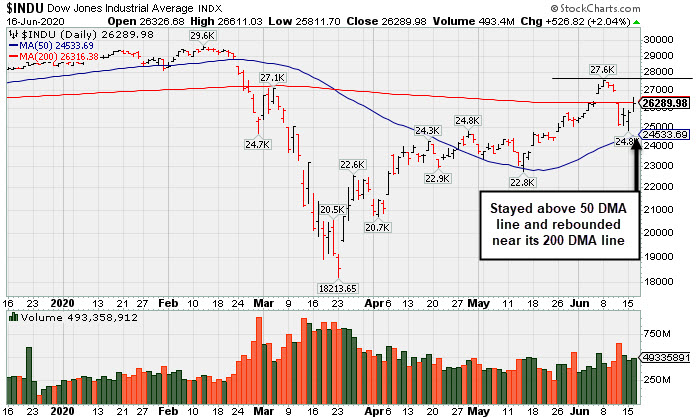
PICTURED: The Dow Jones Industrial Average is -11% off its record high. It found support above its 50-day moving average (DMA) line and rebounded near its 200 DMA line. Subsequent gains above the 200 DMA line and above the prior high would be a reassuring sign of improving market health.
Stocks advanced for a third-straight session on Tuesday as investors assessed a record rebound in retail sales and raised expectations for additional stimulus measures. Media outlets reported that the Trump administration was drafting an infrastructure plan worth nearly $1 trillion. Elsewhere, news that a widely available steroid drug showed promise in treating critically ill COVID-19 patients also boosted risk sentiment.
On the data front, retail sales posted a record rebound of 17.7% in May, more than twice consensus estimates, as states began easing COVID-19-related restrictions. Separately, both industrial and manufacturing production advanced by less than projected last month. Additionally, a release from the NAHB revealed homebuilder sentiment improved more than forecasted in June. Treasuries weakened, with the yield on the 10-year note adding four basis points to 0.75%.
The Federal Reserve’s semi-annual monetary policy report was also in focus, with Fed Chair Jerome Powell testifying before Congress. He reiterated that the U.S. economy faces a long road to recovery despite signs of stabilization. Yesterday, the major averages erased early session losses as the Federal Reserve announced plans to purchase individual corporate bonds, broadening their credit facility and signaling its ongoing support to the economy.
All 11 S&P 500 sectors finished in positive territory, with 10 group rising more than 1.2%. The Energy group paced the gains as WTI crude rose 2.6% to $38.08/barrel. Health Care stocks also outperformed, with Eli Lily (LLY +15.68%) surging after the drug maker revealed positive results for a potential breast cancer therapy. |
 Kenneth J. Gruneisen started out as a licensed stockbroker in August 1987, a couple of months prior to the historic stock market crash that took the Dow Jones Industrial Average down -22.6% in a single day. He has published daily fact-based fundamental and technical analysis on high-ranked stocks online for two decades. Through FACTBASEDINVESTING.COM, Kenneth provides educational articles, news, market commentary, and other information regarding proven investment systems that work in good times and bad.
Comments contained in the body of this report are technical opinions only and are not necessarily those of Gruneisen Growth Corp. The material herein has been obtained from sources believed to be reliable and accurate, however, its accuracy and completeness cannot be guaranteed. Our firm, employees, and customers may effect transactions, including transactions contrary to any recommendation herein, or have positions in the securities mentioned herein or options with respect thereto. Any recommendation contained in this report may not be suitable for all investors and it is not to be deemed an offer or solicitation on our part with respect to the purchase or sale of any securities. |
|
 |
Retail, Financial, Tech, and Energy Groups Led Gainers
Kenneth J. Gruneisen - Passed the CAN SLIM® Master's Exam
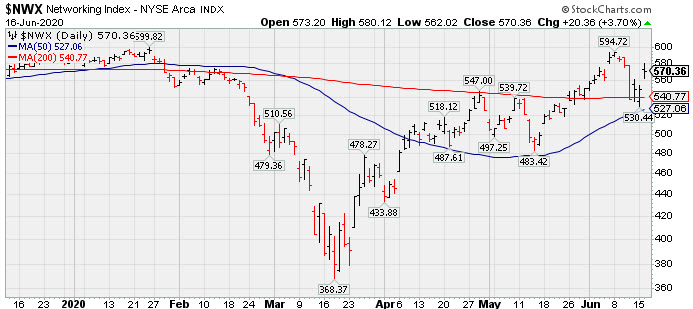
The Retail Index ($RLX +2.25%) posted a solid gain, and the Bank Index ($BKX +2.19%) outpaced the Broker/Dealer Index ($XBD +1.55%) as financials also helped underpin the market rebound. The tech sector had a positive bias as the Networking Index ($NWX +3.70%) set a strong pace and the Biotech Index ($BTK +1.21%) and Semiconductor Index ($SOX +1.80%) both rose. Commodity-linked groups were mixed as the Oil Services Index ($OSX +2.14%) and the Integrated Oil Index ($XOI 3.16%) both rose, but the Gold & Silver Index ($XAU -2.67%) was a standout decliner .
PICTURED: The Networking Index ($NWX +3.70%) recently pulled back and tested support at its 200-day moving average (DMA) line.
| Oil Services |
$OSX |
36.65 |
+0.77 |
+2.15% |
-53.19% |
| Integrated Oil |
$XOI |
843.56 |
+25.84 |
+3.16% |
-33.61% |
| Semiconductor |
$SOX |
1,965.86 |
+34.85 |
+1.80% |
+6.28% |
| Networking |
$NWX |
570.36 |
+20.36 |
+3.70% |
-2.24% |
| Broker/Dealer |
$XBD |
277.97 |
+4.25 |
+1.55% |
-4.27% |
| Retail |
$RLX |
2,925.67 |
+64.64 |
+2.26% |
+19.45% |
| Gold & Silver |
$XAU |
114.11 |
-3.13 |
-2.67% |
+6.72% |
| Bank |
$BKX |
80.61 |
+1.53 |
+1.93% |
-28.89% |
| Biotech |
$BTK |
5,565.67 |
+66.54 |
+1.21% |
+9.83% |
|
|
|
 |
Still Below 50-Day Moving Average Following Damaging Gap Down
Kenneth J. Gruneisen - Passed the CAN SLIM® Master's Exam
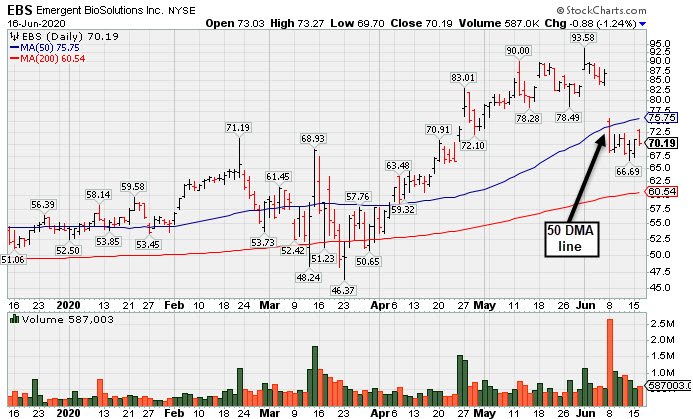
Emergent Biosolutions (EBS -$0.88 or -1.24% to $70.19) has continued to sputter after a damaging gap down and volume-driven loss on 6/08/20 triggered a worrisome technical sell signal. Subsequent gains and a convincing rebound above the 50-day moving average DMA line ($75.75) are still needed to help its outlook improve.
Fundamentals remain strong. EBS was last shown in this FSU section on 5/26/20 with an annotated graph under the headline, "Volume Light Behind Recent Pullback From All-Time High". It currently has a 91 Earnings Per Share Rating, putting it in the top 10% of all publicly traded companies based on its earnings history. It reported Mar '20 earnings of 1 cent per share versus a 10 cents per share loss for the year ago period with +1% better sales revenues. Earnings rose +101% on +33% sales revenues for the Dec '19 quarter, and earnings rose +120% on +80% sales revenues in the Sep '19 quarter, very strong quarterly comparisons versus the year ago periods. Annual earnings history (A criteria) has been strong since a downturn in FY '16.
It has a small supply (S criteria) of only 45.1 million shares in the publicly traded float which can contribute to greater price volatility in the event of institutional buying or selling. The number of top-rated funds owning its shares rose from 453 in Sep '19 to 467 in Mar '20, and its current Up/Down Volume Ratio of 1.4 is an unbiased indication its shares have been under accumulation over the past 50 days. It has an A Timeliness rating and an B- Accumulation/Distribution rating. The company is in the Medical - Biomed/Biotech industry group which is a leading group currently ranked 7th out of the 197 industry groups (L criteria). |
|
|
Color Codes Explained :
Y - Better candidates highlighted by our
staff of experts.
G - Previously featured
in past reports as yellow but may no longer be buyable under the
guidelines.
***Last / Change / Volume data in this table is the closing quote data***
Symbol/Exchange
Company Name
Industry Group |
PRICE |
CHANGE
(%Change) |
Day High |
Volume
(% DAV)
(% 50 day avg vol) |
52 Wk Hi
% From Hi |
Featured
Date |
Price
Featured |
Pivot Featured |
|
Max Buy |
 FTNT
-
NASDAQ
FTNT
-
NASDAQ
Fortinet Inc
Computer Sftwr-Security
|
$136.73
|
+0.82
0.60% |
$140.00
|
1,258,610
69.15% of 50 DAV
50 DAV is 1,820,000
|
$149.69
-8.66%
|
5/7/2020
|
$134.40
|
PP = $121.92
|
|
MB = $128.02
|
Most Recent Note - 6/15/2020 5:44:24 PM
G - Closed -9.2% off its all-time high after today's big gain with higher (+10% above average) volume. Its 50 DMA line ($124.14) and prior highs in the $121 area define important near-term support to watch. See the latest FSU analysis for more details and a new annotated graph.
>>> FEATURED STOCK ARTICLE : Managed a "Positive Reversal" After Brief Dip Below "Max Buy" Level - 6/15/2020 |
View all notes |
Set NEW NOTE alert |
Company Profile |
SEC
News |
Chart |
Request a new note
C
A
S
I |
EBS
-
NYSE
Emergent Biosolutions
DRUGS - Biotechnology
|
$70.19
|
-0.88
-1.24% |
$73.27
|
586,803
96.36% of 50 DAV
50 DAV is 609,000
|
$93.58
-24.99%
|
6/1/2020
|
$72.10
|
PP = $90.10
|
|
MB = $94.61
|
 Most Recent Note - 6/16/2020 6:02:34 PM
G - Subsequent gains and a convincing rebound above the 50 DMA line ($75.75) are still needed to help its outlook improve. Fundamentals remain strong. See the latest FSU analysis for more details and a new annotated graph.
>>> FEATURED STOCK ARTICLE : Still Below 50-Day Moving Average Following Damaging Gap Down - 6/16/2020 |
View all notes |
Set NEW NOTE alert |
Company Profile |
SEC
News |
Chart |
Request a new note
C
A
S
I |
NBIX
-
NASDAQ
Neurocrine Biosciences
DRUGS - Biotechnology
|
$118.89
|
+3.56
3.09% |
$119.42
|
778,389
94.69% of 50 DAV
50 DAV is 822,000
|
$128.29
-7.33%
|
5/19/2020
|
$123.71
|
PP = $119.75
|
|
MB = $125.74
|
Most Recent Note - 6/16/2020 6:05:42 PM
G - Rebounded near its pivot point with today's 3rd consecutive gain. Recent quarterly comparisons through Mar '20 showed greatly improved sales revenues and earnings increases versus year ago periods (C criteria). After years of losses it reported solid annual earnings (A criteria) in FY '18 and '19.
>>> FEATURED STOCK ARTICLE : Pullback Into Prior Base Negated Recent Breakout - 6/8/2020 |
View all notes |
Set NEW NOTE alert |
Company Profile |
SEC
News |
Chart |
Request a new note
C
A
S
I |
AMD
-
NASDAQ
Advanced Micro Devices
ELECTRONICS - Semiconductor - Broad Line
|
$54.46
|
-0.22
-0.40% |
$56.07
|
50,684,173
75.26% of 50 DAV
50 DAV is 67,341,000
|
$59.27
-8.12%
|
6/9/2020
|
$55.41
|
PP = $56.98
|
|
MB = $59.83
|
Most Recent Note - 6/16/2020 6:13:38 PM
Y - Consolidating above important support at its 50 DMA line ($53.61) with volume totals cooling. Subsequent gains above the pivot point backed by at least +40% above average volume are still needed to trigger a convincing technical buy signal. Previously met stubborn resistance in the $57-59 area. Gains into new high territory may mark the beginning of a substantial leg higher. The 3 latest quarterly comparisons through Mar '20 showed very strong earnings increases with greatly improved sales revenues growth in the Dec '19 and Mar '20 comparisons versus the year ago period.
>>> FEATURED STOCK ARTICLE : Big Chip Firm Showing Strong Sales Revenues and Earnings Increases - 6/9/2020 |
View all notes |
Set NEW NOTE alert |
Company Profile |
SEC
News |
Chart |
Request a new note
C
A
S
I |
TREX
-
NYSE
Trex Company Inc
MATERIALS and CONSTRUCTION - General Building Materials
|
$120.83
|
+3.41
2.90% |
$121.50
|
619,125
60.94% of 50 DAV
50 DAV is 1,016,000
|
$132.84
-9.04%
|
5/5/2020
|
$109.05
|
PP = $111.95
|
|
MB = $117.55
|
Most Recent Note - 6/15/2020 5:48:50 PM
Y - Managed a "positive reversal" today and closed near its "max buy" level. Prior highs in the $111 area define important support to watch above its 50 DMA line ($104.27). Fundamentals remain strong.
>>> FEATURED STOCK ARTICLE : Pullback Toward Prior Highs Which Define Near-Term Support - 6/11/2020 |
View all notes |
Set NEW NOTE alert |
Company Profile |
SEC
News |
Chart |
Request a new note
C
A
S
I |
Symbol/Exchange
Company Name
Industry Group |
PRICE |
CHANGE
(%Change) |
Day High |
Volume
(% DAV)
(% 50 day avg vol) |
52 Wk Hi
% From Hi |
Featured
Date |
Price
Featured |
Pivot Featured |
|
Max Buy |
NFLX
-
NASDAQ
Netflix Inc
SPECIALTY RETAIL - Music and Video Stores
|
$436.13
|
+10.63
2.50% |
$437.96
|
5,446,199
66.92% of 50 DAV
50 DAV is 8,138,000
|
$458.97
-4.98%
|
5/14/2020
|
$441.95
|
PP = $449.62
|
|
MB = $472.10
|
Most Recent Note - 6/16/2020 6:19:46 PM
Y - Found support near its 50 DMA line ($423.26) and its color code is changed to yellow. Volume-driven gains above the pivot point may trigger a new (or add-on) technical buy signal. Any damaging losses below the 50 DMA line and prior lows would trigger a more worrisome technical sell signal.
>>> FEATURED STOCK ARTICLE : Weak Action Led to 50-Day Moving Average Violation - 6/12/2020 |
View all notes |
Set NEW NOTE alert |
Company Profile |
SEC
News |
Chart |
Request a new note
C
A
S
I |
NOW
-
NYSE
Servicenow Inc
Computer Sftwr-Enterprse
|
$398.46
|
+5.96
1.52% |
$402.87
|
1,610,941
73.12% of 50 DAV
50 DAV is 2,203,000
|
$405.53
-1.74%
|
4/30/2020
|
$343.05
|
PP = $363.05
|
|
MB = $381.20
|
Most Recent Note - 6/16/2020 6:21:44 PM
G - Posted a 3rd consecutive gain today with below average volume for its second best ever close. Recent gains above the pivot point were not backed by the +40% above average volume necessary to clinch a proper technical buy signal. Prior highs in the $362 area define initial support to watch above its 50 DMA line ($349.24).
>>> FEATURED STOCK ARTICLE : Quiet Pullback Below "Max Buy" Level for NOW - 6/4/2020 |
View all notes |
Set NEW NOTE alert |
Company Profile |
SEC
News |
Chart |
Request a new note
C
A
S
I |
TEAM
-
NASDAQ
Atlassian Corp Plc Cl A
Comp Sftwr-Spec Enterprs
|
$172.51
|
+1.78
1.04% |
$173.44
|
2,487,004
127.54% of 50 DAV
50 DAV is 1,950,000
|
$191.72
-10.02%
|
5/4/2020
|
$159.70
|
PP = $156.22
|
|
MB = $164.03
|
Most Recent Note - 6/16/2020 6:11:41 PM
G - Managed a "positive reversal" today for a gain with higher volume. Consolidating above its 50 DMA line ($165.65) which defines important near-term support above prior highs in the $156 area.
>>> FEATURED STOCK ARTICLE : Positive Reversal Near Prior High and 50 DMA Line - 6/5/2020 |
View all notes |
Set NEW NOTE alert |
Company Profile |
SEC
News |
Chart |
Request a new note
C
A
S
I |
TTD
-
NASDAQ
The Trade Desk Inc Cl A
Comml Svcs-Advertising
|
$372.03
|
+1.43
0.39% |
$379.52
|
1,761,180
79.98% of 50 DAV
50 DAV is 2,202,000
|
$373.31
-0.34%
|
6/3/2020
|
$240.61
|
PP = $327.35
|
|
MB = $343.72
|
Most Recent Note - 6/15/2020 5:50:14 PM
G - Hit a new high and managed its best-ever close today with average volume behind its big gain. Prior highs in the $327 area define important near-term support.
>>> FEATURED STOCK ARTICLE : Trade Desk Posts Powerful Gain for New High - 6/3/2020 |
View all notes |
Set NEW NOTE alert |
Company Profile |
SEC
News |
Chart |
Request a new note
C
A
S
I |
DOCU
-
NASDAQ
Docusign Inc
Computer Sftwr-Enterprse
|
$163.05
|
+0.36
0.22% |
$165.08
|
5,509,768
137.40% of 50 DAV
50 DAV is 4,010,000
|
$163.70
-0.40%
|
6/10/2020
|
$149.73
|
PP = $152.10
|
|
MB = $159.71
|
Most Recent Note - 6/16/2020 12:34:18 PM
G - Color code was changed to green after rallying above its "max buy" level on the prior session. Posted a big gain above the pivot point backed by +107% above average volume triggering a new (or add-on) technical buy signal.
>>> FEATURED STOCK ARTICLE : Advanced Ascending Base Formed for Strong E-Signature Firm - 6/10/2020 |
View all notes |
Set NEW NOTE alert |
Company Profile |
SEC
News |
Chart |
Request a new note
C
A
S
I |
Symbol/Exchange
Company Name
Industry Group |
PRICE |
CHANGE
(%Change) |
Day High |
Volume
(% DAV)
(% 50 day avg vol) |
52 Wk Hi
% From Hi |
Featured
Date |
Price
Featured |
Pivot Featured |
|
Max Buy |
PING
-
NYSE
Ping Identity Hldg Corp
Computer Sftwr-Security
|
$30.63
|
+1.85
6.43% |
$30.67
|
1,510,640
125.16% of 50 DAV
50 DAV is 1,207,000
|
$31.91
-4.01%
|
6/1/2020
|
$29.24
|
PP = $29.90
|
|
MB = $31.40
|
Most Recent Note - 6/16/2020 6:10:06 PM
Y - Color code is changed to yellow after it posted a solid gain today with +25% above average volume for its second best ever close. Subsequent gains for a new high close backed by at least +40% above average volume may help clinch a convincing technical buy signal. Found support at its 20-day moving average line ($28.44). More damaging losses below it and the prior low ($27.51 on 6/04/20) would raise greater concerns and trigger more worrisome technical sell signals.
>>> FEATURED STOCK ARTICLE : Strong Gain for New High Backed by 127% Above Average Volume - 6/1/2020 |
View all notes |
Set NEW NOTE alert |
Company Profile |
SEC
News |
Chart |
Request a new note
C
A
S
I |
AAXN
-
NASDAQ
Axon Enterprise Inc
Security/Sfty
|
$93.66
|
-6.69
-6.67% |
$100.52
|
2,339,678
227.82% of 50 DAV
50 DAV is 1,027,000
|
$104.90
-10.71%
|
5/8/2020
|
$84.86
|
PP = $90.20
|
|
MB = $94.71
|
Most Recent Note - 6/16/2020 12:20:20 PM
G - Pulling back today after proposing a new Pubic Offering, briefly trading below its "max buy" level. Prior highs in the $90-91 area have acted as support following the powerful breakout.
>>> FEATURED STOCK ARTICLE : Quietly Slumping Near 50-Day Moving Average Line - 5/28/2020 |
View all notes |
Set NEW NOTE alert |
Company Profile |
SEC
News |
Chart |
Request a new note
C
A
S
I |
GDDY
-
NYSE
Godaddy Inc Cl A
Computer Sftwr-Enterprse
|
$78.49
|
+1.07
1.38% |
$80.00
|
1,054,251
73.42% of 50 DAV
50 DAV is 1,436,000
|
$82.47
-4.83%
|
6/2/2020
|
$79.62
|
PP = $82.40
|
|
MB = $86.52
|
Most Recent Note - 6/16/2020 6:16:12 PM
Y - Posted a 3rd consecutive gain today with below average volume. Subsequent gains above the pivot point backed by at least +40% above average volume are needed to trigger a proper technical buy signal. It previously met stubborn resistance in the $82-84 area.
>>> FEATURED STOCK ARTICLE : Godaddy Could Be Ready to Go for New Highs - 6/2/2020 |
View all notes |
Set NEW NOTE alert |
Company Profile |
SEC
News |
Chart |
Request a new note
C
A
S
I |
|
|
|
THESE ARE NOT BUY RECOMMENDATIONS!
Comments contained in the body of this report are technical
opinions only. The material herein has been obtained
from sources believed to be reliable and accurate, however,
its accuracy and completeness cannot be guaranteed.
This site is not an investment advisor, hence it does
not endorse or recommend any securities or other investments.
Any recommendation contained in this report may not
be suitable for all investors and it is not to be deemed
an offer or solicitation on our part with respect to
the purchase or sale of any securities. All trademarks,
service marks and trade names appearing in this report
are the property of their respective owners, and are
likewise used for identification purposes only.
This report is a service available
only to active Paid Premium Members.
You may opt-out of receiving report notifications
at any time. Questions or comments may be submitted
by writing to Premium Membership Services 665 S.E. 10 Street, Suite 201 Deerfield Beach, FL 33441-5634 or by calling 1-800-965-8307
or 954-785-1121.
|
|
|