You are not logged in.
This means you
CAN ONLY VIEW reports that were published prior to Monday, April 14, 2025.
You
MUST UPGRADE YOUR MEMBERSHIP if you want to see any current reports.
AFTER MARKET UPDATE - THURSDAY, JUNE 12TH, 2014
Previous After Market Report Next After Market Report >>>
|
|
|
|
DOW |
-109.69 |
16,734.19 |
-0.65% |
|
Volume |
610,346,080 |
+17% |
|
Volume |
1,766,905,090 |
+7% |
|
NASDAQ |
-34.30 |
4,297.63 |
-0.79% |
|
Advancers |
1,260 |
40% |
|
Advancers |
947 |
32% |
|
S&P 500 |
-13.78 |
1,930.11 |
-0.71% |
|
Decliners |
1,791 |
57% |
|
Decliners |
1,860 |
64% |
|
Russell 2000 |
-7.31 |
1,159.40 |
-0.63% |
|
52 Wk Highs |
105 |
|
|
52 Wk Highs |
65 |
|
|
S&P 600 |
-4.60 |
665.40 |
-0.69% |
|
52 Wk Lows |
12 |
|
|
52 Wk Lows |
16 |
|
|
 |
Major Averages Fell With Higher Volume Totals
Kenneth J. Gruneisen - Passed the CAN SLIM® Master's Exam
The major averages finished lower on Thursday amid heavier profit taking pressure. The Dow Jones Industrial Average fell 110 points to 16,734. The S&P 500 lost 14 points to close at 1,930. The NASDAQ declined 34 points to 4,297. The volume was reported higher than the prior session totals on the Nasdaq exchange and on the NYSE. Decliners led advancers by almost a 3-2 margin on the NYSE and 2-1 on the Nasdaq exchange. Leadership contracted as there were only 32 high-ranked companies from the CANSLIM.net Leaders List that made new 52-week highs and appeared on the CANSLIM.net BreakOuts Page, down from the total of 42 stocks on the prior session. New 52-week highs contracted yet still easily outnumbered a small number of new 52-week lows on the NYSE and Nasdaq exchange. There were gains for 4 of the 10 high-ranked companies currently included on the Featured Stocks Page. The S&P 500 Index and Dow Jones Industrial Average recently surged into new high territory with healthy leadership (new 52-week highs) sending a reassuring signal that the market direction (M criteria) is in a "confirmed uptrend". Any new buying efforts should be selective and focused in stocks meeting all key criteria of the fact-based investment system.
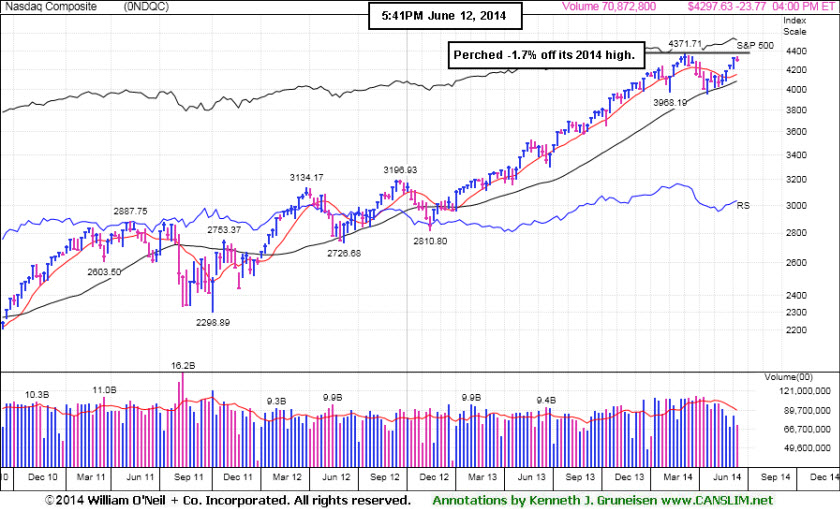
PICTURED: The Nasdaq Composite Index's weekly graph shows the tech-heavy index perched -1.7% off its 2014 high.
The major averages extended their pullback to a second day following a round of disappointing economic data. Before the open, the Commerce Department reported retail sales grew 0.3% in May, less than a projected 0.6% increase. Weekly jobless claims rose to 317,000, above the consensus estimate of 310,000. Market weakness was also attributed to concerns surrounding an uprising of Sunni militants in Iraq.
Nine of 10 sectors in the S&P 500 were down on the session. Consumer discretionary was the worst performing group paced by a decline in airline stocks including Delta (DAL -5.43%) and Southwest (LUV -4.53%). Materials also weighed on the market with coal producer CONSOL Energy (CNX -4.64%) and U.S. Steel (X -3.84%) losing. Energy was the lone sector to finish in positive territory. Shares of Diamond Offshore (DO +4.03%) and Occidental Petroleum (OXY +1.36% ) climbed as the price of crude oil rallied on the tension in the Middle East.
Treasuries advanced with the benchmark 10-year note gaining 13/32 to yield 2.59%.
The CANSLIM.net Featured Stocks Page shows the most action-worthy candidates and their latest notes and a Headline Link directs members to the latest detailed analysis with data-packed graphs annotated by a Certified expert along with links to additional resources. The Premium Member Homepage includes "dynamic archives" to all prior pay reports published. Watch for an announcement via email concerning the next WEBCAST.
|
 Kenneth J. Gruneisen started out as a licensed stockbroker in August 1987, a couple of months prior to the historic stock market crash that took the Dow Jones Industrial Average down -22.6% in a single day. He has published daily fact-based fundamental and technical analysis on high-ranked stocks online for two decades. Through FACTBASEDINVESTING.COM, Kenneth provides educational articles, news, market commentary, and other information regarding proven investment systems that work in good times and bad.
Comments contained in the body of this report are technical opinions only and are not necessarily those of Gruneisen Growth Corp. The material herein has been obtained from sources believed to be reliable and accurate, however, its accuracy and completeness cannot be guaranteed. Our firm, employees, and customers may effect transactions, including transactions contrary to any recommendation herein, or have positions in the securities mentioned herein or options with respect thereto. Any recommendation contained in this report may not be suitable for all investors and it is not to be deemed an offer or solicitation on our part with respect to the purchase or sale of any securities. |
|
 |
Rebounding Gold & Silver Index a Standout Gainer
Kenneth J. Gruneisen - Passed the CAN SLIM® Master's Exam
The Retail Index ($RLX -1.66%) was a negative influence on the major averages on Thursday. There was also a loss for the Bank Index ($BKX -0.63%) while the Broker/Dealer Index ($XBD -0.05%) held its ground. The tech sector saw modest losses from the Networking Index ($NWX -0.58%) and the Semiconductor Index ($SOX -0.34%) while the Biotechnology Index ($BTK +0.24%) eked out a small gain. Energy-linked groups including the Oil Services Index ($OSX +0.45%) and the Integrated Oil Index ($XOI +0.57%) posted modest gains, easily outpaced by another solid gain from the Gold & Silver Index ($XAU +2.31%).
Charts courtesy www.stockcharts.com
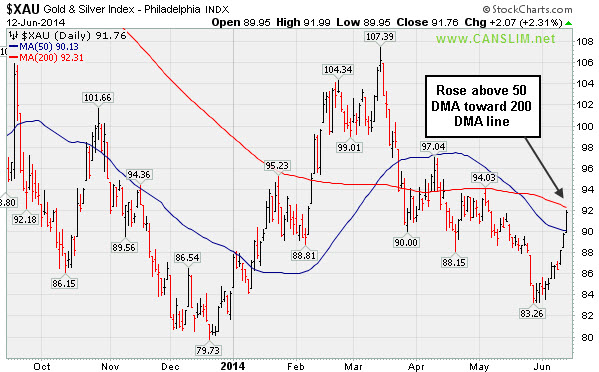
PICTURED: The Gold & Silver Index ($XAU +2.31%) was a standout gainer as it rebounded from the latest lows and rallied above its 50-day moving average (DMA) line toward its longer-term 200 DMA line.
| Oil Services |
$OSX |
296.60 |
+1.34 |
+0.45% |
+5.54% |
| Integrated Oil |
$XOI |
1,662.08 |
+9.43 |
+0.57% |
+10.57% |
| Semiconductor |
$SOX |
621.35 |
-2.13 |
-0.34% |
+16.13% |
| Networking |
$NWX |
338.67 |
-1.99 |
-0.58% |
+4.55% |
| Broker/Dealer |
$XBD |
156.11 |
-0.08 |
-0.05% |
-2.77% |
| Retail |
$RLX |
876.79 |
-14.79 |
-1.66% |
-6.70% |
| Gold & Silver |
$XAU |
91.76 |
+2.07 |
+2.31% |
+9.04% |
| Bank |
$BKX |
70.67 |
-0.45 |
-0.63% |
+2.04% |
| Biotech |
$BTK |
2,693.28 |
+6.44 |
+0.24% |
+15.57% |
|
|
|
 |
Encountered Distributional Pressure After Touching New 52-Week High
Kenneth J. Gruneisen - Passed the CAN SLIM® Master's Exam
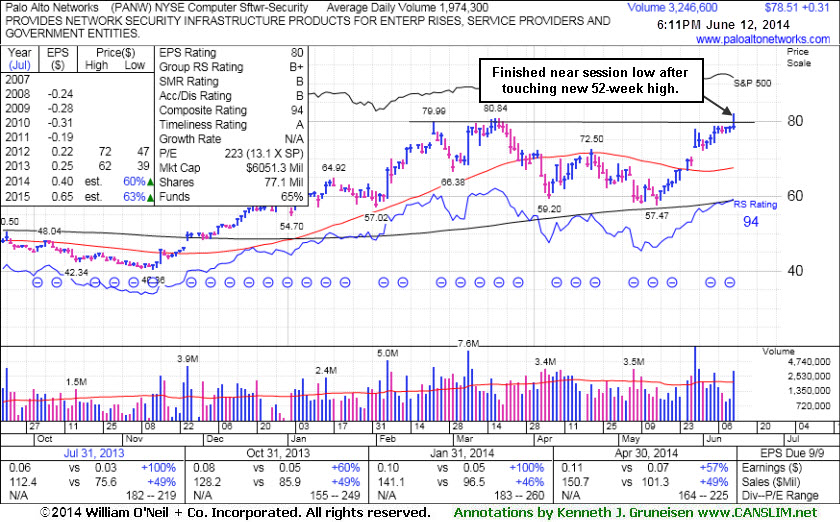
Palo Alto Networks (PANW +$0.31 or +0.40% to $78.51) hit a new 52-week high today but encountered some distributional pressure and finished near the session low with a small gain on above average volume. It is extended from the previously noted base pattern and may be likely to encounter resistance near its old 52-week high. Prior highs near $72 define important support to watch on pullbacks above its 50-day moving average (DMA) line ($67.51).
PANW was last shown in this FSU section with annotated graphs on 5/29/14 under the headline, "Finish Near Session Low Following Gap Up From Double Bottom Base". It was highlighted in yellow with pivot point cited based on its 4/22/14 high in the 5/29/14 mid-day report (read here). The gap up gain was backed by 5 times average volume as it completed a bullish "double bottom" base and triggered a technical buy signal.
Subsequent gains into new high territory (N criteria) could help it gain additional upward momentum. Keep in mind that disciplined investors avoid chasing stocks extended more than +5% above their prior high or pivot point, and they always limit losses by selling any stocks that fall more than -7% from their purchase price.
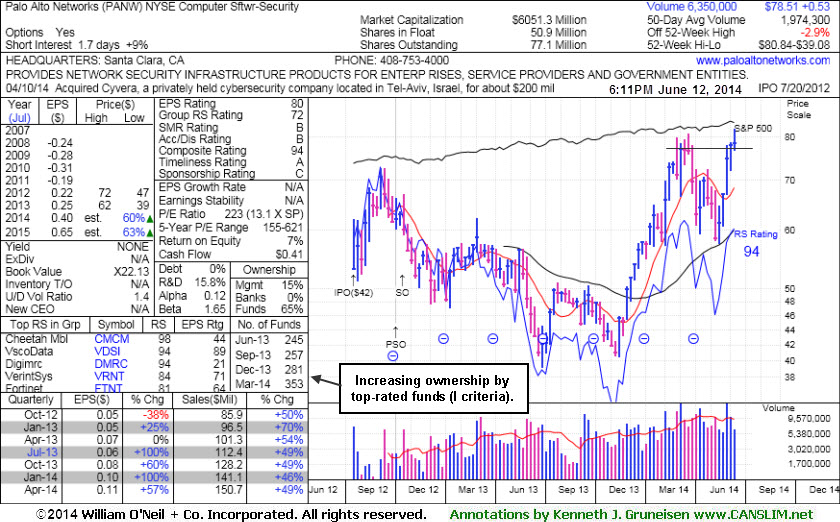
Strong sales revenues increases and earnings through the Apr '14 quarter above the +25% minimum guideline satisfy the C criteria. Its annual earnings (A criteria) history is a bit limited, but growth has been strong since its July 2012 IPO at $42. The number of top-rated funds owning its shares rose from 246 in Jun '13 to 353 in Mar '14, a reassuring sign concerning the I criteria. Its small supply (S criteria) of only 50.9 million shares in the public float is another favorable characteristic. The Computer Software - Security group currently has a B+ rating, reflecting decent leadership (L criteria) in the group.
|
|
|
Color Codes Explained :
Y - Better candidates highlighted by our
staff of experts.
G - Previously featured
in past reports as yellow but may no longer be buyable under the
guidelines.
***Last / Change / Volume data in this table is the closing quote data***
Symbol/Exchange
Company Name
Industry Group |
PRICE |
CHANGE
(%Change) |
Day High |
Volume
(% DAV)
(% 50 day avg vol) |
52 Wk Hi
% From Hi |
Featured
Date |
Price
Featured |
Pivot Featured |
|
Max Buy |
AFSI
-
NASDAQ
Amtrust Financial Svcs
INSURANCE - Property and; Casualty Insurance
|
$42.39
|
-0.15
-0.35% |
$42.84
|
211,937
31.49% of 50 DAV
50 DAV is 673,000
|
$47.10
-10.00%
|
5/21/2014
|
$44.85
|
PP = $44.85
|
|
MB = $47.09
|
Most Recent Note - 6/6/2014 6:06:33 PM
G - Consolidating above its 50 DMA line. Disciplined investors always limit losses by selling any stock that falls more than -7% from their purchase price. See the latest FSU analysis for more details and new annotated graphs.
>>> FEATURED STOCK ARTICLE : Halted Slide at 50-Day Moving Average After Distributional Pressure - 6/6/2014
View all notes |
Set NEW NOTE alert |
CANSLIM.net Company Profile |
SEC
News |
Chart |
Request a new note
C
A N
S L
I M


|
AL
-
NYSE
Air Lease Corp Cl A
DIVERSIFIED SERVICES - Rental and Leasing Services
|
$37.61
|
-3.35
-8.18% |
$40.85
|
4,610,534
533.01% of 50 DAV
50 DAV is 865,000
|
$42.89
-12.31%
|
5/9/2014
|
$38.27
|
PP = $38.25
|
|
MB = $40.16
|
 Most Recent Note - 6/12/2014 5:56:35 PM
G - Violated its 50 DMA line and triggered a technical sell signal with a damaging loss today backed by heavy volume and amid widespread losses in the industry group. Only a prompt rebound above its 50 DMA line would help its outlook improve. Disciplined investors limit losses by selling any stock that falls more than -7% from their purchase price.
>>> FEATURED STOCK ARTICLE : Enduring Mild Distributional Pressure on Pullback - 6/11/2014
View all notes |
Set NEW NOTE alert |
CANSLIM.net Company Profile |
SEC
News |
Chart |
Request a new note
C
A N
S L
I M
|
EQM
-
NYSE
E Q T Midstream Partners
ENERGY - Oil and Gas Pipelines
|
$89.99
|
+0.56
0.63% |
$90.68
|
204,928
81.00% of 50 DAV
50 DAV is 253,000
|
$91.78
-1.95%
|
12/12/2013
|
$53.17
|
PP = $56.51
|
|
MB = $59.34
|
Most Recent Note - 6/6/2014 6:18:36 PM
G - Hit yet another new 52-week high with today's 9th consecutive gain on below average volume. Fundamental concerns remain after 2 consecutive sub par quarters below the +25% minimum earnings guideline.
>>> FEATURED STOCK ARTICLE : New Highs Again With Light Volume Behind Streak of Gains - 6/4/2014
View all notes |
Set NEW NOTE alert |
CANSLIM.net Company Profile |
SEC
News |
Chart |
Request a new note
C
A N
S L
I M
|
GRFS
-
NASDAQ
Grifols Sa Ads
Medical-Ethical Drugs
|
$45.14
|
-0.55
-1.20% |
$46.13
|
545,942
79.35% of 50 DAV
50 DAV is 688,000
|
$46.66
-3.26%
|
5/15/2014
|
$41.14
|
PP = $43.55
|
|
MB = $45.73
|
Most Recent Note - 6/9/2014 6:57:47 PM
G - Color code is changed to green after finishing near the session high and above its "max buy" level with today's 5th consecutive gain on above average and ever-increasing volume. Prior highs near $43 area define near-term support to watch on pullbacks.
>>> FEATURED STOCK ARTICLE : Finding Support Above 50-Day Moving Average - 6/3/2014
View all notes |
Set NEW NOTE alert |
CANSLIM.net Company Profile |
SEC
News |
Chart |
Request a new note
C
A N
S L
I M
|
ICON
-
NASDAQ
Iconix Brand Group Inc
CONSUMER NON-DURABLES - Textile - Apparel Footwear
|
$42.75
|
-0.89
-2.04% |
$43.57
|
477,508
89.25% of 50 DAV
50 DAV is 535,000
|
$44.81
-4.60%
|
6/5/2014
|
$43.54
|
PP = $43.44
|
|
MB = $45.61
|
Most Recent Note - 6/12/2014 6:05:32 PM
Y - Pulled back today for a 3rd consecutive loss, quietly retreating from its all-time high. It stalled since triggering its latest technical buy signal. Prior highs in the $43-42 area define initial support to watch. Disciplined investors avoid chasing stocks extended more than +5% above their pivot point, and they always sell if any stock falls more than -7% from their purchase price.
>>> FEATURED STOCK ARTICLE : Gain With Above Average Volume an Encouraging Sign - 6/5/2014
View all notes |
Set NEW NOTE alert |
CANSLIM.net Company Profile |
SEC
News |
Chart |
Request a new note
C
A N
S L
I M
|
Symbol/Exchange
Company Name
Industry Group |
PRICE |
CHANGE
(%Change) |
Day High |
Volume
(% DAV)
(% 50 day avg vol) |
52 Wk Hi
% From Hi |
Featured
Date |
Price
Featured |
Pivot Featured |
|
Max Buy |
KORS
-
NYSE
Michael Kors Hldgs Ltd
RETAIL - Apparel Stores
|
$94.66
|
-0.71
-0.74% |
$95.79
|
2,589,690
95.00% of 50 DAV
50 DAV is 2,726,000
|
$101.04
-6.31%
|
5/27/2014
|
$96.70
|
PP = $101.14
|
|
MB = $106.20
|
Most Recent Note - 6/10/2014 7:13:49 PM
Y - Deterioration below its 50 DMA line would raise more concerns and trigger a technical sell signal. A breakout above the pivot point with at least +40% above average volume is needed to trigger a new technical buy signal. see the latest FSU analysis for more details and new annotated graphs.
>>> FEATURED STOCK ARTICLE : Relative Strength Line's Downward Slope a Discouraging Sign - 6/10/2014
View all notes |
Set NEW NOTE alert |
CANSLIM.net Company Profile |
SEC
News |
Chart |
Request a new note
C
A N
S L
I M
|
PANW
-
NYSE
Palo Alto Networks
Computer Sftwr-Security
|
$78.51
|
+0.31
0.40% |
$82.00
|
3,246,611
164.47% of 50 DAV
50 DAV is 1,974,000
|
$80.84
-2.88%
|
5/29/2014
|
$75.95
|
PP = $72.50
|
|
MB = $76.13
|
Most Recent Note - 6/12/2014 12:45:39 PM
G - Hit a new 52-week high today, getting more extended from the previously noted base. Prior highs near $72 define important support above its 50 DMA line.
>>> FEATURED STOCK ARTICLE : Finish Near Session Low Following Gap Up From Double Bottom Base - 5/29/2014
View all notes |
Set NEW NOTE alert |
CANSLIM.net Company Profile |
SEC
News |
Chart |
Request a new note
C
A N
S L
I M
|
SN
-
NYSE
Sanchez Energy Corp
ENERGY - Independent Oil and Gas
|
$36.32
|
+1.36
3.89% |
$36.72
|
1,615,152
128.39% of 50 DAV
50 DAV is 1,258,000
|
$35.93
1.09%
|
5/22/2014
|
$33.00
|
PP = $31.59
|
|
MB = $33.17
|
Most Recent Note - 6/12/2014 6:00:08 PM
G - Hit another new 52-week high with today's gain, getting more extended from its prior base. Announced both a $200 Million Common Stock and a $700 Million Senior Notes Offering. Prior highs near $31-32 define support to watch on pullbacks.
>>> FEATURED STOCK ARTICLE : Finished Near Session Low After Hitting new 52-Week High - 6/9/2014
View all notes |
Set NEW NOTE alert |
CANSLIM.net Company Profile |
SEC
News |
Chart |
Request a new note
C
A N
S L
I M
|
TRN
-
NYSE
Trinity Industries Inc
TRANSPORTATION - Railroads
|
$81.66
|
-0.50
-0.61% |
$82.21
|
1,483,092
95.99% of 50 DAV
50 DAV is 1,545,000
|
$87.89
-7.08%
|
4/30/2014
|
$75.57
|
PP = $76.05
|
|
MB = $79.85
|
Most Recent Note - 6/6/2014 1:05:42 PM
G - Halted its slide after 5 consecutive losses and gapped up today. Prior highs in the $75-76 area coincide with its 50 DMA line ($76.48) defining important support to watch.
>>> FEATURED STOCK ARTICLE : Extended From Prior Base After +15% Rally in One Month - 6/2/2014
View all notes |
Set NEW NOTE alert |
CANSLIM.net Company Profile |
SEC
News |
Chart |
Request a new note
C
A N
S L
I M
|
WLK
-
NYSE
Westlake Chemical Corp
CHEMICALS - Specialty Chemicals
|
$82.19
|
+0.04
0.05% |
$83.17
|
501,052
66.45% of 50 DAV
50 DAV is 754,000
|
$82.47
-0.34%
|
4/29/2014
|
$72.79
|
PP = $69.31
|
|
MB = $72.78
|
Most Recent Note - 6/11/2014 6:31:23 PM
G - Quietly hovering near its 52-week high. Prior highs near $77 define important near-term support to watch on pullbacks.
>>> FEATURED STOCK ARTICLE : Extended From Prior Base After 5 Weekly Gains - 5/30/2014
View all notes |
Set NEW NOTE alert |
CANSLIM.net Company Profile |
SEC
News |
Chart |
Request a new note
C
A N
S L
I M
|
Symbol/Exchange
Company Name
Industry Group |
PRICE |
CHANGE
(%Change) |
Day High |
Volume
(% DAV)
(% 50 day avg vol) |
52 Wk Hi
% From Hi |
Featured
Date |
Price
Featured |
Pivot Featured |
|
Max Buy |
|
|
|
THESE ARE NOT BUY RECOMMENDATIONS!
Comments contained in the body of this report are technical
opinions only. The material herein has been obtained
from sources believed to be reliable and accurate, however,
its accuracy and completeness cannot be guaranteed.
This site is not an investment advisor, hence it does
not endorse or recommend any securities or other investments.
Any recommendation contained in this report may not
be suitable for all investors and it is not to be deemed
an offer or solicitation on our part with respect to
the purchase or sale of any securities. All trademarks,
service marks and trade names appearing in this report
are the property of their respective owners, and are
likewise used for identification purposes only.
This report is a service available
only to active Paid Premium Members.
You may opt-out of receiving report notifications
at any time. Questions or comments may be submitted
by writing to Premium Membership Services 665 S.E. 10 Street, Suite 201 Deerfield Beach, FL 33441-5634 or by calling 1-800-965-8307
or 954-785-1121.
|
|
|

