You are not logged in.
This means you
CAN ONLY VIEW reports that were published prior to Wednesday, April 9, 2025.
You
MUST UPGRADE YOUR MEMBERSHIP if you want to see any current reports.
AFTER MARKET UPDATE - FRIDAY, JUNE 13TH, 2014
Previous After Market Report Next After Market Report >>>
|
|
|
|
DOW |
+41.55 |
16,775.74 |
+0.25% |
|
Volume |
563,127,580 |
-8% |
|
Volume |
1,630,063,180 |
-8% |
|
NASDAQ |
+13.02 |
4,310.65 |
+0.30% |
|
Advancers |
1,744 |
55% |
|
Advancers |
1,390 |
49% |
|
S&P 500 |
+6.05 |
1,936.16 |
+0.31% |
|
Decliners |
1,294 |
41% |
|
Decliners |
1,297 |
46% |
|
Russell 2000 |
+3.28 |
1,162.68 |
+0.28% |
|
52 Wk Highs |
104 |
|
|
52 Wk Highs |
61 |
|
|
S&P 600 |
+1.89 |
667.29 |
+0.28% |
|
52 Wk Lows |
13 |
|
|
52 Wk Lows |
19 |
|
|
 |
Major Averages Posted Small Gains With Lighter Volume Totals
Kenneth J. Gruneisen - Passed the CAN SLIM® Master's Exam
Despite Friday's advance, the Dow lost -0.9% this week and the S&P 500 fell -0.7%, snapping three-straight weeks of gains. The NASDAQ declined for the first time in five weeks, finishing with a weekly loss of -0.3%. The session's volume was reported lighter than the prior session totals on the Nasdaq exchange and on the NYSE. Advancers led decliners by almost a 3-2 margin on the NYSE but led by only a narrow margin on the Nasdaq exchange. Leadership contracted as there were only 25 high-ranked companies from the CANSLIM.net Leaders List that made new 52-week highs and appeared on the CANSLIM.net BreakOuts Page, down from the total of 32 stocks on the prior session. New 52-week highs outnumbered new 52-week lows on the NYSE and Nasdaq exchange. There were gains for 5 of the 10 high-ranked companies currently included on the Featured Stocks Page. The S&P 500 Index and Dow Jones Industrial Average recently surged into new high territory with healthy leadership (new 52-week highs) sending a reassuring signal that the market direction (M criteria) is in a "confirmed uptrend". Any new buying efforts should be selective and focused in stocks meeting all key criteria of the fact-based investment system.
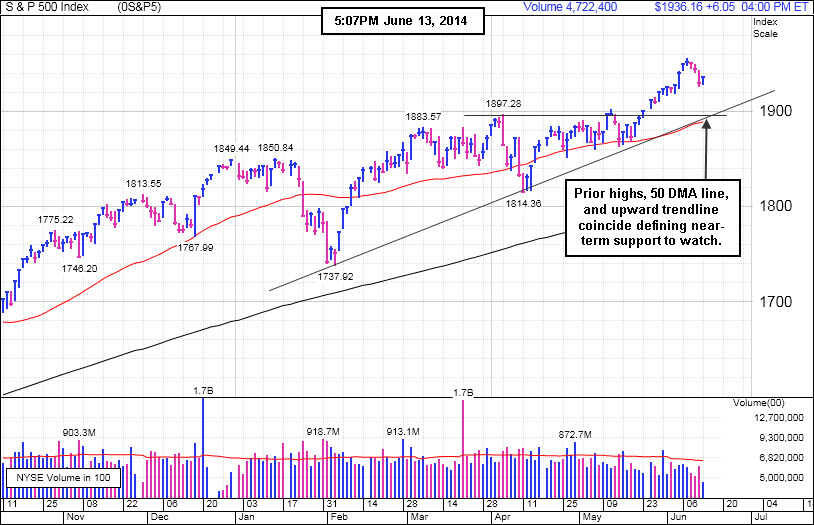
PICTURED: The S&P 500 Index gained 6 points to 1,936, consolidating well above prior highs, its 50-day moving average (DMA) line, and an upward trendline defining important support.
The major averages advanced on Friday to trim their weekly losses. The Dow rose 41 points to 16,775. The NASDAQ was up 13 points to 4,310.
Stocks climbed higher as nine of the 10 S&P 500 sectors rose. Energy paced the advance as the price of WTI crude rose amid concerns that violence in Iraq may disrupt oil supplies. Schlumberger (SLB +1.81%). Technology stocks also helped lift the market. Intel (INTC +6.83%) after the company boosted its second-quarter and full-year sales forecasts. M&A activity added to the upside. OpenTable (OPEN +48.35%) after Priceline (PCLN -2.99%) agreed to acquire the company for about $2.6 billion. On the downside, health care was the worst performing group as Merck (MRK -0.10%) edged lower.
Economic data was on the back burner. Producer prices fell last month for the first time since February while a gauge of consumer confidence declined in June to a three-month low. Treasuries were virtually unchanged. The 10-year note lost 2/32 to yield 2.60%
The CANSLIM.net Featured Stocks Page shows the most action-worthy candidates and their latest notes and a Headline Link directs members to the latest detailed analysis with data-packed graphs annotated by a Certified expert along with links to additional resources. The Premium Member Homepage includes "dynamic archives" to all prior pay reports published. Watch for an announcement via email concerning the next WEBCAST.
|
 Kenneth J. Gruneisen started out as a licensed stockbroker in August 1987, a couple of months prior to the historic stock market crash that took the Dow Jones Industrial Average down -22.6% in a single day. He has published daily fact-based fundamental and technical analysis on high-ranked stocks online for two decades. Through FACTBASEDINVESTING.COM, Kenneth provides educational articles, news, market commentary, and other information regarding proven investment systems that work in good times and bad.
Comments contained in the body of this report are technical opinions only and are not necessarily those of Gruneisen Growth Corp. The material herein has been obtained from sources believed to be reliable and accurate, however, its accuracy and completeness cannot be guaranteed. Our firm, employees, and customers may effect transactions, including transactions contrary to any recommendation herein, or have positions in the securities mentioned herein or options with respect thereto. Any recommendation contained in this report may not be suitable for all investors and it is not to be deemed an offer or solicitation on our part with respect to the purchase or sale of any securities. |
|
 |
Broker/Dealer, Technology, and Commodity-Linked Indexes Rose
Kenneth J. Gruneisen - Passed the CAN SLIM® Master's Exam
The Broker/Dealer Index ($XBD +0.50%) posted a small gain while the Bank Index ($BKX +0.06%) finished flat and the Retail Index ($RLX -0.18%) edged lower on Friday. The Semiconductor Index ($SOX +0.99%) led the tech sector higher while the Biotechnology Index ($BTK +0.51%) and the Networking Index ($NWX +0.28%) posted smaller gains. Commodity-linked groups had a positive bias as the Integrated Oil Index ($XOI +0.91%) and the Oil Services Index ($OSX +0.92%) outpaced the Gold & Silver Index ($XAU +0.59%).
Charts courtesy www.stockcharts.com
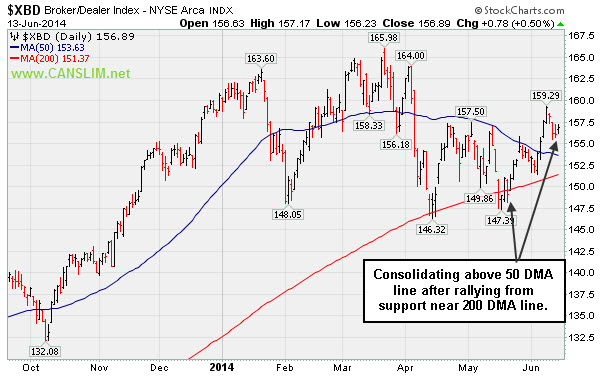
PICTURED 1: The Broker/Dealer Index ($XBD +0.50%) posted a small gain. It is consolidating above its 50-day moving average (DMA) line after finding support near its 200 DMA line.
Charts courtesy www.stockcharts.com

PICTURED 2: The Bank Index ($BKX +0.06%) is consolidating above its 50 DMA line after finding support near its 200 DMA line.
| Oil Services |
$OSX |
299.32 |
+2.72 |
+0.92% |
+6.51% |
| Integrated Oil |
$XOI |
1,677.13 |
+15.05 |
+0.91% |
+11.58% |
| Semiconductor |
$SOX |
627.49 |
+6.14 |
+0.99% |
+17.28% |
| Networking |
$NWX |
339.63 |
+0.96 |
+0.28% |
+4.84% |
| Broker/Dealer |
$XBD |
156.89 |
+0.78 |
+0.50% |
-2.28% |
| Retail |
$RLX |
875.21 |
-1.58 |
-0.18% |
-6.87% |
| Gold & Silver |
$XAU |
92.30 |
+0.54 |
+0.59% |
+9.69% |
| Bank |
$BKX |
70.71 |
+0.04 |
+0.06% |
+2.09% |
| Biotech |
$BTK |
2,707.14 |
+13.86 |
+0.51% |
+16.16% |
|
|
|
 |
Chemical Firm Quietly Posted 7th Consecutive Weekly Gain
Kenneth J. Gruneisen - Passed the CAN SLIM® Master's Exam
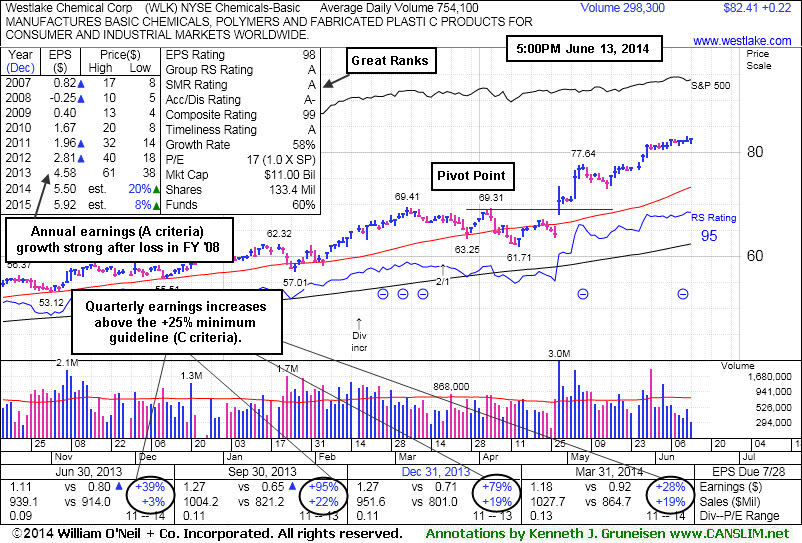
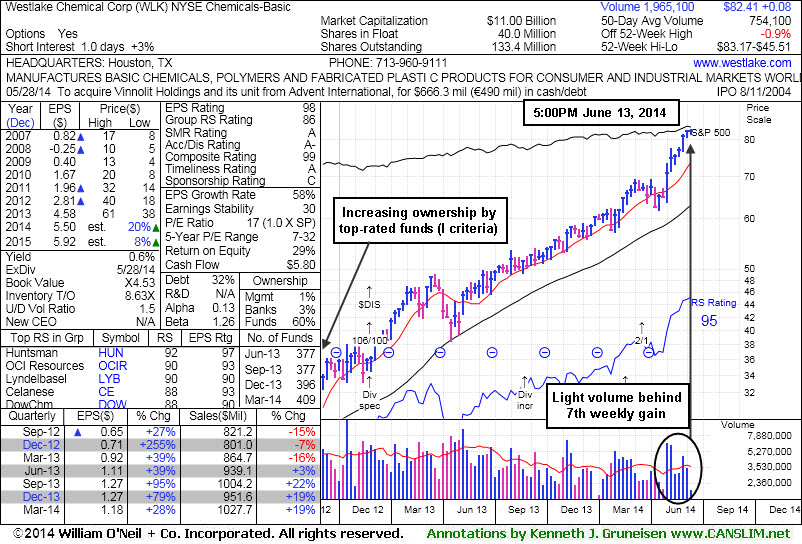
Westlake Chemical Corp (WLK +$0.22 or +0.27% to $82.41) remains quietly perched at its 52-week high. It is extended from any sound base after tallying 7 consecutive weekly gains. Very few investors have headed for the exit as the daily volume totals have been below average while it has held its ground stubbornly since last shown in this FSU section on 5/30/14 under the headline, "Extended From Prior Base After 5 Weekly Gains". Prior highs near $77 define important near-term support to watch on pullbacks. It is well above its 50-day moving average (DMA) line, the next familiar and very important support level for chart readers.
It finished Friday's session up +13.2% from when it was first featured in yellow at $72.79 rallying from a "double bottom" base in the 4/29/14 mid-day report (read here). It reported +28% earnings on +19% sales for the Mar '14 quarter, and it has earned great ranks as its quarterly earnings increases have been above the +25% minimum (C criteria). Its annual earnings growth rate (A criteria) has also been strong after a downturn in FY '08 and '09. The number of top-rated funds owning its shares rose from 381 in Sep '13 to 409 in Mar '14, a reassuring trend concerning the I criteria. The small supply of only 40 million shares (S criteria) in the public float is ideal, while it can contribute to greater price volatility in the event of new institutional buying or selling.
The Chemicals - Basic industry group has seen its Group Relative Strength rating rise from 65 to 86 since shown in this FSU section on 4/29/14 with annotated graphs under the headline, "Technical Breakout From Double Bottom Base Pattern". Strong action and leadership from others in the group is a reassuring sign concerning the L criteria.
|
|
|
Color Codes Explained :
Y - Better candidates highlighted by our
staff of experts.
G - Previously featured
in past reports as yellow but may no longer be buyable under the
guidelines.
***Last / Change / Volume data in this table is the closing quote data***
Symbol/Exchange
Company Name
Industry Group |
PRICE |
CHANGE
(%Change) |
Day High |
Volume
(% DAV)
(% 50 day avg vol) |
52 Wk Hi
% From Hi |
Featured
Date |
Price
Featured |
Pivot Featured |
|
Max Buy |
AFSI
-
NASDAQ
Amtrust Financial Svcs
INSURANCE - Property and; Casualty Insurance
|
$42.38
|
-0.01
-0.02% |
$42.71
|
281,930
42.08% of 50 DAV
50 DAV is 670,000
|
$47.10
-10.02%
|
5/21/2014
|
$44.85
|
PP = $44.85
|
|
MB = $47.09
|
 Most Recent Note - 6/13/2014 5:13:01 PM
G - Volume totals have been cooling while consolidating above its 50 DMA line which acted as support. Disciplined investors always limit losses by selling any stock that falls more than -7% from their purchase price.
>>> FEATURED STOCK ARTICLE : Halted Slide at 50-Day Moving Average After Distributional Pressure - 6/6/2014
View all notes |
Set NEW NOTE alert |
CANSLIM.net Company Profile |
SEC
News |
Chart |
Request a new note
C
A N
S L
I M


|
AL
-
NYSE
Air Lease Corp Cl A
DIVERSIFIED SERVICES - Rental and Leasing Services
|
$37.95
|
+0.34
0.90% |
$38.16
|
2,988,100
315.53% of 50 DAV
50 DAV is 947,000
|
$42.89
-11.52%
|
5/9/2014
|
$38.27
|
PP = $38.25
|
|
MB = $40.16
|
Most Recent Note - 6/13/2014 12:05:54 PM
G - Rebounded from early lows back into positive territory. On the prior session its 50 DMA line violation triggered a technical sell signal as it suffered a damaging loss backed by heavy volume amid widespread losses in the industry group. Only a prompt rebound above its 50 DMA line would help its outlook improve. Disciplined investors limit losses by selling any stock that falls more than -7% from their purchase price.
>>> FEATURED STOCK ARTICLE : Enduring Mild Distributional Pressure on Pullback - 6/11/2014
View all notes |
Set NEW NOTE alert |
CANSLIM.net Company Profile |
SEC
News |
Chart |
Request a new note
C
A N
S L
I M
|
EQM
-
NYSE
E Q T Midstream Partners
ENERGY - Oil and Gas Pipelines
|
$94.47
|
+4.48
4.98% |
$96.35
|
1,062,589
416.70% of 50 DAV
50 DAV is 255,000
|
$91.78
2.93%
|
12/12/2013
|
$53.17
|
PP = $56.51
|
|
MB = $59.34
|
Most Recent Note - 6/13/2014 12:19:22 PM
G - Hitting yet another new 52-week high with today's considerable gain on heavy volume. It is very extended from any sound base. Fundamental concerns remain after 2 consecutive sub par quarters below the +25% minimum earnings guideline.
>>> FEATURED STOCK ARTICLE : New Highs Again With Light Volume Behind Streak of Gains - 6/4/2014
View all notes |
Set NEW NOTE alert |
CANSLIM.net Company Profile |
SEC
News |
Chart |
Request a new note
C
A N
S L
I M
|
GRFS
-
NASDAQ
Grifols Sa Ads
Medical-Ethical Drugs
|
$44.67
|
-0.47
-1.04% |
$45.04
|
391,224
56.86% of 50 DAV
50 DAV is 688,000
|
$46.66
-4.26%
|
5/15/2014
|
$41.14
|
PP = $43.55
|
|
MB = $45.73
|
Most Recent Note - 6/13/2014 5:59:46 PM
Y - Color code is changed to yellow after a 4th consecutive loss today on lighter volume led to a close below its "max buy" level. Prior highs near $43 area define near-term support to watch on pullbacks.
>>> FEATURED STOCK ARTICLE : Finding Support Above 50-Day Moving Average - 6/3/2014
View all notes |
Set NEW NOTE alert |
CANSLIM.net Company Profile |
SEC
News |
Chart |
Request a new note
C
A N
S L
I M
|
ICON
-
NASDAQ
Iconix Brand Group Inc
CONSUMER NON-DURABLES - Textile - Apparel Footwear
|
$42.75
|
+0.00
0.00% |
$43.06
|
355,811
67.01% of 50 DAV
50 DAV is 531,000
|
$44.81
-4.60%
|
6/5/2014
|
$43.54
|
PP = $43.44
|
|
MB = $45.61
|
Most Recent Note - 6/12/2014 6:05:32 PM
Y - Pulled back today for a 3rd consecutive loss, quietly retreating from its all-time high. It stalled since triggering its latest technical buy signal. Prior highs in the $43-42 area define initial support to watch. Disciplined investors avoid chasing stocks extended more than +5% above their pivot point, and they always sell if any stock falls more than -7% from their purchase price.
>>> FEATURED STOCK ARTICLE : Gain With Above Average Volume an Encouraging Sign - 6/5/2014
View all notes |
Set NEW NOTE alert |
CANSLIM.net Company Profile |
SEC
News |
Chart |
Request a new note
C
A N
S L
I M
|
Symbol/Exchange
Company Name
Industry Group |
PRICE |
CHANGE
(%Change) |
Day High |
Volume
(% DAV)
(% 50 day avg vol) |
52 Wk Hi
% From Hi |
Featured
Date |
Price
Featured |
Pivot Featured |
|
Max Buy |
KORS
-
NYSE
Michael Kors Hldgs Ltd
RETAIL - Apparel Stores
|
$93.90
|
-0.76
-0.80% |
$95.00
|
2,355,641
85.94% of 50 DAV
50 DAV is 2,741,000
|
$101.04
-7.07%
|
5/27/2014
|
$96.70
|
PP = $101.14
|
|
MB = $106.20
|
Most Recent Note - 6/13/2014 6:03:53 PM
Y - Still consolidating above its 50 DMA line where a subsequent violation would raise concerns and trigger a technical sell signal. A breakout above the pivot point with at least +40% above average volume is needed to trigger a new technical buy signal.
>>> FEATURED STOCK ARTICLE : Relative Strength Line's Downward Slope a Discouraging Sign - 6/10/2014
View all notes |
Set NEW NOTE alert |
CANSLIM.net Company Profile |
SEC
News |
Chart |
Request a new note
C
A N
S L
I M
|
PANW
-
NYSE
Palo Alto Networks
Computer Sftwr-Security
|
$78.80
|
+0.29
0.37% |
$79.50
|
1,098,559
54.96% of 50 DAV
50 DAV is 1,999,000
|
$82.00
-3.90%
|
5/29/2014
|
$75.95
|
PP = $72.50
|
|
MB = $76.13
|
Most Recent Note - 6/12/2014 6:31:56 PM
G - Encountered distributional pressure after touching a new 52-week high today. Prior highs near $72 define important support above its 50 DMA line. See the latest FSU analysis for more details and new annotated graphs.
>>> FEATURED STOCK ARTICLE : Encountered Distributional Pressure After Touching New 52-Week High - 6/12/2014
View all notes |
Set NEW NOTE alert |
CANSLIM.net Company Profile |
SEC
News |
Chart |
Request a new note
C
A N
S L
I M
|
SN
-
NYSE
Sanchez Energy Corp
ENERGY - Independent Oil and Gas
|
$36.39
|
+0.07
0.19% |
$36.70
|
5,571,912
434.63% of 50 DAV
50 DAV is 1,282,000
|
$36.72
-0.90%
|
5/22/2014
|
$33.00
|
PP = $31.59
|
|
MB = $33.17
|
Most Recent Note - 6/13/2014 12:49:07 PM
G - Perched at its 52-week high today, extended from its prior base. Disciplined investors avoid chasing extended stocks. Prior highs near $31-32 define support to watch on pullbacks. Priced the recently announced offering of Common Stock and Senior Notes.
>>> FEATURED STOCK ARTICLE : Finished Near Session Low After Hitting new 52-Week High - 6/9/2014
View all notes |
Set NEW NOTE alert |
CANSLIM.net Company Profile |
SEC
News |
Chart |
Request a new note
C
A N
S L
I M
|
TRN
-
NYSE
Trinity Industries Inc
TRANSPORTATION - Railroads
|
$81.37
|
-0.29
-0.36% |
$81.65
|
1,563,471
100.48% of 50 DAV
50 DAV is 1,556,000
|
$87.89
-7.41%
|
4/30/2014
|
$75.57
|
PP = $76.05
|
|
MB = $79.85
|
Most Recent Note - 6/13/2014 5:16:26 PM
G - Stubbornly holding its ground well above prior highs in the $76 area and above its 50 DMA line ($77.54) defining important support to watch.
>>> FEATURED STOCK ARTICLE : Extended From Prior Base After +15% Rally in One Month - 6/2/2014
View all notes |
Set NEW NOTE alert |
CANSLIM.net Company Profile |
SEC
News |
Chart |
Request a new note
C
A N
S L
I M
|
WLK
-
NYSE
Westlake Chemical Corp
CHEMICALS - Specialty Chemicals
|
$82.41
|
+0.22
0.27% |
$82.77
|
298,309
39.56% of 50 DAV
50 DAV is 754,000
|
$83.17
-0.91%
|
4/29/2014
|
$72.79
|
PP = $69.31
|
|
MB = $72.78
|
Most Recent Note - 6/13/2014 5:56:43 PM
G - Quietly hovering near its 52-week high. Prior highs near $77 define important near-term support to watch on pullbacks. See the latest FSU analysis for more details and new annotated graphs.
>>> FEATURED STOCK ARTICLE : Chemical Firm Quietly Posted 7th Consecutive Weekly Gain - 6/13/2014
View all notes |
Set NEW NOTE alert |
CANSLIM.net Company Profile |
SEC
News |
Chart |
Request a new note
C
A N
S L
I M
|
Symbol/Exchange
Company Name
Industry Group |
PRICE |
CHANGE
(%Change) |
Day High |
Volume
(% DAV)
(% 50 day avg vol) |
52 Wk Hi
% From Hi |
Featured
Date |
Price
Featured |
Pivot Featured |
|
Max Buy |
|
|
|
THESE ARE NOT BUY RECOMMENDATIONS!
Comments contained in the body of this report are technical
opinions only. The material herein has been obtained
from sources believed to be reliable and accurate, however,
its accuracy and completeness cannot be guaranteed.
This site is not an investment advisor, hence it does
not endorse or recommend any securities or other investments.
Any recommendation contained in this report may not
be suitable for all investors and it is not to be deemed
an offer or solicitation on our part with respect to
the purchase or sale of any securities. All trademarks,
service marks and trade names appearing in this report
are the property of their respective owners, and are
likewise used for identification purposes only.
This report is a service available
only to active Paid Premium Members.
You may opt-out of receiving report notifications
at any time. Questions or comments may be submitted
by writing to Premium Membership Services 665 S.E. 10 Street, Suite 201 Deerfield Beach, FL 33441-5634 or by calling 1-800-965-8307
or 954-785-1121.
|
|
|

