You are not logged in.
This means you
CAN ONLY VIEW reports that were published prior to Monday, April 14, 2025.
You
MUST UPGRADE YOUR MEMBERSHIP if you want to see any current reports.
AFTER MARKET UPDATE - FRIDAY, JUNE 12TH, 2009
Previous After Market Report Next After Market Report >>>
|
|
|
|
DOW |
+28.34 |
8,799.26 |
+0.32% |
|
Volume |
857,810,990 |
-30% |
|
Volume |
2,086,757,220 |
-18% |
|
NASDAQ |
-3.57 |
1,858.80 |
-0.19% |
|
Advancers |
1,369 |
44% |
|
Advancers |
1,266 |
44% |
|
S&P 500 |
+1.32 |
946.21 |
+0.14% |
|
Decliners |
1,623 |
52% |
|
Decliners |
1,463 |
51% |
|
Russell 2000 |
+0.75 |
526.83 |
+0.14% |
|
52 Wk Highs |
13 |
|
|
52 Wk Highs |
25 |
|
|
S&P 600 |
-0.10 |
276.60 |
-0.04% |
|
52 Wk Lows |
2 |
|
|
52 Wk Lows |
4 |
|
|
 |
Dow Up For 2009 As Major Averages Post 4th Consecutive Weekly Gains
Adam Sarhan, Contributing Writer,
The major averages ended with gains for their 4th week in a row, continuing the current 14-week rally effort that has now boosted the benchmark S&P 500 Index to a seven-month high. However, volume totals have been lackluster of late, whereas it is a better sign to see above average volume backing up the market's gains. On Friday, advancers were slightly outnumbered by decliners on the Nasdaq exchange and on the NYSE. The session's volume totals were reported lighter than the prior session on the NYSE and Nasdaq exchange, which was a sign that institutional investors were not accumulating shares. There were also only 3 high-ranked companies from the CANSLIM.net Leaders List that made a new 52-week high and appeared on the CANSLIM.net BreakOuts Page, lower than the 10 issues that appeared on the prior session. A further expansion in the new highs list would offer encouraging news for growth oriented investors.
On Monday, stocks closed mixed after McDonalds (MCD +1.20%) said same store sales rose +5.1% last month which topped the Street's view of +4.2%. Later in the day, Apple Inc. (AAPL -2.13%) announced a handful of upgrades to its existing product line. The company said they are going to release a new version of their very popular iPhone. The new version, 3GS, will be less expensive and faster. The added "S," stands for speed. In addition, the company updated its MacBook Pro line with a built in battery that will last +40% longer than current batteries. The stock spent the rest of the week trading lower on above average volume.
On Tuesday, stocks ended ended higher after the government allowed several banks to repay TARP funds. Treasury Secretary Timothy Geithner released a statement that said "These repayments are an encouraging sign of financial repair." He also acknowledged that "we still have work to do.” The latest data shows that US banks have raised more than $100 billion since the government stress tests were announced. In other news, the benchmark S&P 500 index currently has a price/earnings (P/E) ratio around 14.8 which is not low on a historical basis. The average p/e ratio for the past decade has been 19.9. Prior bear market lows P/E ratios have hovered near 10 or the low teen's.
On Wednesday, the major averages ended lower, suffering a distribution day, after the Fed released its Beige Book. Before Wednesday's opening bell Home Depot (HD -0.33%) raised guidance for the rest of the year which sent futures prices nicely higher. However, the buying enthusiasm quickly waned and shortly after the opening bell the market slid into negative territory. The 10 year Treasury yield jumped over +4% which was the highest rate this year. On Wednesday, the government sold $19 billion to large fund managers, sovereign wealth funds, foreign central banks, and other buyers. That was the second of three auctions this week that will raise $65 billion as the government tries to finance its record spending. Shortly after 2pm EST the Federal Reserve released its Beige Book which showed that the economic slump may be declining in nearly half its regions.
On Thursday, The major averages jumped above resistance on Thursday, sending the S&P 500 to a fresh 2009 high, after another successful auction from the Treasury Department and a batch of stronger-than-expected economic data was released. The Labor Department reported that initial unemployment claims slid to 601,000 last week. This was the lowest reading since January and supports last month's smaller-than-expected layoffs. A separate report showed that US retail sales rose in May for the first time in three months which suggests that the economy continues to recover. In other new's Bank of America Corp's (BAC +5.78%) CEO, Ken Lewis, testified in Washington about the bank's purchase of Merrill Lynch last September. Lewis was grilled by several congressmen and was asked if he felt pressured to buy the ailing investment bank.
On Friday, the market averages ended mixed. Consumer confidence reportedly rose for a fourth consecutive month. The Reuters/University of Michigan preliminary index of consumer sentiment rose to 69, which was lower than the Street's estimate, but it was still the highest level in nine months. In recent weeks we have seen job losses slow and series of stronger than expected economic data which suggests that the worst of the recession is behind us. Remember to stay tuned to the market and closely watch leading stocks. As long as the major averages continue trading above support the bulls remain in control.
Money Management Services - TAKE CONTROL OF YOUR PORTFOLIO- Open An Account today!
After remaining in cash from May 2008-May 2009, our portfolio managers began buying stocks earlier this month and are already sitting on some solid gains. To inquire about having your account professionally managed using this fact-based investment system click HERE. *Accounts over $250,000 please. ** Serious inquiries only.
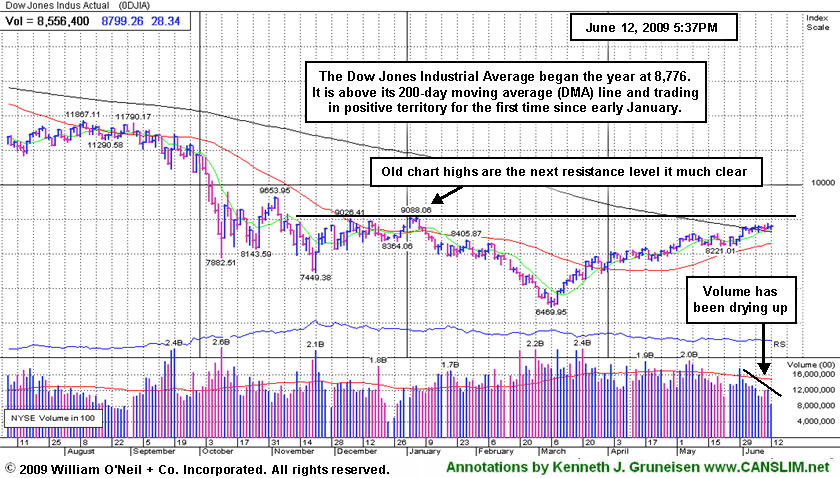
PICTURED: The Dow Jones Indistrial Average has rallied, for the first time since early January, into positive territory for the year. Volume has been drying up, and it faces its next important resistance level (9,088) at prior chart highs.
|
|
|
 |
Financial and Retail Indices Offset Weakness Elsewhere
Kenneth J. Gruneisen - Passed the CAN SLIM® Master's Exam
Modest gains from the influential Bank ($BKX +1.13%) and Broker/Dealer ($XBD +1.39%) indexes, and the Retail Index ($RLX +0.75%), helped offset weaker action elsewhere on Friday. Commodity-linked areas backpedaled as the Gold & Silver ($XAU -3.05%), Oil Services ($OSX -2.53%), and Integrated Oil ($XOI -1.29%) indexes were among the session's laggards. The Semiconductor Index ($SOX -1.77%) was the weakest of the tech indices while the Biotechnology Index ($BTK -0.79%) suffered a smaller loss and the Networking ($NWX -0.15%) and Internet ($IIX -0.08%) indexes barely finished in the red. The Healthcare ($HMO -0.44%) group also inched lower.
Charts courtesy www.stockcharts.com
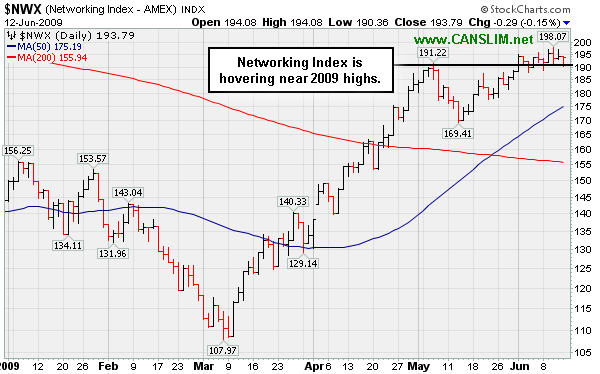
PICTURED: The Networking Index ($NWX -0.15%)is hovering near 2009 highs.
| Oil Services |
$OSX |
183.94 |
-4.78 |
-2.53% |
+51.53% |
| Healthcare |
$HMO |
1,027.92 |
-4.53 |
-0.44% |
+7.05% |
| Integrated Oil |
$XOI |
988.76 |
-12.94 |
-1.29% |
+0.93% |
| Semiconductor |
$SOX |
274.79 |
-4.95 |
-1.77% |
+29.51% |
| Networking |
$NWX |
193.79 |
-0.29 |
-0.15% |
+34.68% |
| Internet |
$IIX |
194.06 |
-0.15 |
-0.08% |
+45.07% |
| Broker/Dealer |
$XBD |
103.43 |
+1.42 |
+1.39% |
+33.51% |
| Retail |
$RLX |
332.07 |
+2.47 |
+0.75% |
+18.91% |
| Gold & Silver |
$XAU |
145.12 |
-4.56 |
-3.05% |
+17.17% |
| Bank |
$BKX |
38.62 |
+0.43 |
+1.13% |
-12.86% |
| Biotech |
$btk |
683.44 |
-5.46 |
-0.79% |
+5.60% |
|
|
|
 |
Sinking RS Rating Indicates Mediocre Price Performance
Kenneth J. Gruneisen - Passed the CAN SLIM® Master's Exam
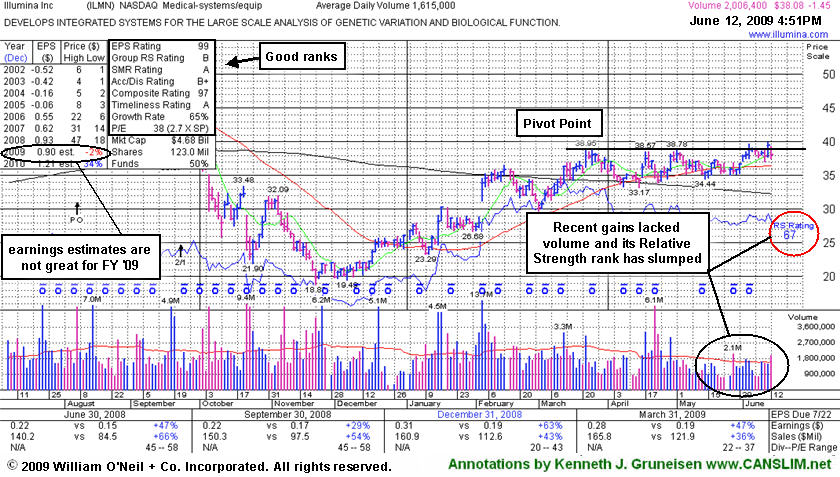
Illumina Inc (ILMN -$1.45 or -2.46% to $38.08) encountered distributional pressure today. Unimpressive volume totals behind recent gains are clear evidence that institutional investors were unmoved, even after news this week that the company began offering a new high-quality personal genome sequencing for consumers (read here). And as recently noted, this stock's Relative Strength (RS) rank has slumped well below the 80+ guideline (currently 67). Its RS rank was 88 when it was first featured featured in the May 2009 issue of CANSLIM.net News (read here). That rank fell off as it continued consolidating and failed to produce confirming gains above its pivot point to trigger a proper technical buy signal since featured. Historic examples of the market's biggest winners typically showed better relative strength, and their relative strength lines (the jagged blue line) usually spiked to new highs ahead of, or while the stock was making new highs.
Its prior chart high on March 23rd plus ten cents is the basis for its $39.05 pivot point and $41.00 maximum buy price cited in earlier reports. This Medical Systems/Equipment firm has shown solid quarterly sales revenues and earnings increases that satisfy the C criteria, and its annual earnings (the A criteria) growth history has improved in recent years. Another concern, along with its waning relative strength rating, is that Street estimates for its FY '09 are calling for earnings -2% versus the prior year. Technically, deterioration under its 50-day moving average line and recent chart low ($34.44) would raise more serious concerns and could trigger sell signals.
|
|
|
Color Codes Explained :
Y - Better candidates highlighted by our
staff of experts.
G - Previously featured
in past reports as yellow but may no longer be buyable under the
guidelines.
***Last / Change / Volume quote data in this table corresponds with the timestamp on the note***
Symbol/Exchange
Company Name
Industry Group |
Last |
Chg. |
Vol
% DAV |
Date Featured |
Price Featured |
Latest Pivot Point
Featured |
Status |
| Latest Max Buy Price |
GMCR
- NASDAQ
Green Mtn Coffee Roastrs
FOOD & BEVERAGE - Processed & Packaged Goods
|
$60.43
|
N/A
|
N/A
N/A
|
1/1/2008
(Date
Featured) |
$27.13
(Price
Featured) |
PP = $28.66 |
G |
| MB = $30.09 |
Most Recent Note - 6/12/2009
G - Quietly consolidating -5% off all-time highs. Do not be confused by the 3:2 stock split effective 6/09/09. GMCR has traded up more than +144% since appearing with an annotated graph under the headline "It May Soon Be Time To Go Green" when featured in the January 2009 CANSLIM.net News (read here). It is now easier than ever to review prior coverage on current high-ranked leaders via CANSLIM.net's revamped Featured Stock Profile pages. Simply click the company name or links to Company Profile. Thanks to the support of CANSLIM.net's active members, more improvements are coming soon!
>>> The latest Featured Stock Update with an annotated graph appeared on 6/8/2009. click here.
|
|
C
A
S
I |
News |
Chart |
SEC
View all notes Alert
me of new notes
Company
Profile
|
HMSY
- NASDAQ
H M S Holdings Corp
COMPUTER SOFTWARE & SERVICES - Healthcare Information Service
|
$36.82
|
N/A
|
N/A
N/A
|
2/20/2009
(Date
Featured) |
$34.08
(Price
Featured) |
PP = $38.38 |
Y |
| MB = $40.30 |
Most Recent Note - 6/12/2009 4:53:18 PM
Y - This week a new pivot point and max buy price were noted, however gains with sufficient volume are still needed to confirm a proper technical buy signal. It has been quietly consolidating in a tight range near all-time highs since gapping up on 6/01/09. No overhead supply is left to hinder the progress for this Commercial Services - Healthcare firm.
>>> The latest Featured Stock Update with an annotated graph appeared on 6/11/2009. click here.
|
|
C
A
S
I |
News |
Chart |
SEC
View all notes Alert
me of new notes
Company
Profile
|
ILMN
- NASDAQ
Illumina Inc
DRUGS - Biotechnology
|
$37.95
|
N/A
|
N/A
N/A
|
5/3/2009
(Date
Featured) |
$38.14
(Price
Featured) |
PP = $39.05 |
G |
| MB = $41.00 |
Most Recent Note - 6/12/2009 4:00:24 PM
G - Distributional pressure today raises concerns after the prior session's gain on below average volume for a new 2009 high close. Color code is changed to green due to sluggish action. After consolidating above its 50 DMA line in a very tight trading range for more than 3 months, its Relative Strength rank has slumped to 63, raising concerns. Recently featured in the May 2009 issue of CANSLIM.net News (read here).
>>> The latest Featured Stock Update with an annotated graph appeared on 6/12/2009. click here.
|
|
C
A
S
I |
News |
Chart |
SEC
View all notes Alert
me of new notes
Company
Profile
|
LFT
-
|
$27.87
|
N/A
|
N/A
N/A
|
4/2/2009
(Date
Featured) |
$22.19
(Price
Featured) |
PP = $21.81 |
G |
| MB = $22.90 |
Most Recent Note - 6/12/2009 4:02:19 PM
G - Loss today on heavy volume is a sign of more worrisome distributional pressure, and it tested it 50 DMA line again at its intra-day low. Hit a new 52-week high on 6/05/09 as it rose from a choppy (improper) base pattern. Its progress could be hindered by future share offerings. Its 5/28/09 gap up and considerable gain followed another strong quarterly financial report. Prompt repair of its recent 50 DMA line violation, and its gap up, were noted as signs of solid institutional (the I criteria) support and buying demand. This Chinese Computer Software firm recently filed a registration of approximately 16 million shares for resale, and it also revealed a planned acquisition of another Chinese service provider.
>>> The latest Featured Stock Update with an annotated graph appeared on 6/4/2009. click here.
|
|
C
A
S
I |
News |
Chart |
SEC
View all notes Alert
me of new notes
Company
Profile
|
NTES
- NASDAQ
Netease Inc Adr
INTERNET - Internet Information Providers
|
$35.61
|
N/A
|
N/A
N/A
|
5/21/2009
(Date
Featured) |
$31.19
(Price
Featured) |
PP = $32.75 |
G |
| MB = $34.39 |
Most Recent Note - 6/12/2009 4:03:43 PM
G - Gapped down for a second day in a row while encountering distributional pressure. It is extended from its second-stage base, and prior chart highs and its 50 DMA line (both near $32) are an important support level to watch on pullbacks. Its 5/28/09 gap up and considerable gain with +79% above average volume confirmed a technical buy signal as it rose above its pivot point. Indications of institutional (the I criteria) buying demand have been noted after earnings news on 5/20/09 a shakeout tested support near its 50 DMA line. First featured at $26.75 in the 3/31/09 CANSLIM.net Mid-Day Breakouts Report (read here). This high-ranked Chinese Internet - Content firm was also summarized in greater detail including an annotated graph in the April 2009 issue of CANSLIM.net News (read here).
>>> The latest Featured Stock Update with an annotated graph appeared on 6/5/2009. click here.
|
|
C
A
S
I |
News |
Chart |
SEC
View all notes Alert
me of new notes
Company
Profile
|
NVEC
- NASDAQ
N V E Corp
ELECTRONICS - Semiconductor - Specialized
|
$42.39
|
N/A
|
N/A
N/A
|
3/13/2009
(Date
Featured) |
$33.85
(Price
Featured) |
PP = $39.01 |
G |
| MB = $40.96 |
Most Recent Note - 6/12/2009 4:11:51 PM
G - Consolidating after quietly hitting a new 52-week high this week. It recently found support at its 50 DMA line. Earnings per share rose +38% over the year ago period, yet sales were up just +14% and still rather minuscule.
>>> The latest Featured Stock Update with an annotated graph appeared on 6/9/2009. click here.
|
|
C
A
S
I |
News |
Chart |
SEC
View all notes Alert
me of new notes
Company
Profile
|
SNDA
-
|
$57.31
|
N/A
|
N/A
N/A
|
5/31/2009
(Date
Featured) |
$57.62
(Price
Featured) |
PP = $53.95 |
G |
| MB = $56.65 |
Most Recent Note - 6/12/2009 4:14:29 PM
G - Considerable loss today with above average volume. It is too extended from a sound base to be considered buyable under the investment system's guidelines. Patient investors may watch for a pullback near prior chart highs, or its 50 DMA line, an important support level which has not been tested since breaking out in March. Detailed analysis was included when recently featured in the June 2009 issue of CANSLIM.net News. Be sure to review the "What to Look Out For" section and entire detailed summary - read here).
>>> The latest Featured Stock Update with an annotated graph appeared on 6/3/2009. click here.
|
|
C
A
S
I |
News |
Chart |
SEC
View all notes Alert
me of new notes
Company
Profile
|
SYNA
- NASDAQ
Synaptics Inc
COMPUTER SOFTWARE & SERVICES - Information Technology Service
|
$38.25
|
N/A
|
N/A
N/A
|
5/18/2009
(Date
Featured) |
$32.58
(Price
Featured) |
PP = $34.52 |
G |
| MB = $36.25 |
Most Recent Note - 6/12/2009 4:16:10 PM
G - Consolidating since a considerable gain on 6/09/09 with twice average volume. Near all-time highs, $41 is a mostly psychological resistance level, since there is little overhead supply. First featured in yellow in the May 18, 2009 mid-day report (read here). The number of top-rated funds owning its shares rose from 123 in June '08 to 188 in March '09, which is good news concerning the I criteria. Its annual earnings (the A criteria) history showed a dowturn in 2006, leaving concerns, but it followed that up with strong growth the next 2 years. Its small supply of shares (the S criteria) outstanding could contribute to especially great volatility in the event of institutional accumulation or distribution.
>>> The latest Featured Stock Update with an annotated graph appeared on 6/1/2009. click here.
|
|
C
A
S
I |
News |
Chart |
SEC
View all notes Alert
me of new notes
Company
Profile
|
TNDM
- NASDAQ
Tandem Diabetes Care Inc
TELECOMMUNICATIONS - Wireless Communications
|
$25.31
|
N/A
|
N/A
N/A
|
3/2/2009
(Date
Featured) |
$18.89
(Price
Featured) |
PP = $29.85 |
G |
| MB = $31.34 |
Most Recent Note - 6/12/2009 4:19:10 PM
G - Halted its steep slide Friday after triggering a technical sell signal by violating its 50 DMA line over the course of 3 days of heavy distribution in the past week. It completely negated its latest technical breakout, and its color code was changed to green based on its deterioration. A sound base needs to form before new buying efforts might be justified under the investment system's guidelines. Impressive "positive reversal" on 5/14/09 was noted as a sign of prompt institutional support arriving. Gapped up on 4/30/09 for a new all-time high after reporting solid quarterly sales and earnings increases. Traded up as much as +72.42% since first featured at $18.89 in the 3/02/09 Mid-Day BreakOuts Report (read here).
>>> The latest Featured Stock Update with an annotated graph appeared on 6/10/2009. click here.
|
|
C
A
S
I |
News |
Chart |
SEC
View all notes Alert
me of new notes
Company
Profile
|
|
|
|
THESE ARE NOT BUY RECOMMENDATIONS!
Comments contained in the body of this report are technical
opinions only. The material herein has been obtained
from sources believed to be reliable and accurate, however,
its accuracy and completeness cannot be guaranteed.
This site is not an investment advisor, hence it does
not endorse or recommend any securities or other investments.
Any recommendation contained in this report may not
be suitable for all investors and it is not to be deemed
an offer or solicitation on our part with respect to
the purchase or sale of any securities. All trademarks,
service marks and trade names appearing in this report
are the property of their respective owners, and are
likewise used for identification purposes only.
This report is a service available
only to active Paid Premium Members.
You may opt-out of receiving report notifications
at any time. Questions or comments may be submitted
by writing to Premium Membership Services 665 S.E. 10 Street, Suite 201 Deerfield Beach, FL 33441-5634 or by calling 1-800-965-8307
or 954-785-1121.
|
|
|


