You are not logged in.
This means you
CAN ONLY VIEW reports that were published prior to Tuesday, April 15, 2025.
You
MUST UPGRADE YOUR MEMBERSHIP if you want to see any current reports.
AFTER MARKET UPDATE - THURSDAY, JUNE 11TH, 2009
Previous After Market Report Next After Market Report >>>
|
|
|
|
DOW |
+31.90 |
8,770.92 |
+0.37% |
|
Volume |
1,222,786,560 |
+0% |
|
Volume |
2,530,048,350 |
+4% |
|
NASDAQ |
+9.29 |
1,862.37 |
+0.50% |
|
Advancers |
1,868 |
60% |
|
Advancers |
1,760 |
61% |
|
S&P 500 |
+5.74 |
944.89 |
+0.61% |
|
Decliners |
1,175 |
38% |
|
Decliners |
971 |
34% |
|
Russell 2000 |
+2.37 |
526.08 |
+0.45% |
|
52 Wk Highs |
16 |
|
|
52 Wk Highs |
46 |
|
|
S&P 600 |
-0.03 |
276.70 |
-0.01% |
|
52 Wk Lows |
2 |
|
|
52 Wk Lows |
6 |
|
|
 |
Nasdaq Composite and S&P 500 Index Lead Major Averages to New 2009 Highs
Adam Sarhan, Contributing Writer,
The major averages quietly attempted to work their way above near-term resistance on Thursday, and the S&P 500 Index touched a new 2009 high against the backdrop of another successful auction from the Treasury Department and a batch of stronger-than-expected economic data. Advancers led decliners by approximately a 2-to-1 ratio on the Nasdaq exchange and by approximately a 3-to-2 ratio on the NYSE. Volume totals were reported slightly higher than the prior session on the NYSE and Nasdaq exchange, which was a bit worrisome considering the major averages ended near their session lows. Interestingly, there were only 10 high-ranked companies from the CANSLIM.net Leaders List that made a new 52-week high and appeared on the CANSLIM.net BreakOuts Page, lower than the 19 issues that appeared on the prior session. A continued expansion in the new highs list would offer encouraging news for growth oriented investors.
Early Thursday morning, the market received a batch of positive economic news. The Labor Department reported that initial unemployment claims slid to 601,000 last week. This was the lowest reading since January and supports last month's smaller-than-expected layoffs. A separate report showed that US retail sales rose in May for the first time in three months which suggests that the economy continues to recover. The US dollar resumed its free fall which helped lift a slew of commodities and the stock market. For a detailed analysis of the US dollar's relationship to both commodities and US equities please read last Wednesday's, June 3, 2009's CANSLIM.net Market Commentary (read here).
In other news, Bank of America Corp's (BAC +8.26%) CEO, Ken Lewis, testified in Washington about the bank's purchase of Merrill Lynch last September. Lewis was grilled by several congressmen and was asked if he felt pressured to buy the ailing investment bank. Obviously, Lewis was put in a very precarious situation, since he is currently still employed and regulated by the same forces (The Fed and the Treasury). Do you think he would be able to speak openly and honestly about what actually happened, knowing that he remains at the mercy of the exact same organizations? As the saying goes: "If it weren't so sad, it would be funny."
It was encouraging to see the major averages claw their way above resistance and the Nasdaq Composite and S&P 500 Indexes reach fresh 2009 highs on Thursday! It is especially encouraging to see the major averages remain constructive as they advance in a healthy fashion. Since the major averages broke above resistance last Monday, June 1, 2009, this column has repeatedly mentioned how prior resistance levels should now act as support. To the market's credit, this is exactly what has occurred, which suggests that the bulls remain in control. Again, leadership remains relatively light on a historical basis, but it pays to stick with what is working and avoid what isn't. A great resource to find high-ranked stocks that are hitting new 52-week highs on any given day is CANSLIM.net's Breakouts Page (here).
Money Management Services - TAKE CONTROL OF YOUR PORTFOLIO- Open An Account today!
After remaining in cash from May 2008 - May 2009, portfolio managers using this fact-based investment system recently began buying stocks. Clients are already holding some positions (just purchased earlier this month) with +20% gains. To inquire about having your account professionally managed using this fact-based investment system click HERE. *Accounts over $250,000 please. ** Serious inquiries only.
PICTURED: The S&P 500 Index hit a new 2009 high before pulling back and closing below resistance at the high end of its current base-on-base pattern.
|
|
|
 |
Oil Services Index Charges to New 2009 Highs
Kenneth J. Gruneisen - Passed the CAN SLIM® Master's Exam
Weakness in the Retail Index ($RLX -1.81%), a sluggish Healthcare ($HMO -1.30%) group, and a loss for the Semiconductor Index ($SOX -1.22%) largely offset gains in other group on Thursday. Financial shares had a positive influence as the Bank Index ($BKX +2.55%) outpaced the Broker/Dealer Index ($XBD +0.96%). The Biotechnology Index ($BTK +2.59%) led the tech sector while there were only modest gains from the Networking ($NWX +0.32%) and Internet ($IIX +0.67%) indexes. The Gold & Silver Index ($XAU -0.28%) ended slightly lower while the Integrated Oil Index ($XOI +0.81%) posted a modest gain.
Charts courtesy www.stockcharts.com
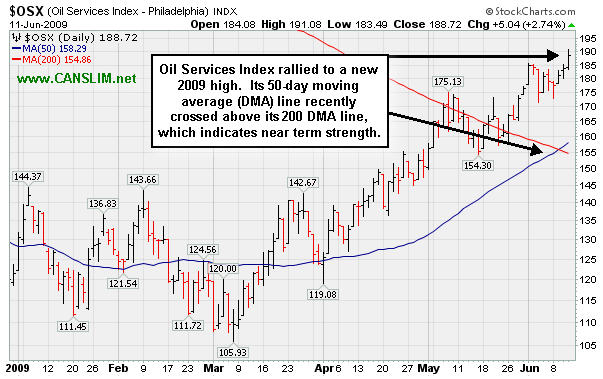
PICTURED: The Oil Services Index ($OSX +2.74%) was a standout among commodity-linked groups as it rallied to a new 2009 high. Its 50-day moving average (DMA) line recently crossed above its 200 DMA line, which also indicates near-term strength.
| Oil Services |
$OSX |
188.72 |
+5.04 |
+2.74% |
+55.47% |
| Healthcare |
$HMO |
1,032.45 |
-13.64 |
-1.30% |
+7.53% |
| Integrated Oil |
$XOI |
1,001.70 |
+8.05 |
+0.81% |
+2.25% |
| Semiconductor |
$SOX |
279.74 |
-3.46 |
-1.22% |
+31.85% |
| Networking |
$NWX |
194.08 |
+0.61 |
+0.32% |
+34.88% |
| Internet |
$IIX |
194.21 |
+1.30 |
+0.67% |
+45.18% |
| Broker/Dealer |
$XBD |
102.01 |
+0.97 |
+0.96% |
+31.68% |
| Retail |
$RLX |
329.60 |
-6.08 |
-1.81% |
+18.03% |
| Gold & Silver |
$XAU |
149.68 |
-0.42 |
-0.28% |
+20.86% |
| Bank |
$BKX |
38.19 |
+0.95 |
+2.55% |
-13.83% |
| Biotech |
$BTK |
688.90 |
+17.38 |
+2.59% |
+6.45% |
|
|
|
 |
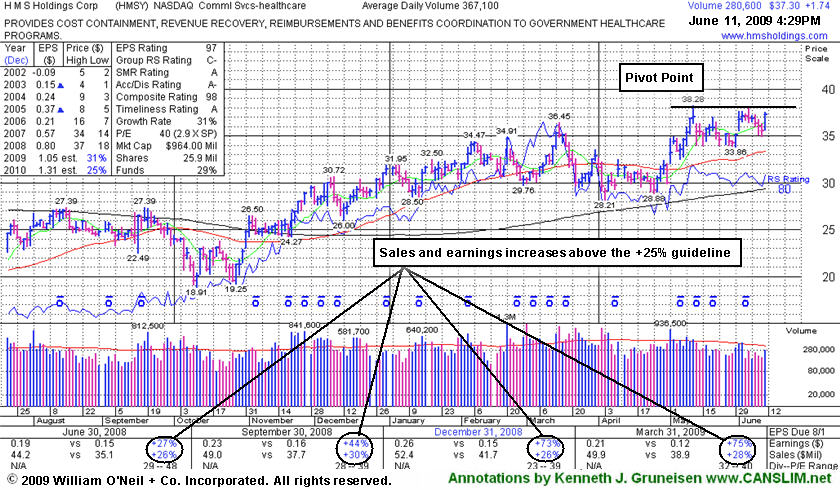
Buidling An Orderly Flat Base
Kenneth J. Gruneisen - Passed the CAN SLIM® Master's Exam
HMS Holdings Corp (HMSY +$1.74 or +4.89% to $37.30) ended today's session at a new high close after it posted a decent gain on light volume. It traded toward the high end of a near 5-week flat base above its 50-day moving average line, during which volume totals have been drying up. A new pivot point and max buy price were noted. Gains with sufficient volume are still needed to confirm a proper technical buy signal. The Commercial Services - Healthcare firm rallied to a 52-week high on 5/12/09, but it failed to produce gains with the volume needed to trigger a very convincing "breakout" or proper technical buy signal under the investment system's guidelines. Gains above a stock's pivot point need at least the minimum +50% above average volume, ideally much more volume, to meet the guidelines for buyable breakouts. Volume is a critical component to any breakout. Only when volume surges meaningfully behind a breakout from a sound base pattern do investors have the very important proof of heavy institutional (the I criteria) buying demand.
A downturn in 2006 earnings is a fundamental flaw in HMS Holdings Corp's annual earnings history that raises some concerns with respect to the A criteria of the investment system. Investors' odds are usually better with a company that has a steady 3-5 year earnings growth history. Technically, it is within close striking distance of all-time highs, and there is a chance HMSY might trigger a buy signal. This stock was first featured on Friday, February 20, 2009 in the CANSLIM.net Mid Day Breakouts Report (read here), then dropped from the Featured Stocks list on 4/02/09 due to weak action, returning yet again in yellow in the mid-day report on 5/01/09.
|
|
|
Color Codes Explained :
Y - Better candidates highlighted by our
staff of experts.
G - Previously featured
in past reports as yellow but may no longer be buyable under the
guidelines.
***Last / Change / Volume quote data in this table corresponds with the timestamp on the note***
Symbol/Exchange
Company Name
Industry Group |
Last |
Chg. |
Vol
% DAV |
Date Featured |
Price Featured |
Latest Pivot Point
Featured |
Status |
| Latest Max Buy Price |
GMCR
- NASDAQ
Green Mtn Coffee Roastrs
FOOD & BEVERAGE - Processed & Packaged Goods
|
$61.60
|
N/A
|
N/A
N/A
|
1/1/2008
(Date
Featured) |
$27.13
(Price
Featured) |
PP = $28.66 |
G |
| MB = $30.09 |
Most Recent Note - 6/11/2009
G - Quietly holding its ground -3% off all-time highs. Do not be confused by the 3:2 stock split effective 6/09/09. GMCR has traded up more than +144% since appearing with an annotated graph under the headline "It May Soon Be Time To Go Green" when featured in the January 2009 CANSLIM.net News (read here). It is now easier than ever to review prior coverage on current high-ranked leaders via CANSLIM.net's revamped Featured Stock Profile pages. Simply click the company name or links to Company Profile. Thanks to the support of CANSLIM.net's active members, more improvements are coming soon!
>>> The latest Featured Stock Update with an annotated graph appeared on 6/8/2009. click here.
|
|
C
A
S
I |
News |
Chart |
SEC
View all notes Alert
me of new notes
Company
Profile
|
HMSY
- NASDAQ
H M S Holdings Corp
COMPUTER SOFTWARE & SERVICES - Healthcare Information Service
|
$37.30
|
N/A
|
N/A
N/A
|
2/20/2009
(Date
Featured) |
$34.08
(Price
Featured) |
PP = $38.38 |
Y |
| MB = $40.30 |
Most Recent Note - 6/11/2009 4:42:58 PM
Y - Today a new pivot point and max buy price are noted. Gains with sufficient volume are still needed to confirm a proper technical buy signal. It has been quietly consolidating in a tight range near all-time highs since gapping up on 6/01/09. No overhead supply is left to hinder the progress for this Commercial Services - Healthcare firm.
>>> The latest Featured Stock Update with an annotated graph appeared on 6/11/2009. click here.
|
|
C
A
S
I |
News |
Chart |
SEC
View all notes Alert
me of new notes
Company
Profile
|
ILMN
- NASDAQ
Illumina Inc
DRUGS - Biotechnology
|
$39.53
|
N/A
|
N/A
N/A
|
5/3/2009
(Date
Featured) |
$38.14
(Price
Featured) |
PP = $39.05 |
Y |
| MB = $41.00 |
Most Recent Note - 6/11/2009 4:55:17 PM
Y - Gain today with below average volume for a new 2009 high close. After consolidating above its 50 DMA line in a very tight trading range for more than 3 months, its Relative Strength rank has slumped to 63, raising concerns. Recently featured in the May 2009 issue of CANSLIM.net News (read here).
>>> The latest Featured Stock Update with an annotated graph appeared on 5/29/2009. click here.
|
|
C
A
S
I |
News |
Chart |
SEC
View all notes Alert
me of new notes
Company
Profile
|
LFT
-
|
$29.16
|
N/A
|
N/A
N/A
|
4/2/2009
(Date
Featured) |
$22.19
(Price
Featured) |
PP = $21.81 |
G |
| MB = $22.90 |
Most Recent Note - 6/11/2009 4:57:25 PM
G - Small loss today on higher volume was a sign of distributional pressure. Hit a new 52-week high on 6/05/09 as it rose from a choppy (improper) base pattern. Its progress could be hindered by future share offerings. Its 5/28/09 gap up and considerable gain followed another strong quarterly financial report. Prompt repair of its recent 50 DMA line violation, and its gap up, were noted as signs of solid institutional (the I criteria) support and buying demand. This Chinese Computer Software firm recently filed a registration of approximately 16 million shares for resale, and it also revealed a planned acquisition of another Chinese service provider.
>>> The latest Featured Stock Update with an annotated graph appeared on 6/4/2009. click here.
|
|
C
A
S
I |
News |
Chart |
SEC
View all notes Alert
me of new notes
Company
Profile
|
NTES
- NASDAQ
Netease Inc Adr
INTERNET - Internet Information Providers
|
$36.70
|
N/A
|
N/A
N/A
|
5/21/2009
(Date
Featured) |
$31.19
(Price
Featured) |
PP = $32.75 |
G |
| MB = $34.39 |
Most Recent Note - 6/11/2009 2:21:12 PM
G - Small gap down today and loss with higher volume indicates distributional pressure. It is extended from its second-stage base, and prior chart highs and its 50 DMA line (both near $32) are an important support level to watch on pullbacks. Its 5/28/09 gap up and considerable gain with +79% above average volume confirmed a technical buy signal as it rose above its pivot point. Indications of institutional (the I criteria) buying demand have been noted after earnings news on 5/20/09 a shakeout tested support near its 50 DMA line. First featured at $26.75 in the 3/31/09 CANSLIM.net Mid-Day Breakouts Report (read here). This high-ranked Chinese Internet - Content firm was also summarized in greater detail including an annotated graph in the April 2009 issue of CANSLIM.net News (read here).
>>> The latest Featured Stock Update with an annotated graph appeared on 6/5/2009. click here.
|
|
C
A
S
I |
News |
Chart |
SEC
View all notes Alert
me of new notes
Company
Profile
|
NVEC
- NASDAQ
N V E Corp
ELECTRONICS - Semiconductor - Specialized
|
$43.25
|
N/A
|
N/A
N/A
|
3/13/2009
(Date
Featured) |
$33.85
(Price
Featured) |
PP = $39.01 |
G |
| MB = $40.96 |
Most Recent Note - 6/11/2009 5:06:46 PM
G - Consolidating after quietly hitting a new 52-week high this week. It recently found support at its 50 DMA line. Earnings per share rose +38% over the year ago period, yet sales were up just +14% and still rather minuscule.
>>> The latest Featured Stock Update with an annotated graph appeared on 6/9/2009. click here.
|
|
C
A
S
I |
News |
Chart |
SEC
View all notes Alert
me of new notes
Company
Profile
|
SNDA
-
|
$61.25
|
N/A
|
N/A
N/A
|
5/31/2009
(Date
Featured) |
$57.62
(Price
Featured) |
PP = $53.95 |
G |
| MB = $56.65 |
Most Recent Note - 6/11/2009 2:26:17 PM
G - Pulling back on lighter volume, but it is still too extended from a sound base to be considered buyable under the investment system's guidelines. Patient investors may watch for a pullback near its 50 DMA line, an important support level which has not been tested since breaking out in March. Detailed analysis was included when recently featured in the June 2009 issue of CANSLIM.net News. Be sure to review the "What to Look Out For" section and entire detailed summary - read here).
>>> The latest Featured Stock Update with an annotated graph appeared on 6/3/2009. click here.
|
|
C
A
S
I |
News |
Chart |
SEC
View all notes Alert
me of new notes
Company
Profile
|
SYNA
- NASDAQ
Synaptics Inc
COMPUTER SOFTWARE & SERVICES - Information Technology Service
|
$40.66
|
N/A
|
N/A
N/A
|
5/18/2009
(Date
Featured) |
$32.58
(Price
Featured) |
PP = $34.52 |
G |
| MB = $36.25 |
Most Recent Note - 6/11/2009 4:18:24 PM
G - Held its ground since a considerable gain on 6/09/09 with twice average volume, approaching its all-time highs near $41, a mostly psychological resistance level, since there is little overhead supply. First featured in yellow in the May 18, 2009 mid-day report (read here). The number of top-rated funds owning its shares rose from 123 in June '08 to 188 in March '09, which is good news concerning the I criteria. Its annual earnings (the A criteria) history showed a dowturn in 2006, leaving concerns, but it followed that up with strong growth the next 2 years. Its small supply of shares (the S criteria) outstanding could contribute to especially great volatility in the event of institutional accumulation or distribution.
>>> The latest Featured Stock Update with an annotated graph appeared on 6/1/2009. click here.
|
|
C
A
S
I |
News |
Chart |
SEC
View all notes Alert
me of new notes
Company
Profile
|
TNDM
- NASDAQ
Tandem Diabetes Care Inc
TELECOMMUNICATIONS - Wireless Communications
|
$24.94
|
N/A
|
N/A
N/A
|
3/2/2009
(Date
Featured) |
$18.89
(Price
Featured) |
PP = $29.85 |
G |
| MB = $31.34 |
Most Recent Note - 6/11/2009 4:20:13 PM
G - Down again considerably today, triggering a technical sell signal by violating and closing under its 50 DMA line with this week's third dose of heavy distribution. It completely negated its latest technical breakout, and its color code was changed to green based on its deterioration. A sound base needs to form before new buying efforts might be justified under the investment system's guidelines. Impressive "positive reversal" on 5/14/09 was noted as a sign of prompt institutional support arriving. Gapped up on 4/30/09 for a new all-time high after reporting solid quarterly sales and earnings increases. Traded up as much as +72.42% since first featured at $18.89 in the 3/02/09 Mid-Day BreakOuts Report (read here).
>>> The latest Featured Stock Update with an annotated graph appeared on 6/10/2009. click here.
|
|
C
A
S
I |
News |
Chart |
SEC
View all notes Alert
me of new notes
Company
Profile
|
|
|
|
THESE ARE NOT BUY RECOMMENDATIONS!
Comments contained in the body of this report are technical
opinions only. The material herein has been obtained
from sources believed to be reliable and accurate, however,
its accuracy and completeness cannot be guaranteed.
This site is not an investment advisor, hence it does
not endorse or recommend any securities or other investments.
Any recommendation contained in this report may not
be suitable for all investors and it is not to be deemed
an offer or solicitation on our part with respect to
the purchase or sale of any securities. All trademarks,
service marks and trade names appearing in this report
are the property of their respective owners, and are
likewise used for identification purposes only.
This report is a service available
only to active Paid Premium Members.
You may opt-out of receiving report notifications
at any time. Questions or comments may be submitted
by writing to Premium Membership Services 665 S.E. 10 Street, Suite 201 Deerfield Beach, FL 33441-5634 or by calling 1-800-965-8307
or 954-785-1121.
|
|
|


