You are not logged in.
This means you
CAN ONLY VIEW reports that were published prior to Monday, April 14, 2025.
You
MUST UPGRADE YOUR MEMBERSHIP if you want to see any current reports.
AFTER MARKET UPDATE - WEDNESDAY, JUNE 11TH, 2014
Previous After Market Report Next After Market Report >>>
|
|
|
|
DOW |
-102.04 |
16,843.88 |
-0.60% |
|
Volume |
520,239,520 |
-5% |
|
Volume |
1,653,319,690 |
-0% |
|
NASDAQ |
-6.07 |
4,331.93 |
-0.14% |
|
Advancers |
1,150 |
36% |
|
Advancers |
1,056 |
38% |
|
S&P 500 |
-6.90 |
1,943.89 |
-0.35% |
|
Decliners |
1,898 |
60% |
|
Decliners |
1,648 |
59% |
|
Russell 2000 |
-6.00 |
1,166.71 |
-0.51% |
|
52 Wk Highs |
104 |
|
|
52 Wk Highs |
77 |
|
|
S&P 600 |
-3.67 |
670.00 |
-0.54% |
|
52 Wk Lows |
7 |
|
|
52 Wk Lows |
15 |
|
|
 |
Major Averages Retreated With Lighter Volume Totals
Kenneth J. Gruneisen - Passed the CAN SLIM® Master's Exam
The major averages finished lower on Wednesday amid a round of profit taking. The volume was reported lighter than the prior session totals on the Nasdaq exchange and on the NYSE. Decliners led advancers by more than a 3-2 margin on the NYSE and on the Nasdaq Exchange. There were 42 high-ranked companies from the CANSLIM.net Leaders List that made new 52-week highs and appeared on the CANSLIM.net BreakOuts Page, down from the total of 55 stocks on the prior session. New 52-week highs contracted yet still easily outnumbered new 52-week lows on the NYSE and Nasdaq exchange. There were gains for 5 of the 10 high-ranked companies currently included on the Featured Stocks Page. The S&P 500 Index and Dow Jones Industrial Average have surged into new high territory. The healthy leadership (new 52-week highs) is a reassuring signal that the market direction (M criteria) is in a "confirmed uptrend". Any new buying efforts should be selective and focused in stocks meeting all key criteria of the fact-based investment system.
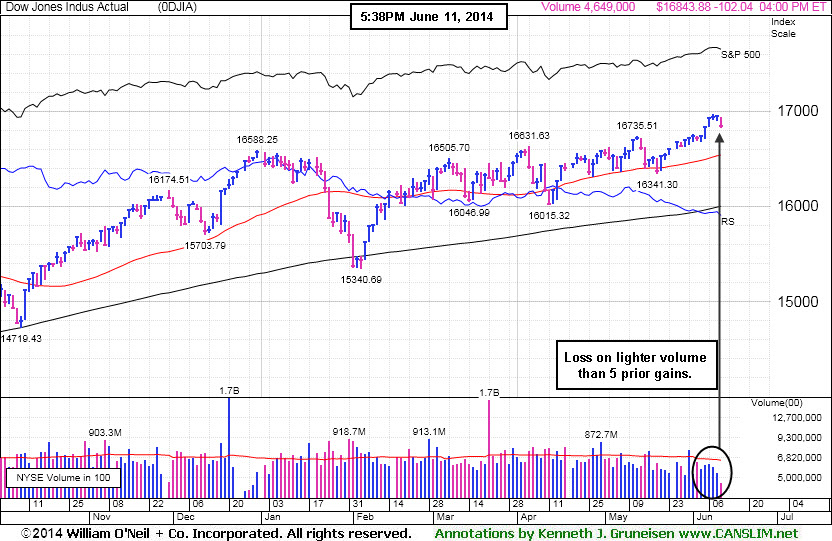
PICTURED: The Dow Joners Industrial Average suffered a loss on lighter volume than 5 prior gains.
The Dow snapped a five-day winning streak as it declined 102 points from an all-time high to close at 16,843. The S&P 500 fell nearly 7 points to 1,943. The NASDAQ lost 6 points to 4,331.
News that the World Bank cut its global growth forecast to 2.8% from 3.2% prompted investors to take a breather from this year's rally. Economic data was limited to the monthly U.S. budget statement which showed the budget deficit shrank more than 6% from a year earlier to $130 billion in May.
Overall, nine of the 10 S&P 500 sectors declined. Utilities and financials paced the retreat as Exelon (EXC -3.6%) and Bank of America (BAC -2%) fell. Industrials also weighed on the market, led by Boeing's (BA -2.3%) drop. Energy was the sole group to finish higher with Anadarko Petroleum (APC +4.2%) and Exxon Mobil (XOM +0.6%) rising.
Treasuries advanced for the first time in four sessions and the government sold $21 billion in 10-year notes. The 10-year note gained 3/32 to yield 2.63%. The 30-year bond increased 10/32 to 3.46%.
The CANSLIM.net Featured Stocks Page shows the most action-worthy candidates and their latest notes and a Headline Link directs members to the latest detailed analysis with data-packed graphs annotated by a Certified expert along with links to additional resources. The Premium Member Homepage includes "dynamic archives" to all prior pay reports published. Watch for an announcement via email concerning the next WEBCAST.
|
 Kenneth J. Gruneisen started out as a licensed stockbroker in August 1987, a couple of months prior to the historic stock market crash that took the Dow Jones Industrial Average down -22.6% in a single day. He has published daily fact-based fundamental and technical analysis on high-ranked stocks online for two decades. Through FACTBASEDINVESTING.COM, Kenneth provides educational articles, news, market commentary, and other information regarding proven investment systems that work in good times and bad.
Comments contained in the body of this report are technical opinions only and are not necessarily those of Gruneisen Growth Corp. The material herein has been obtained from sources believed to be reliable and accurate, however, its accuracy and completeness cannot be guaranteed. Our firm, employees, and customers may effect transactions, including transactions contrary to any recommendation herein, or have positions in the securities mentioned herein or options with respect thereto. Any recommendation contained in this report may not be suitable for all investors and it is not to be deemed an offer or solicitation on our part with respect to the purchase or sale of any securities. |
|
 |
Financials Created a Slight Drag on Market
Kenneth J. Gruneisen - Passed the CAN SLIM® Master's Exam
The Broker/Dealer Index ($XBD -1.23%) and the Bank Index ($BKX -0.91%) suffered losses as financial shares were a negative influence on the major averages Wednesday. The Semiconductor Index ($SOX +0.52%) rose while the Networking Index ($NWX -0.46%) and the Biotechnology Index ($BTK -0.17%) finished lower. The Gold & Silver Index ($XAU +1.71%) posted a solid gain. Energy-related shares were mixed as the Integrated Oil Index ($XOI +0.59%) edged higher and the Oil Services Index ($OSX -0.33%) finished with a small loss. The Retail Index ($RLX -0.23%) edged lower.
Charts courtesy www.stockcharts.com
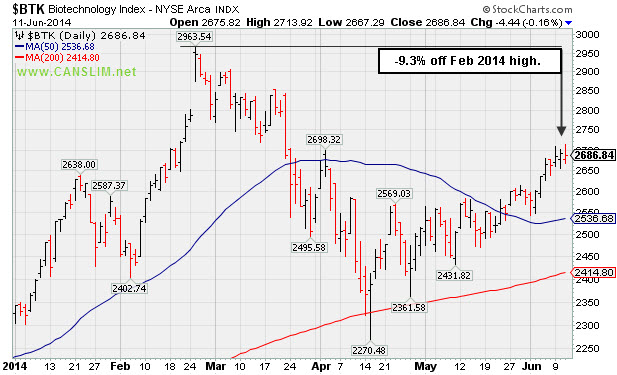
PICTURED: The Biotechnology Index ($BTK -0.17%) is consolidating -9.3% off its February 2014 high.
| Oil Services |
$OSX |
295.26 |
-0.98 |
-0.33% |
+5.06% |
| Integrated Oil |
$XOI |
1,652.66 |
+9.72 |
+0.59% |
+9.95% |
| Semiconductor |
$SOX |
623.48 |
+3.22 |
+0.52% |
+16.53% |
| Networking |
$NWX |
340.66 |
-1.57 |
-0.46% |
+5.16% |
| Broker/Dealer |
$XBD |
156.18 |
-1.94 |
-1.23% |
-2.72% |
| Retail |
$RLX |
891.58 |
-2.10 |
-0.23% |
-5.13% |
| Gold & Silver |
$XAU |
89.69 |
+1.51 |
+1.71% |
+6.58% |
| Bank |
$BKX |
71.12 |
-0.65 |
-0.91% |
+2.69% |
| Biotech |
$BTK |
2,686.84 |
-4.44 |
-0.17% |
+15.29% |
|
|
|
 |
Enduring Mild Distributional Pressure on Pullback
Kenneth J. Gruneisen - Passed the CAN SLIM® Master's Exam
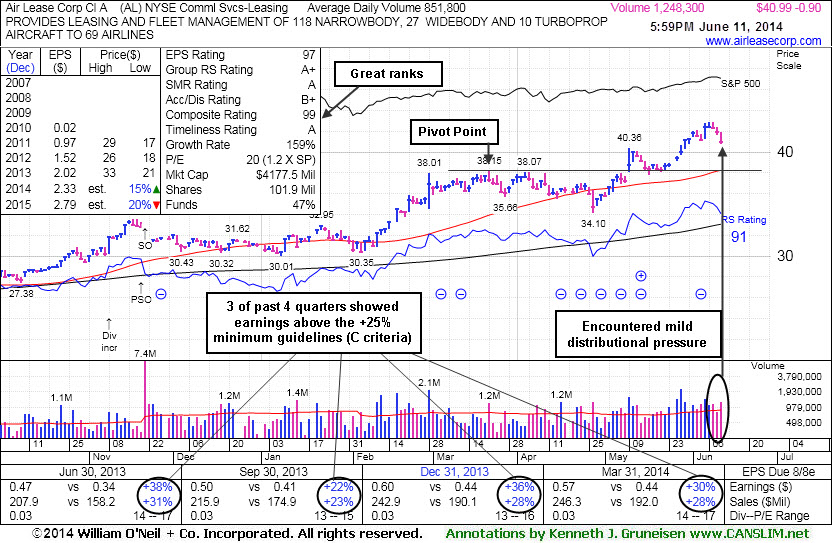
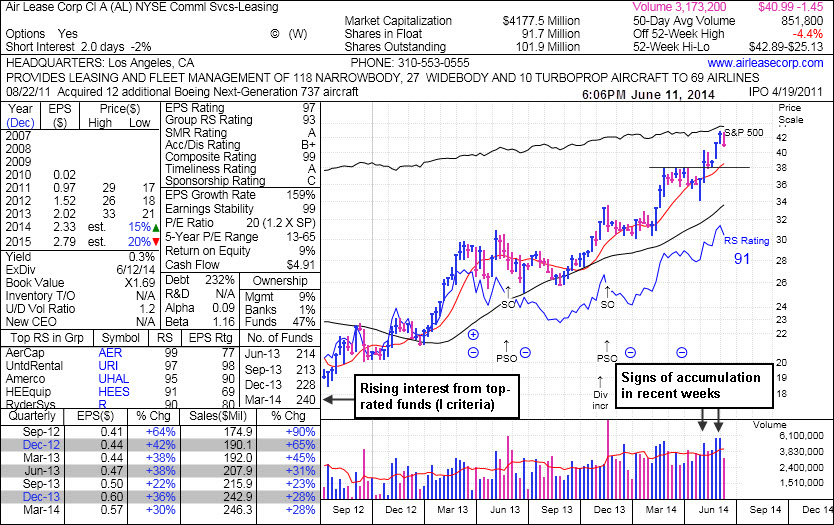
Air Lease Corp (AL -$0.90 or -2.15% to $40.99) pulled back with higher volume indicative of mild distributional pressure while retreating from a new 52-week high following volume-driven gains. Prior highs near $40 define near-term support to watch on pullbacks. Disciplined investors limit losses by always selling if any stock falls more than -7% from their purchase price.
Its earnings Per Share Rank is 97, well above the 80+ minimum for buy candidates. Its Relative Strength Rating of 91 is above the 80+ minimum guideline. AL was last shown in this FSU section on 5/28/14 with an annotated graph under the headline, "Finished Near Session Low and Below 'Max Buy' Level After Gain on Volume", as it gapped up and hit a new 52-week high with 3 times average volume behind its gain. The Commercial Services - Leasing firm was highlighted in yellow with pivot point based on its 3/21/14 high plus 10 cents in the 5/09/14 mid-day report (read here) when its gain backed by +119% above average volume clinched a convincing technical buy signal.
It reported earnings +30% on +28% sales revenues for the Mar '14 quarter, and 3 of the past 4 quarterly comparisons showed earnings increases above the +25% minimum guideline (C criteria). It completed a Secondary Offering on 11/21/13 and an earlier Secondary Offering on 5/31/13. The Commercial Services - Leasing firm has seen the number of top-rated funds owning its shares rise from 177 in Sep '12 to 240 in Mar '14, which is reassuring concerning the I criteria.
|
|
|
Color Codes Explained :
Y - Better candidates highlighted by our
staff of experts.
G - Previously featured
in past reports as yellow but may no longer be buyable under the
guidelines.
***Last / Change / Volume data in this table is the closing quote data***
Symbol/Exchange
Company Name
Industry Group |
PRICE |
CHANGE
(%Change) |
Day High |
Volume
(% DAV)
(% 50 day avg vol) |
52 Wk Hi
% From Hi |
Featured
Date |
Price
Featured |
Pivot Featured |
|
Max Buy |
AFSI
-
NASDAQ
Amtrust Financial Svcs
INSURANCE - Property and; Casualty Insurance
|
$42.54
|
+0.01
0.02% |
$42.90
|
319,633
47.35% of 50 DAV
50 DAV is 675,000
|
$47.10
-9.68%
|
5/21/2014
|
$44.85
|
PP = $44.85
|
|
MB = $47.09
|
Most Recent Note - 6/6/2014 6:06:33 PM
G - Consolidating above its 50 DMA line. Disciplined investors always limit losses by selling any stock that falls more than -7% from their purchase price. See the latest FSU analysis for more details and new annotated graphs.
>>> FEATURED STOCK ARTICLE : Halted Slide at 50-Day Moving Average After Distributional Pressure - 6/6/2014
View all notes |
Set NEW NOTE alert |
CANSLIM.net Company Profile |
SEC
News |
Chart |
Request a new note
C
A N
S L
I M


|
AL
-
NYSE
Air Lease Corp Cl A
DIVERSIFIED SERVICES - Rental and Leasing Services
|
$40.99
|
-0.90
-2.15% |
$41.94
|
1,248,350
146.69% of 50 DAV
50 DAV is 851,000
|
$42.89
-4.43%
|
5/9/2014
|
$38.27
|
PP = $38.25
|
|
MB = $40.16
|
 Most Recent Note - 6/11/2014 6:22:25 PM
G - Enduring mild distributional pressure while pulling back from its 52-week high today following volume-driven gains. Prior highs near $40 define near-term support to watch on pullbacks. See latest FSU analysis for more details and new annotated graphs.
>>> FEATURED STOCK ARTICLE : Enduring Mild Distributional Pressure on Pullback - 6/11/2014
View all notes |
Set NEW NOTE alert |
CANSLIM.net Company Profile |
SEC
News |
Chart |
Request a new note
C
A N
S L
I M
|
EQM
-
NYSE
E Q T Midstream Partners
ENERGY - Oil and Gas Pipelines
|
$89.43
|
-1.97
-2.16% |
$91.30
|
265,640
105.83% of 50 DAV
50 DAV is 251,000
|
$91.78
-2.56%
|
12/12/2013
|
$53.17
|
PP = $56.51
|
|
MB = $59.34
|
Most Recent Note - 6/6/2014 6:18:36 PM
G - Hit yet another new 52-week high with today's 9th consecutive gain on below average volume. Fundamental concerns remain after 2 consecutive sub par quarters below the +25% minimum earnings guideline.
>>> FEATURED STOCK ARTICLE : New Highs Again With Light Volume Behind Streak of Gains - 6/4/2014
View all notes |
Set NEW NOTE alert |
CANSLIM.net Company Profile |
SEC
News |
Chart |
Request a new note
C
A N
S L
I M
|
GRFS
-
NASDAQ
Grifols Sa Ads
Medical-Ethical Drugs
|
$45.69
|
-0.73
-1.57% |
$46.14
|
544,461
78.57% of 50 DAV
50 DAV is 693,000
|
$46.66
-2.08%
|
5/15/2014
|
$41.14
|
PP = $43.55
|
|
MB = $45.73
|
Most Recent Note - 6/9/2014 6:57:47 PM
G - Color code is changed to green after finishing near the session high and above its "max buy" level with today's 5th consecutive gain on above average and ever-increasing volume. Prior highs near $43 area define near-term support to watch on pullbacks.
>>> FEATURED STOCK ARTICLE : Finding Support Above 50-Day Moving Average - 6/3/2014
View all notes |
Set NEW NOTE alert |
CANSLIM.net Company Profile |
SEC
News |
Chart |
Request a new note
C
A N
S L
I M
|
ICON
-
NASDAQ
Iconix Brand Group Inc
CONSUMER NON-DURABLES - Textile - Apparel Footwear
|
$43.64
|
-0.30
-0.68% |
$43.91
|
498,319
91.77% of 50 DAV
50 DAV is 543,000
|
$44.81
-2.61%
|
6/5/2014
|
$43.54
|
PP = $43.44
|
|
MB = $45.61
|
Most Recent Note - 6/5/2014 6:40:25 PM
Y - Hit a new all-time high today with a gain on average volume. New pivot point is cited based on its 5/01/14 high plus 10 cents. The gain on the prior session was backed by +50% above average volume as it rallied for a new high close and triggered a new (or add-on) technical buy signal. See the latest FSU analysis for more details and new annotated graphs.
>>> FEATURED STOCK ARTICLE : Gain With Above Average Volume an Encouraging Sign - 6/5/2014
View all notes |
Set NEW NOTE alert |
CANSLIM.net Company Profile |
SEC
News |
Chart |
Request a new note
C
A N
S L
I M
|
Symbol/Exchange
Company Name
Industry Group |
PRICE |
CHANGE
(%Change) |
Day High |
Volume
(% DAV)
(% 50 day avg vol) |
52 Wk Hi
% From Hi |
Featured
Date |
Price
Featured |
Pivot Featured |
|
Max Buy |
KORS
-
NYSE
Michael Kors Hldgs Ltd
RETAIL - Apparel Stores
|
$95.37
|
+0.99
1.05% |
$95.91
|
2,248,707
82.89% of 50 DAV
50 DAV is 2,713,000
|
$101.04
-5.61%
|
5/27/2014
|
$96.70
|
PP = $101.14
|
|
MB = $106.20
|
Most Recent Note - 6/10/2014 7:13:49 PM
Y - Deterioration below its 50 DMA line would raise more concerns and trigger a technical sell signal. A breakout above the pivot point with at least +40% above average volume is needed to trigger a new technical buy signal. see the latest FSU analysis for more details and new annotated graphs.
>>> FEATURED STOCK ARTICLE : Relative Strength Line's Downward Slope a Discouraging Sign - 6/10/2014
View all notes |
Set NEW NOTE alert |
CANSLIM.net Company Profile |
SEC
News |
Chart |
Request a new note
C
A N
S L
I M
|
PANW
-
NYSE
Palo Alto Networks
Computer Sftwr-Security
|
$78.20
|
+0.06
0.08% |
$78.66
|
978,146
49.35% of 50 DAV
50 DAV is 1,982,000
|
$80.84
-3.27%
|
5/29/2014
|
$75.95
|
PP = $72.50
|
|
MB = $76.13
|
Most Recent Note - 6/5/2014 1:05:00 PM
G - Color code is changed to green after rallying above its "max buy" level with today's gain. Little overhead supply remains up through the $80 level. Prior highs near $72 define important support above its 50 DMA line.
>>> FEATURED STOCK ARTICLE : Finish Near Session Low Following Gap Up From Double Bottom Base - 5/29/2014
View all notes |
Set NEW NOTE alert |
CANSLIM.net Company Profile |
SEC
News |
Chart |
Request a new note
C
A N
S L
I M
|
SN
-
NYSE
Sanchez Energy Corp
ENERGY - Independent Oil and Gas
|
$34.96
|
+0.25
0.72% |
$35.20
|
1,563,442
126.29% of 50 DAV
50 DAV is 1,238,000
|
$35.93
-2.70%
|
5/22/2014
|
$33.00
|
PP = $31.59
|
|
MB = $33.17
|
Most Recent Note - 6/11/2014 12:50:33 PM
G - Managed a positive reversal after gapping down today following news of both a $200 Million Common Stock and a $700 Million Senior Notes Offering. Prior highs near $31-32 define support to watch on pullbacks.
>>> FEATURED STOCK ARTICLE : Finished Near Session Low After Hitting new 52-Week High - 6/9/2014
View all notes |
Set NEW NOTE alert |
CANSLIM.net Company Profile |
SEC
News |
Chart |
Request a new note
C
A N
S L
I M
|
TRN
-
NYSE
Trinity Industries Inc
TRANSPORTATION - Railroads
|
$82.16
|
-0.46
-0.56% |
$82.61
|
1,597,626
104.63% of 50 DAV
50 DAV is 1,527,000
|
$87.89
-6.52%
|
4/30/2014
|
$75.57
|
PP = $76.05
|
|
MB = $79.85
|
Most Recent Note - 6/6/2014 1:05:42 PM
G - Halted its slide after 5 consecutive losses and gapped up today. Prior highs in the $75-76 area coincide with its 50 DMA line ($76.48) defining important support to watch.
>>> FEATURED STOCK ARTICLE : Extended From Prior Base After +15% Rally in One Month - 6/2/2014
View all notes |
Set NEW NOTE alert |
CANSLIM.net Company Profile |
SEC
News |
Chart |
Request a new note
C
A N
S L
I M
|
WLK
-
NYSE
Westlake Chemical Corp
CHEMICALS - Specialty Chemicals
|
$82.15
|
+0.01
0.01% |
$82.32
|
348,558
45.80% of 50 DAV
50 DAV is 761,000
|
$82.47
-0.39%
|
4/29/2014
|
$72.79
|
PP = $69.31
|
|
MB = $72.78
|
Most Recent Note - 6/11/2014 6:31:23 PM
G - Quietly hovering near its 52-week high. Prior highs near $77 define important near-term support to watch on pullbacks.
>>> FEATURED STOCK ARTICLE : Extended From Prior Base After 5 Weekly Gains - 5/30/2014
View all notes |
Set NEW NOTE alert |
CANSLIM.net Company Profile |
SEC
News |
Chart |
Request a new note
C
A N
S L
I M
|
Symbol/Exchange
Company Name
Industry Group |
PRICE |
CHANGE
(%Change) |
Day High |
Volume
(% DAV)
(% 50 day avg vol) |
52 Wk Hi
% From Hi |
Featured
Date |
Price
Featured |
Pivot Featured |
|
Max Buy |
|
|
|
THESE ARE NOT BUY RECOMMENDATIONS!
Comments contained in the body of this report are technical
opinions only. The material herein has been obtained
from sources believed to be reliable and accurate, however,
its accuracy and completeness cannot be guaranteed.
This site is not an investment advisor, hence it does
not endorse or recommend any securities or other investments.
Any recommendation contained in this report may not
be suitable for all investors and it is not to be deemed
an offer or solicitation on our part with respect to
the purchase or sale of any securities. All trademarks,
service marks and trade names appearing in this report
are the property of their respective owners, and are
likewise used for identification purposes only.
This report is a service available
only to active Paid Premium Members.
You may opt-out of receiving report notifications
at any time. Questions or comments may be submitted
by writing to Premium Membership Services 665 S.E. 10 Street, Suite 201 Deerfield Beach, FL 33441-5634 or by calling 1-800-965-8307
or 954-785-1121.
|
|
|

