You are not logged in.
This means you
CAN ONLY VIEW reports that were published prior to Thursday, April 10, 2025.
You
MUST UPGRADE YOUR MEMBERSHIP if you want to see any current reports.
AFTER MARKET UPDATE - TUESDAY, JUNE 10TH, 2014
Previous After Market Report Next After Market Report >>>
|
|
|
|
DOW |
+2.82 |
16,945.92 |
+0.02% |
|
Volume |
544,847,140 |
-8% |
|
Volume |
1,654,950,960 |
-1% |
|
NASDAQ |
+1.76 |
4,338.00 |
+0.04% |
|
Advancers |
1,288 |
41% |
|
Advancers |
1,196 |
43% |
|
S&P 500 |
-0.48 |
1,950.79 |
-0.02% |
|
Decliners |
1,750 |
55% |
|
Decliners |
1,489 |
53% |
|
Russell 2000 |
-3.17 |
1,172.71 |
-0.27% |
|
52 Wk Highs |
153 |
|
|
52 Wk Highs |
92 |
|
|
S&P 600 |
-2.63 |
673.67 |
-0.39% |
|
52 Wk Lows |
8 |
|
|
52 Wk Lows |
12 |
|
|
 |
S&P 500 Index and Dow Jones Industrial Average Hover at All-Time Highs
Kenneth J. Gruneisen - Passed the CAN SLIM® Master's Exam
Stocks finished flat on Tuesday. The volume was reported lighter than the prior session totals on the Nasdaq exchange and on the NYSE. Decliners led advancers by a almost a 3-2 margin on the NYSE and 5-4 on the Nasdaq Exchange. There were 55 high-ranked companies from the CANSLIM.net Leaders List that made new 52-week highs and appeared on the CANSLIM.net BreakOuts Page, down from the total of 113 stocks on the prior session. New 52-week highs contracted yet still easily outnumbered new 52-week lows on the NYSE and Nasdaq exchange. There were gains for 4 of the 10 high-ranked companies currently included on the Featured Stocks Page. The S&P 500 Index and Dow Jones Industrial Average continued their surges into new high territory. The expansion in leadership (new 52-week highs) is a reassuring signal that the market direction (M criteria) is in a "confirmed uptrend". Any new buying efforts should be selective and focused in stocks meeting all key criteria of the fact-based investment system.
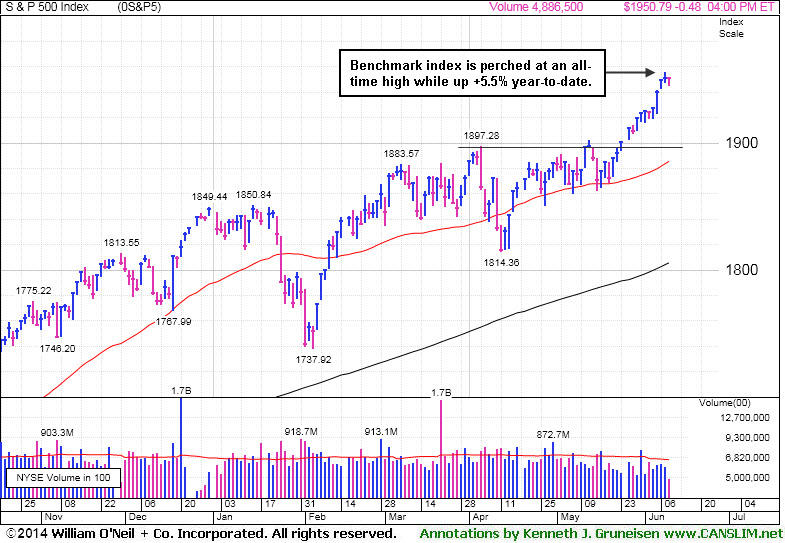
PICTURED: The S&P 500 Index is perched at an all-time high and up +5.5% year-to-date.
Investors took a breather following the recent rally. Economic data garnered some attention. Wholesale inventories increased for the 10th consecutive month in April and a gauge of small business optimism unexpectedly rose last month to the highest since September 2007. On the earnings front, RadioShack (RSH -11%) after posting its ninth-straight quarterly decline in sales. In other news, Best Buy (BBY +2.4%) rose after raising its quarterly dividend for the first time in two years.
Overall, sectors were mixed. Consumer discretionary and utilities were the worst performing groups as Target (TGT -1.3%) and Duke Energy (DUK -0.6%) fell. Gains in health care and technology helped limit losses as Johnson & Johnson (JNJ +0.9%) rose. Facebook (FB +4.6%) rallied following news that it hired eBay's (EBAY ) PayPal president to lead the company's mobile messaging business.
Treasuries declined for a third session and the government sold $28 billion in three-year notes at the highest yield since May 2011. The 10-year note fell 10/32 to yield 2.64%.
The CANSLIM.net Featured Stocks Page shows the most action-worthy candidates and their latest notes and a Headline Link directs members to the latest detailed analysis with data-packed graphs annotated by a Certified expert along with links to additional resources. The Premium Member Homepage includes "dynamic archives" to all prior pay reports published. Watch for an announcement via email concerning the next WEBCAST.
|
 Kenneth J. Gruneisen started out as a licensed stockbroker in August 1987, a couple of months prior to the historic stock market crash that took the Dow Jones Industrial Average down -22.6% in a single day. He has published daily fact-based fundamental and technical analysis on high-ranked stocks online for two decades. Through FACTBASEDINVESTING.COM, Kenneth provides educational articles, news, market commentary, and other information regarding proven investment systems that work in good times and bad.
Comments contained in the body of this report are technical opinions only and are not necessarily those of Gruneisen Growth Corp. The material herein has been obtained from sources believed to be reliable and accurate, however, its accuracy and completeness cannot be guaranteed. Our firm, employees, and customers may effect transactions, including transactions contrary to any recommendation herein, or have positions in the securities mentioned herein or options with respect thereto. Any recommendation contained in this report may not be suitable for all investors and it is not to be deemed an offer or solicitation on our part with respect to the purchase or sale of any securities. |
|
 |
Gold & Silver Index a Standout Group on Indecisive Session
Kenneth J. Gruneisen - Passed the CAN SLIM® Master's Exam
The Broker/Dealer Index ($XBD -0.69%) was a negative influence and it outpaced the Bank Index ($BKX -0.11%) to the downside while the Retail Index ($RLX -0.06%) finished flat on Tuesday. The tech sector showed a slightly positive bias as the Semiconductor Index ($SOX +0.29%), Biotechnology Index ($BTK +0.27%), and Networking Index ($NWX +0.13%) edged higher. The Gold & Silver Index ($XAU +2.02%) was a standout gainer while the Integrated Oil Index ($XOI +0.04%) finished flat and the Oil Services Index ($OSX -0.41%) suffered a small loss.
Charts courtesy www.stockcharts.com
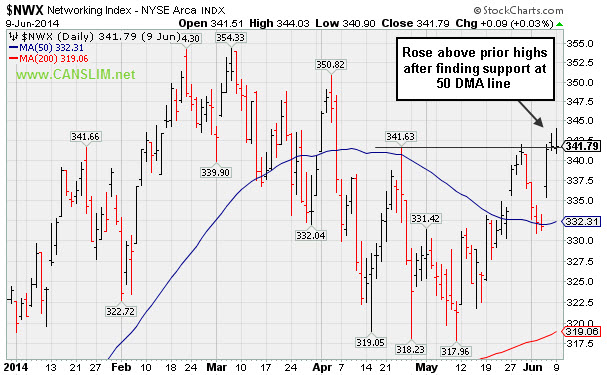
PICTURED: The Networking Index ($NWX +0.13%) rose above prior highs after finding support at its 50-day moving average (DMA) line.
| Oil Services |
$OSX |
296.24 |
-1.21 |
-0.41% |
+5.41% |
| Integrated Oil |
$XOI |
1,642.93 |
+0.61 |
+0.04% |
+9.30% |
| Semiconductor |
$SOX |
620.26 |
+1.82 |
+0.29% |
+15.93% |
| Networking |
$NWX |
342.23 |
+0.44 |
+0.13% |
+5.65% |
| Broker/Dealer |
$XBD |
158.13 |
-1.09 |
-0.69% |
-1.52% |
| Retail |
$RLX |
893.68 |
-0.56 |
-0.06% |
-4.91% |
| Gold & Silver |
$XAU |
88.18 |
+1.75 |
+2.02% |
+4.79% |
| Bank |
$BKX |
71.77 |
-0.08 |
-0.11% |
+3.62% |
| Biotech |
$BTK |
2,691.28 |
+7.29 |
+0.27% |
+15.48% |
|
|
|
 |
Relative Strength Line's Downward Slope a Discouraging Sign
Kenneth J. Gruneisen - Passed the CAN SLIM® Master's Exam
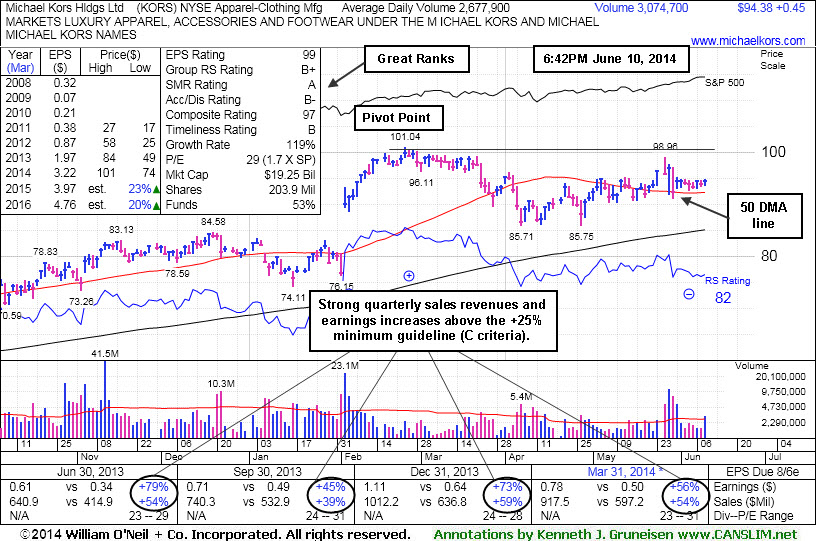
Michael Kors Hldgs Ltd (KORS +$0.45 or +0.48% to $94.38) has still been finding support at its 50-day moving average (DMA) line. Subsequent losses leading to deterioration below that important short-term average would raise more concerns and trigger a technical sell signal. A breakout above the pivot point with at least +40% above average volume is needed to trigger a new technical buy signal.
KORS faces some resistance due to overhead supply up through the $101 level. Its Relative Strength ratting of 82 is above the 80+ minimum for buy candidates under the fact-based investment system, however the jagged blue Relative Strength line was higher month ago. Historic studies have shown that most big stock market winners saw their Relative Strength lines hitting new high territory prior to the stock price technically breaking out to new high. Downward slope of its Relative Strength line in recent months is therefore considered a discouraging sign.
KORS was last shown in this FSU section on 5/27/14 with annotated graphs under the headline, "Earnings News May Prompt Volume and Volatility". On that session it encountered distributional pressure as it erased early gains and finished lower after a "negative reversal". The fact it has found support above its 50-day moving average (DMA) line since is an encouraging sign that institutional owners are still looking at the company with favor. However, damaging deterioration below that important short-term average would raise more serious concerns and trigger a technical sell signal and would hint that institutional owners were turning skeptical.
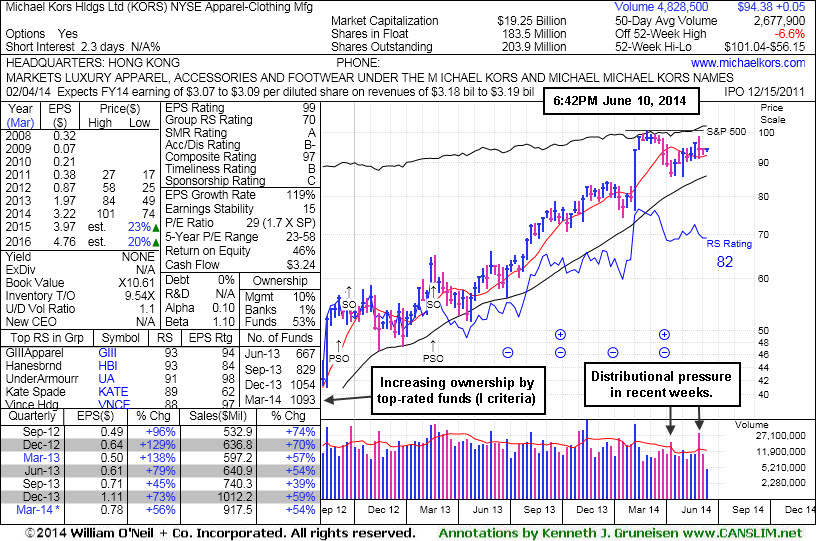
Fundamentals remain favorable with respect to the fact-based investment system (C and A criteria). This high-ranked Apparel - Clothing Manufacturing firm has headquarters in Hong Kong. It completed Secondary Offerings on 9/25/12 and 2/20/13, each time while perched near its all-time highs. Prior reports noted - "Such offerings often are a short-term hindrance to upward price progress yet typically result in broader institutional ownership interest." The number of top-rated funds owning its shares rose from 668 in Jun '13 to 1,093 in Mar '14, a reassuring sign concerning the I criteria.
|
|
|
Color Codes Explained :
Y - Better candidates highlighted by our
staff of experts.
G - Previously featured
in past reports as yellow but may no longer be buyable under the
guidelines.
***Last / Change / Volume data in this table is the closing quote data***
Symbol/Exchange
Company Name
Industry Group |
PRICE |
CHANGE
(%Change) |
Day High |
Volume
(% DAV)
(% 50 day avg vol) |
52 Wk Hi
% From Hi |
Featured
Date |
Price
Featured |
Pivot Featured |
|
Max Buy |
AFSI
-
NASDAQ
Amtrust Financial Svcs
INSURANCE - Property and; Casualty Insurance
|
$42.53
|
-0.16
-0.37% |
$42.88
|
288,597
42.76% of 50 DAV
50 DAV is 675,000
|
$47.10
-9.70%
|
5/21/2014
|
$44.85
|
PP = $44.85
|
|
MB = $47.09
|
Most Recent Note - 6/6/2014 6:06:33 PM
G - Consolidating above its 50 DMA line. Disciplined investors always limit losses by selling any stock that falls more than -7% from their purchase price. See the latest FSU analysis for more details and new annotated graphs.
>>> FEATURED STOCK ARTICLE : Halted Slide at 50-Day Moving Average After Distributional Pressure - 6/6/2014
View all notes |
Set NEW NOTE alert |
CANSLIM.net Company Profile |
SEC
News |
Chart |
Request a new note
C
A N
S L
I M


|
AL
-
NYSE
Air Lease Corp Cl A
DIVERSIFIED SERVICES - Rental and Leasing Services
|
$41.89
|
-0.43
-1.02% |
$42.43
|
796,235
94.23% of 50 DAV
50 DAV is 845,000
|
$42.89
-2.33%
|
5/9/2014
|
$38.27
|
PP = $38.25
|
|
MB = $40.16
|
Most Recent Note - 6/5/2014 12:24:20 PM
G - Hitting a new 52-week high today after stubbornly holding its ground following volume-driven gains. Prior highs near $40 define near-term support to watch on pullbacks.
>>> FEATURED STOCK ARTICLE : Finished Near Session Low and Below "Max Buy" Level After Gain on Volume - 5/28/2014
View all notes |
Set NEW NOTE alert |
CANSLIM.net Company Profile |
SEC
News |
Chart |
Request a new note
C
A N
S L
I M
|
EQM
-
NYSE
E Q T Midstream Partners
ENERGY - Oil and Gas Pipelines
|
$91.40
|
+1.83
2.04% |
$91.78
|
302,999
122.67% of 50 DAV
50 DAV is 247,000
|
$89.90
1.67%
|
12/12/2013
|
$53.17
|
PP = $56.51
|
|
MB = $59.34
|
Most Recent Note - 6/6/2014 6:18:36 PM
G - Hit yet another new 52-week high with today's 9th consecutive gain on below average volume. Fundamental concerns remain after 2 consecutive sub par quarters below the +25% minimum earnings guideline.
>>> FEATURED STOCK ARTICLE : New Highs Again With Light Volume Behind Streak of Gains - 6/4/2014
View all notes |
Set NEW NOTE alert |
CANSLIM.net Company Profile |
SEC
News |
Chart |
Request a new note
C
A N
S L
I M
|
GRFS
-
NASDAQ
Grifols Sa Ads
Medical-Ethical Drugs
|
$46.42
|
-0.02
-0.04% |
$46.66
|
653,591
94.59% of 50 DAV
50 DAV is 691,000
|
$46.56
-0.30%
|
5/15/2014
|
$41.14
|
PP = $43.55
|
|
MB = $45.73
|
Most Recent Note - 6/9/2014 6:57:47 PM
G - Color code is changed to green after finishing near the session high and above its "max buy" level with today's 5th consecutive gain on above average and ever-increasing volume. Prior highs near $43 area define near-term support to watch on pullbacks.
>>> FEATURED STOCK ARTICLE : Finding Support Above 50-Day Moving Average - 6/3/2014
View all notes |
Set NEW NOTE alert |
CANSLIM.net Company Profile |
SEC
News |
Chart |
Request a new note
C
A N
S L
I M
|
ICON
-
NASDAQ
Iconix Brand Group Inc
CONSUMER NON-DURABLES - Textile - Apparel Footwear
|
$43.94
|
-0.28
-0.63% |
$44.36
|
403,126
74.38% of 50 DAV
50 DAV is 542,000
|
$44.81
-1.94%
|
6/5/2014
|
$43.54
|
PP = $43.44
|
|
MB = $45.61
|
Most Recent Note - 6/5/2014 6:40:25 PM
Y - Hit a new all-time high today with a gain on average volume. New pivot point is cited based on its 5/01/14 high plus 10 cents. The gain on the prior session was backed by +50% above average volume as it rallied for a new high close and triggered a new (or add-on) technical buy signal. See the latest FSU analysis for more details and new annotated graphs.
>>> FEATURED STOCK ARTICLE : Gain With Above Average Volume an Encouraging Sign - 6/5/2014
View all notes |
Set NEW NOTE alert |
CANSLIM.net Company Profile |
SEC
News |
Chart |
Request a new note
C
A N
S L
I M
|
Symbol/Exchange
Company Name
Industry Group |
PRICE |
CHANGE
(%Change) |
Day High |
Volume
(% DAV)
(% 50 day avg vol) |
52 Wk Hi
% From Hi |
Featured
Date |
Price
Featured |
Pivot Featured |
|
Max Buy |
KORS
-
NYSE
Michael Kors Hldgs Ltd
RETAIL - Apparel Stores
|
$94.38
|
+0.45
0.48% |
$94.77
|
3,065,093
114.50% of 50 DAV
50 DAV is 2,677,000
|
$101.04
-6.59%
|
5/27/2014
|
$96.70
|
PP = $101.14
|
|
MB = $106.20
|
 Most Recent Note - 6/10/2014 7:13:49 PM
Y - Deterioration below its 50 DMA line would raise more concerns and trigger a technical sell signal. A breakout above the pivot point with at least +40% above average volume is needed to trigger a new technical buy signal. see the latest FSU analysis for more details and new annotated graphs.
>>> FEATURED STOCK ARTICLE : Relative Strength Line's Downward Slope a Discouraging Sign - 6/10/2014
View all notes |
Set NEW NOTE alert |
CANSLIM.net Company Profile |
SEC
News |
Chart |
Request a new note
C
A N
S L
I M
|
PANW
-
NYSE
Palo Alto Networks
Computer Sftwr-Security
|
$78.14
|
+0.74
0.96% |
$78.50
|
885,852
43.92% of 50 DAV
50 DAV is 2,017,000
|
$80.84
-3.34%
|
5/29/2014
|
$75.95
|
PP = $72.50
|
|
MB = $76.13
|
Most Recent Note - 6/5/2014 1:05:00 PM
G - Color code is changed to green after rallying above its "max buy" level with today's gain. Little overhead supply remains up through the $80 level. Prior highs near $72 define important support above its 50 DMA line.
>>> FEATURED STOCK ARTICLE : Finish Near Session Low Following Gap Up From Double Bottom Base - 5/29/2014
View all notes |
Set NEW NOTE alert |
CANSLIM.net Company Profile |
SEC
News |
Chart |
Request a new note
C
A N
S L
I M
|
SN
-
NYSE
Sanchez Energy Corp
ENERGY - Independent Oil and Gas
|
$34.71
|
-0.18
-0.52% |
$34.95
|
663,484
53.42% of 50 DAV
50 DAV is 1,242,000
|
$35.93
-3.40%
|
5/22/2014
|
$33.00
|
PP = $31.59
|
|
MB = $33.17
|
Most Recent Note - 6/9/2014 6:55:34 PM
G - Encountered distributional pressure and finished near the session low after hitting a new 52-week high with today's 5th consecutive gain. Prior highs near $31-32 define support to watch on pullbacks. See the latest FSU analysis for more details and new annotated graphs.
>>> FEATURED STOCK ARTICLE : Finished Near Session Low After Hitting new 52-Week High - 6/9/2014
View all notes |
Set NEW NOTE alert |
CANSLIM.net Company Profile |
SEC
News |
Chart |
Request a new note
C
A N
S L
I M
|
TRN
-
NYSE
Trinity Industries Inc
TRANSPORTATION - Railroads
|
$82.62
|
-0.47
-0.57% |
$83.39
|
1,598,250
105.36% of 50 DAV
50 DAV is 1,517,000
|
$87.89
-5.99%
|
4/30/2014
|
$75.57
|
PP = $76.05
|
|
MB = $79.85
|
Most Recent Note - 6/6/2014 1:05:42 PM
G - Halted its slide after 5 consecutive losses and gapped up today. Prior highs in the $75-76 area coincide with its 50 DMA line ($76.48) defining important support to watch.
>>> FEATURED STOCK ARTICLE : Extended From Prior Base After +15% Rally in One Month - 6/2/2014
View all notes |
Set NEW NOTE alert |
CANSLIM.net Company Profile |
SEC
News |
Chart |
Request a new note
C
A N
S L
I M
|
WLK
-
NYSE
Westlake Chemical Corp
CHEMICALS - Specialty Chemicals
|
$82.14
|
+0.21
0.26% |
$82.18
|
389,010
51.12% of 50 DAV
50 DAV is 761,000
|
$82.47
-0.40%
|
4/29/2014
|
$72.79
|
PP = $69.31
|
|
MB = $72.78
|
Most Recent Note - 6/4/2014 6:10:34 PM
G - Hit a new 52-week high with today's volume-driven gain. Recent lows near $73 define important near-term support to watch on pullbacks.
>>> FEATURED STOCK ARTICLE : Extended From Prior Base After 5 Weekly Gains - 5/30/2014
View all notes |
Set NEW NOTE alert |
CANSLIM.net Company Profile |
SEC
News |
Chart |
Request a new note
C
A N
S L
I M
|
Symbol/Exchange
Company Name
Industry Group |
PRICE |
CHANGE
(%Change) |
Day High |
Volume
(% DAV)
(% 50 day avg vol) |
52 Wk Hi
% From Hi |
Featured
Date |
Price
Featured |
Pivot Featured |
|
Max Buy |
|
|
|
THESE ARE NOT BUY RECOMMENDATIONS!
Comments contained in the body of this report are technical
opinions only. The material herein has been obtained
from sources believed to be reliable and accurate, however,
its accuracy and completeness cannot be guaranteed.
This site is not an investment advisor, hence it does
not endorse or recommend any securities or other investments.
Any recommendation contained in this report may not
be suitable for all investors and it is not to be deemed
an offer or solicitation on our part with respect to
the purchase or sale of any securities. All trademarks,
service marks and trade names appearing in this report
are the property of their respective owners, and are
likewise used for identification purposes only.
This report is a service available
only to active Paid Premium Members.
You may opt-out of receiving report notifications
at any time. Questions or comments may be submitted
by writing to Premium Membership Services 665 S.E. 10 Street, Suite 201 Deerfield Beach, FL 33441-5634 or by calling 1-800-965-8307
or 954-785-1121.
|
|
|

