You are not logged in.
This means you
CAN ONLY VIEW reports that were published prior to Monday, April 14, 2025.
You
MUST UPGRADE YOUR MEMBERSHIP if you want to see any current reports.
AFTER MARKET UPDATE - WEDNESDAY, JUNE 10TH, 2009
Previous After Market Report Next After Market Report >>>
|
|
|
|
DOW |
-24.04 |
8,739.02 |
-0.27% |
|
Volume |
1,220,161,000 |
+15% |
|
Volume |
2,425,385,810 |
+12% |
|
NASDAQ |
-7.05 |
1,853.08 |
-0.38% |
|
Advancers |
1,371 |
44% |
|
Advancers |
1,069 |
37% |
|
S&P 500 |
-3.28 |
939.15 |
-0.35% |
|
Decliners |
1,641 |
53% |
|
Decliners |
1,649 |
58% |
|
Russell 2000 |
-4.22 |
523.71 |
-0.80% |
|
52 Wk Highs |
18 |
|
|
52 Wk Highs |
40 |
|
|
S&P 600 |
-2.42 |
276.73 |
-0.87% |
|
52 Wk Lows |
3 |
|
|
52 Wk Lows |
7 |
|
|
 |
Modest Distributional Pressure Barely Phases Indices
Adam Sarhan, Contributing Writer,
The major averages ended lower after the Treasury's 10-year note auction and the Fed's Beige Book data was released. Decliners led advancers by an 8-to-7 ratio on the NYSE while they led by more than a 3-to-2 ratio on the Nasdaq exchange. Volume was reported higher than the prior session on the NYSE and Nasdaq exchange, which marked a distribution day, however the relatively minor losses for the major indices softened its severity. Interestingly, there were 19 high-ranked companies from the CANSLIM.net Leaders List that made a new 52-week high and appeared on the CANSLIM.net BreakOuts Page, higher than the 11 issues that appeared on the prior session. The greater expansion in the new highs list, especially on a down day for the broader market, offered more encouraging news for growth oriented investors.
Before Wednesday's opening bell Home Depot (HD +0.16%) raised guidance for the rest of the year which sent futures prices nicely higher. However, the buying enthusiasm quickly waned and shortly after the opening bell the market slid into negative territory. The 10-year Treasury yield jumped over +4%, which was the highest rate this year. On Wednesday, the government sold $19 billion to large fund managers, sovereign wealth funds, foreign central banks, and other buyers. This was the second of three auctions this week that will raise $65 billion as the government tries to finance its record spending.
Shortly after 2pm EST the Federal Reserve released its Beige Book which showed that the economic slump may be declining in nearly half its regions. The report also showed that the outlook at some companies continue to improve while “stringent” loan conditions and a “weak” labor market continue to curb economic growth. The Fed said, “Economic conditions remained weak or deteriorated further” from mid-April through May. In 5 of the 12 Fed districts it was “noted that the downward trend is showing signs of moderating.” The report reaffirms comments that the rate of economic deterioration is slowing from Fed Chairman Ben S. Bernanke’s congressional testimony last week.
A late-day rally helped the major averages erase earlier losses and finish well up from the session's lows. It was also encouraging see the bulls show up and defend support for the major averages. Since Monday June 1, 2009, the major averages have traded in a very narrow trading range as they continue building base-on-base type patterns. Looking forward, the bulls remain in control as long as support holds.
PICTURED: The Dow Jones Industriual Average continues building its base-on-base pattern.
|
|
|
 |
Most Groups Ended Modestly Lower
Kenneth J. Gruneisen - Passed the CAN SLIM® Master's Exam
Energy-related shares posted modest gains on Wednesday and gave the Integrated Oil ($XOI +0.59%) and Oil Services ($OSX +1.36%) indexes a small boost Most other groups fell modestly, with the influential Broker/Dealer ($XBD -1.77%) and Bank ($BKX -1.27%) indexes creating a drag on the major averages along with the Retail Index ($RLX -0.92%) and some tech shares. The Networking ($NWX -1.05%), Biotechnology ($BTK -1.54%), and Internet ($IIX -0.59%) indexes lost ground while the Semiconductor Index ($SOX +0.20%) bucked the trend while posting a slight gain. The Gold & Silver Index ($XAU -0.68%) ended with a modest loss and the Healthcare ($HMO -0.03%) group ended flat.
Charts courtesy www.stockcharts.com
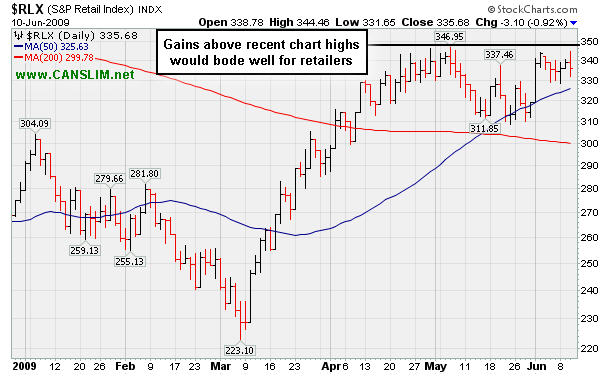
PICTURED: The Retail Index ($RLX -0.92%) is consolidating above its 50-day and 200-day moving average (DMA) lines. Subsequent gains above recent chart highs could signal better health among retail-related issues.
| Oil Services |
$OSX |
183.68 |
+2.46 |
+1.36% |
+51.31% |
| Healthcare |
$HMO |
1,046.09 |
-0.33 |
-0.03% |
+8.95% |
| Integrated Oil |
$XOI |
993.65 |
+5.85 |
+0.59% |
+1.43% |
| Semiconductor |
$SOX |
283.20 |
+0.56 |
+0.20% |
+33.48% |
| Networking |
$NWX |
193.47 |
-2.05 |
-1.05% |
+34.46% |
| Internet |
$IIX |
192.91 |
-1.14 |
-0.59% |
+44.21% |
| Broker/Dealer |
$XBD |
101.04 |
-1.82 |
-1.77% |
+30.42% |
| Retail |
$RLX |
335.68 |
-3.10 |
-0.92% |
+20.20% |
| Gold & Silver |
$XAU |
150.10 |
-1.03 |
-0.68% |
+21.19% |
| Bank |
$BKX |
37.24 |
-0.48 |
-1.27% |
-15.97% |
| Biotech |
$BTK |
671.52 |
-10.50 |
-1.54% |
+3.76% |
|
|
|
 |
Second Distribution Day This Week For Telecom Services Leader
Kenneth J. Gruneisen - Passed the CAN SLIM® Master's Exam
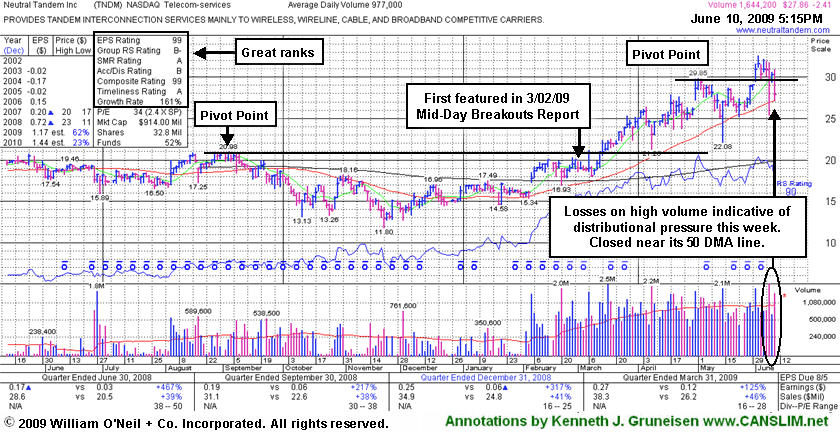
Neutral Tandem Inc (TNDM -$2.41 or -7.99% to $27.86) suffered another considerable loss on above average volume and closed near its session low today, finishing just above its 50-day moving average (DMA) line. This week's second dose of heavy distribution has completely negated its latest technical breakout as the stock closed below its prior high close ($29.64 on 5/01/09). Its color code was changed to green based on the worrisome technical deterioration into its prior base. Meanwhile, any subsequent loss leading to a close below its 50 DMA line would raise more serious concerns and trigger a technical sell signal. Wild whipsaw action intra-day on 6/08/09 likely triggered many open "sell stop" orders. It impressive "positive reversal" on 5/14/09 was noted as a sign of prompt institutional support arriving. It had gapped up on 4/30/09 for a new all-time high after reporting solid quarterly sales and earnings increases.
TNDM traded up as much as +72.42% since first featured at $18.89 in the 3/02/09 Mid-Day BreakOuts Report (read here). Its latest pivot point of $29.85 was based upon the stock's May 1st high. For investors who miss a proper buy point whenever any high-ranked stock breaks out from a first stage base, a stock's first pullback to its 50 DMA line (or its 10-week average when viewing a weekly chart) may offer an ideal secondary buy point. Odds of success taper off upon each subsequent test of support at that important short-term average line. Disciplined investors know that a sound base needs to form before new buying efforts might be justified under the investment system's guidelines. As always, investors should sell to limit losses if ever any stock falls more than -7% from their buy price.
|
|
|
Color Codes Explained :
Y - Better candidates highlighted by our
staff of experts.
G - Previously featured
in past reports as yellow but may no longer be buyable under the
guidelines.
***Last / Change / Volume quote data in this table corresponds with the timestamp on the note***
Symbol/Exchange
Company Name
Industry Group |
Last |
Chg. |
Vol
% DAV |
Date Featured |
Price Featured |
Latest Pivot Point
Featured |
Status |
| Latest Max Buy Price |
GMCR
- NASDAQ
Green Mtn Coffee Roastrs
FOOD & BEVERAGE - Processed & Packaged Goods
|
$61.24
|
N/A
|
N/A
N/A
|
1/1/2008
(Date
Featured) |
$27.13
(Price
Featured) |
PP = $28.66 |
G |
| MB = $30.09 |
Most Recent Note - 6/10/2009
G - Small loss on average volume today ended a 4-day winning streak. Do not be confused by the 3:2 stock split effective 6/09/09. GMCR has traded up more than +138% since appearing with an annotated graph under the headline "It May Soon Be Time To Go Green" when featured in the January 2009 CANSLIM.net News (read here). It is now easier than ever to review prior coverage on current high-ranked leaders via CANSLIM.net's revamped Featured Stock Profile pages. Simply click the company name or links to Company Profile. Thanks to the support of CANSLIM.net's active members, more improvements are coming soon!
>>> The latest Featured Stock Update with an annotated graph appeared on 6/8/2009. click here.
|
|
C
A
S
I |
News |
Chart |
SEC
View all notes Alert
me of new notes
Company
Profile
|
HMSY
- NASDAQ
H M S Holdings Corp
COMPUTER SOFTWARE & SERVICES - Healthcare Information Service
|
$35.56
|
N/A
|
N/A
N/A
|
2/20/2009
(Date
Featured) |
$34.08
(Price
Featured) |
PP = $36.55 |
Y |
| MB = $38.38 |
Most Recent Note - 6/10/2009 4:48:54 PM
Y - Today was its 3rd consecutive loss on light volume. It has been quietly consolidating in a tight range near all-time highs since gapping up on 6/01/09. No overhead supply is left to hinder the progress for this Commercial Services - Healthcare firm.
>>> The latest Featured Stock Update with an annotated graph appeared on 5/28/2009. click here.
|
|
C
A
S
I |
News |
Chart |
SEC
View all notes Alert
me of new notes
Company
Profile
|
ILMN
- NASDAQ
Illumina Inc
DRUGS - Biotechnology
|
$37.85
|
N/A
|
N/A
N/A
|
5/3/2009
(Date
Featured) |
$38.14
(Price
Featured) |
PP = $39.05 |
Y |
| MB = $41.00 |
Most Recent Note - 6/10/2009 5:05:56 PM
Y - Consolidating above its 50 DMA line in a very tight trading range for more than 3 months, but its Relative Strength rank has slumped to 64, raising concerns. Disciplined investors will watch for confirming gains above its pivot point to trigger a proper technical buy signal before taking any action. Recently featured in the May 2009 issue of CANSLIM.net News (read here).
>>> The latest Featured Stock Update with an annotated graph appeared on 5/29/2009. click here.
|
|
C
A
S
I |
News |
Chart |
SEC
View all notes Alert
me of new notes
Company
Profile
|
LFT
-
|
$29.42
|
N/A
|
N/A
N/A
|
4/2/2009
(Date
Featured) |
$22.19
(Price
Featured) |
PP = $21.81 |
G |
| MB = $22.90 |
Most Recent Note - 6/10/2009 5:07:07 PM
G - Holding its ground stubbornly since hitting a new 52-week high on 6/05/09 as it rose from a choppy (improper) base pattern. Its progress could be hindered by future share offerings. Its 5/28/09 gap up and considerable gain followed another strong quarterly financial report. Prompt repair of its recent 50 DMA line violation, and its gap up, were noted as signs of solid institutional (the I criteria) support and buying demand. This Chinese Computer Software firm recently filed a registration of approximately 16 million shares for resale, and it also revealed a planned acquisition of another Chinese service provider.
>>> The latest Featured Stock Update with an annotated graph appeared on 6/4/2009. click here.
|
|
C
A
S
I |
News |
Chart |
SEC
View all notes Alert
me of new notes
Company
Profile
|
NTES
- NASDAQ
Netease Inc Adr
INTERNET - Internet Information Providers
|
$38.22
|
N/A
|
N/A
N/A
|
5/21/2009
(Date
Featured) |
$31.19
(Price
Featured) |
PP = $32.75 |
G |
| MB = $34.39 |
Most Recent Note - 6/9/2009 6:35:50 PM
G - Currently extended from its second-stage base. Its 5/28/09 gap up and considerable gain with +79% above average volume confirmed a technical buy signal as it rose above its pivot point. Indications of institutional (the I criteria) buying demand have been noted after earnings news on 5/20/09 a shakeout tested support near its 50 DMA line. First featured at $26.75 in the 3/31/09 CANSLIM.net Mid-Day Breakouts Report (read here). This high-ranked Chinese Internet - Content firm was also summarized in greater detail including an annotated graph in the April 2009 issue of CANSLIM.net News (read here).
>>> The latest Featured Stock Update with an annotated graph appeared on 6/5/2009. click here.
|
|
C
A
S
I |
News |
Chart |
SEC
View all notes Alert
me of new notes
Company
Profile
|
NVEC
- NASDAQ
N V E Corp
ELECTRONICS - Semiconductor - Specialized
|
$43.07
|
N/A
|
N/A
N/A
|
3/13/2009
(Date
Featured) |
$33.85
(Price
Featured) |
PP = $39.01 |
G |
| MB = $40.96 |
Most Recent Note - 6/10/2009 5:10:20 PM
G - Pulled back on lighter volume today, falling toward prior chart highs after hitting a new 52-week high. It recently found support at its 50 DMA line. Earnings per share rose +38% over the year ago period, yet sales were up just +14% and still rather minuscule.
>>> The latest Featured Stock Update with an annotated graph appeared on 6/9/2009. click here.
|
|
C
A
S
I |
News |
Chart |
SEC
View all notes Alert
me of new notes
Company
Profile
|
SNDA
-
|
$63.32
|
N/A
|
N/A
N/A
|
5/31/2009
(Date
Featured) |
$57.62
(Price
Featured) |
PP = $53.95 |
G |
| MB = $56.65 |
Most Recent Note - 6/10/2009 5:11:10 PM
G - Too extended from a sound base to be considered buyable under the proper guidelines now. Patient investors may watch for a pullback near its 50 DMA line, an important support level which has not been tested since breaking out in March. Just featured in the June 2009 issue of CANSLIM.net News. Be sure to review the "What to Look Out For" section and entire detailed summary - read here).
>>> The latest Featured Stock Update with an annotated graph appeared on 6/3/2009. click here.
|
|
C
A
S
I |
News |
Chart |
SEC
View all notes Alert
me of new notes
Company
Profile
|
SYNA
- NASDAQ
Synaptics Inc
COMPUTER SOFTWARE & SERVICES - Information Technology Service
|
$40.58
|
N/A
|
N/A
N/A
|
5/18/2009
(Date
Featured) |
$32.58
(Price
Featured) |
PP = $34.52 |
G |
| MB = $36.25 |
Most Recent Note - 6/10/2009 5:16:17 PM
G - Rose on average volume today and hit another new 52-week high, adding to the prior session's considerable gain on twice average volume. Approaching its all-time highs near $41, which are mostly a psychological resistance level now, since little overhead supply exists. First featured in yellow in the May 18, 2009 mid-day report (read here). The number of top-rated funds owning its shares rose from 123 in June '08 to 188 in March '09, which is good news concerning the I criteria. Its annual earnings (the A criteria) history showed a dowturn in 2006, leaving concerns, but it followed that up with strong growth the next 2 years. Its small supply of shares (the S criteria) outstanding could contribute to especially great volatility in the event of institutional accumulation or distribution.
>>> The latest Featured Stock Update with an annotated graph appeared on 6/1/2009. click here.
|
|
C
A
S
I |
News |
Chart |
SEC
View all notes Alert
me of new notes
Company
Profile
|
TNDM
- NASDAQ
Tandem Diabetes Care Inc
TELECOMMUNICATIONS - Wireless Communications
|
$27.96
|
N/A
|
N/A
N/A
|
3/2/2009
(Date
Featured) |
$18.89
(Price
Featured) |
PP = $29.85 |
G |
| MB = $31.34 |
Most Recent Note - 6/10/2009 4:21:13 PM
G - Closed near its session low today just above its 50 DMA line after this week's second dose of heavy distribution completely negated its latest technical breakout. Color code is changed to green, and a sound base needs to form before new buying efforts might be justified under the investment system's guidelines. A violation and loss leading to a close below its 50 DMA line would raise more serious concerns and trigger a technical sell signal. Impressive "positive reversal" on 5/14/09 was noted as a sign of prompt institutional support arriving. Gapped up on 4/30/09 for a new all-time high after reporting solid quarterly sales and earnings increases. Traded up as much as +72.42% since first featured at $18.89 in the 3/02/09 Mid-Day BreakOuts Report (read here).
>>> The latest Featured Stock Update with an annotated graph appeared on 6/10/2009. click here.
|
|
C
A
S
I |
News |
Chart |
SEC
View all notes Alert
me of new notes
Company
Profile
|
|
|
|
THESE ARE NOT BUY RECOMMENDATIONS!
Comments contained in the body of this report are technical
opinions only. The material herein has been obtained
from sources believed to be reliable and accurate, however,
its accuracy and completeness cannot be guaranteed.
This site is not an investment advisor, hence it does
not endorse or recommend any securities or other investments.
Any recommendation contained in this report may not
be suitable for all investors and it is not to be deemed
an offer or solicitation on our part with respect to
the purchase or sale of any securities. All trademarks,
service marks and trade names appearing in this report
are the property of their respective owners, and are
likewise used for identification purposes only.
This report is a service available
only to active Paid Premium Members.
You may opt-out of receiving report notifications
at any time. Questions or comments may be submitted
by writing to Premium Membership Services 665 S.E. 10 Street, Suite 201 Deerfield Beach, FL 33441-5634 or by calling 1-800-965-8307
or 954-785-1121.
|
|
|


