You are not logged in.
This means you
CAN ONLY VIEW reports that were published prior to Monday, April 14, 2025.
You
MUST UPGRADE YOUR MEMBERSHIP if you want to see any current reports.
AFTER MARKET UPDATE - MONDAY, JUNE 9TH, 2014
Previous After Market Report Next After Market Report >>>
|
|
|
|
DOW |
+18.82 |
16,943.10 |
+0.11% |
|
Volume |
595,126,680 |
-5% |
|
Volume |
1,668,779,890 |
+10% |
|
NASDAQ |
+14.84 |
4,336.24 |
+0.34% |
|
Advancers |
1,864 |
59% |
|
Advancers |
1,890 |
67% |
|
S&P 500 |
+1.83 |
1,951.27 |
+0.09% |
|
Decliners |
1,165 |
37% |
|
Decliners |
871 |
31% |
|
Russell 2000 |
+10.67 |
1,175.88 |
+0.92% |
|
52 Wk Highs |
315 |
|
|
52 Wk Highs |
192 |
|
|
S&P 600 |
+5.04 |
676.30 |
+0.75% |
|
52 Wk Lows |
5 |
|
|
52 Wk Lows |
18 |
|
|
 |
Major Averages Hit New Record Highs Yet Again
Kenneth J. Gruneisen - Passed the CAN SLIM® Master's Exam
The major averages finished with minor gains on Monday. The volume was reported higher than the prior session total on the Nasdaq exchange but lower on the NYSE. Advancers led decliners by a 3-2 margin on the Nasdaq exchange and 2-1 on the NYSE. Leadership expanded as there were 113 high-ranked companies from the CANSLIM.net Leaders List that made new 52-week highs and appeared on the CANSLIM.net BreakOuts Page, up from the total of 106 stocks on the prior session. New 52-week highs easily outnumbered new 52-week lows on the NYSE and Nasdaq exchange. There were gains for 5 of the 10 high-ranked companies currently included on the Featured Stocks Page. The S&P 500 Index and Dow Jones Industrial Average continued their surges into new high territory. The expansion in leadership (new 52-week highs) is a reassuring signal that the market direction (M criteria) is in a "confirmed uptrend". Any new buying efforts should be selective and focused in stocks meeting all key criteria of the fact-based investment system.
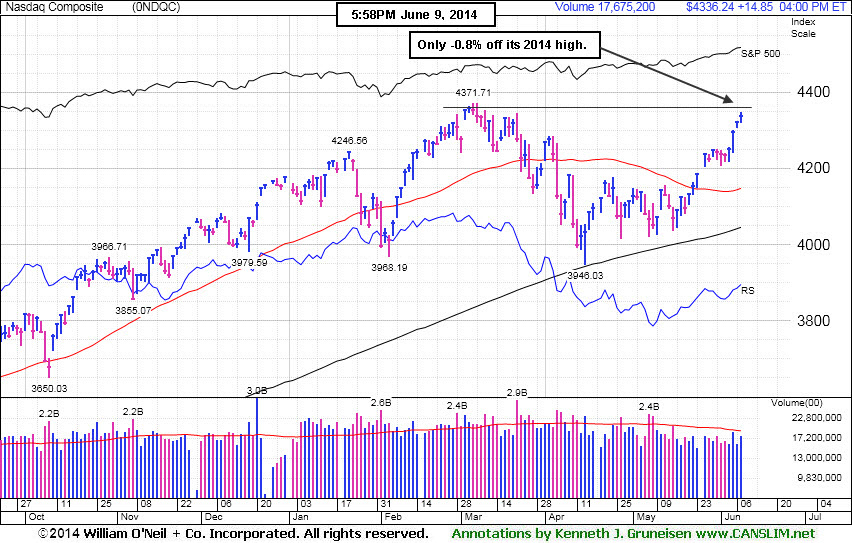
PICTURED: The Nasdaq Composite Index increased 14 points to 4,336, finishing -0.8% off its 2014 high.
The Dow rose 18 points to another record high of 16,943. The S&P 500 also closed at a new all-time high as it gained less than 2 points to 1,951.
Monday's spotlight was on M&A Activity. Hillshire Brands (HSH +5.2%) gained after Tyson Foods (TSN -6.53%)agreed to buy the company for $7.8 billion. In tech, Analog Devices (ADI +4.97%) following news that it acquired chipmaker Hittite Microwave (HITT +28.63%) for about $2 billion. In other action, Family Dollar (FDO +13.37%) rallied after a report that activist investor Carl Icahn became the largest shareholder in the company.
Overall, sectors were mixed. Industrials and financials were the best performing groups as General Electric (GE +0.96%) and Bank of America (BAC +1.6%) rose. Marathon Oil (MRO +1.42%) and other energy stocks also gained ground as WTI crude increased to a three-month high. Losses in utilities and health care limited the indices advance as Dominion Resources (D -1.2%) and Gilead Sciences (GILD -4.11%) fell.
Treasury prices fell. The 10-year note declined 6/32 to yield 2.61%. The 30-year bond lost 8/32 to yield 3.45%.
The CANSLIM.net Featured Stocks Page shows the most action-worthy candidates and their latest notes and a Headline Link directs members to the latest detailed analysis with data-packed graphs annotated by a Certified expert along with links to additional resources. The Premium Member Homepage includes "dynamic archives" to all prior pay reports published. Watch for an announcement via email concerning the next WEBCAST.
|
 Kenneth J. Gruneisen started out as a licensed stockbroker in August 1987, a couple of months prior to the historic stock market crash that took the Dow Jones Industrial Average down -22.6% in a single day. He has published daily fact-based fundamental and technical analysis on high-ranked stocks online for two decades. Through FACTBASEDINVESTING.COM, Kenneth provides educational articles, news, market commentary, and other information regarding proven investment systems that work in good times and bad.
Comments contained in the body of this report are technical opinions only and are not necessarily those of Gruneisen Growth Corp. The material herein has been obtained from sources believed to be reliable and accurate, however, its accuracy and completeness cannot be guaranteed. Our firm, employees, and customers may effect transactions, including transactions contrary to any recommendation herein, or have positions in the securities mentioned herein or options with respect thereto. Any recommendation contained in this report may not be suitable for all investors and it is not to be deemed an offer or solicitation on our part with respect to the purchase or sale of any securities. |
|
 |
Financial and Biotech Indexes Led Gainers
Kenneth J. Gruneisen - Passed the CAN SLIM® Master's Exam
Gains in the influential groups including the Broker/Dealer Index ($XBD +1.02%) and the Bank Index ($BKX +1.45%) helped the major averages tally gains on Monday. The Biotechnology Index ($BTK +0.81%) led the tech sector while the Semiconductor Index ($SOX +0.19%) inched higher and the Networking Index ($NWX +0.03%) finished flat. The Oil Services Index ($OSX +0.33%) edged higher while the Integrated Oil Index ($XOI +0.09%) was little changed, meanwhile the Gold & Silver Index ($XAU -0.31%) and the Retail Index ($RLX -0.14%) both edged lower.
Charts courtesy www.stockcharts.com
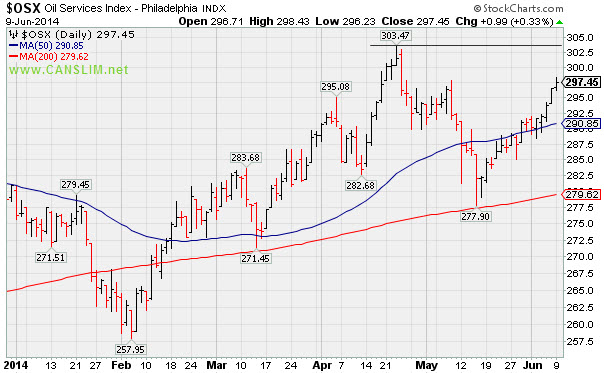
PICTURED: The Oil Services Index ($OSX +0.33%) tallied a 5th consecutive gain while approaching its April 2014 highs after finding support at its 200-day moving average (DMA) line.
| Oil Services |
$OSX |
297.45 |
+0.99 |
+0.33% |
+5.84% |
| Integrated Oil |
$XOI |
1,642.32 |
+1.53 |
+0.09% |
+9.26% |
| Semiconductor |
$SOX |
618.44 |
+1.19 |
+0.19% |
+15.59% |
| Networking |
$NWX |
341.79 |
+0.09 |
+0.03% |
+5.51% |
| Broker/Dealer |
$XBD |
159.22 |
+1.61 |
+1.02% |
-0.83% |
| Retail |
$RLX |
894.24 |
-1.25 |
-0.14% |
-4.85% |
| Gold & Silver |
$XAU |
86.43 |
-0.27 |
-0.31% |
+2.71% |
| Bank |
$BKX |
71.85 |
+1.03 |
+1.45% |
+3.74% |
| Biotech |
$BTK |
2,684.00 |
+21.48 |
+0.81% |
+15.17% |
|
|
|
 |
Finished Near Session Low After Hitting new 52-Week High
Kenneth J. Gruneisen - Passed the CAN SLIM® Master's Exam
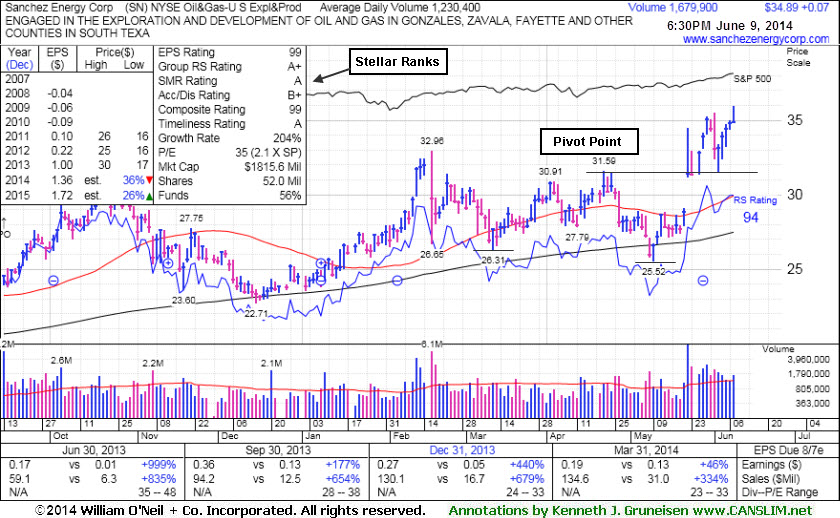
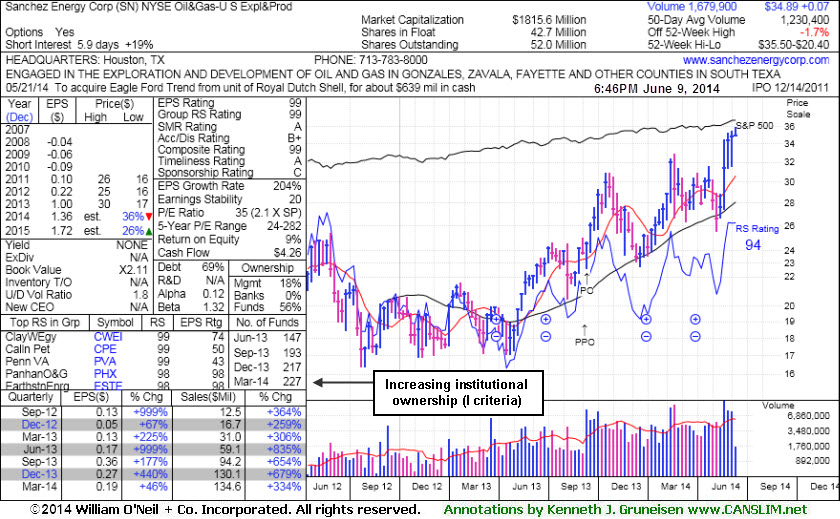
Sanchez Energy Corp (SN +$0.07 or +0.20% to $34.89) encountered distributional pressure and finished near the session low after touching a new 52-week high with today's 5th consecutive gain. Prior highs near $31-32 define support to watch on pullbacks. The high-ranked Oil & Gas firm last appeared in this FSU section on 5/22/14 with annotated graphs under the headline, "Finish Near Low a Sign of Distributional Pressure Following Gap Up and New High", after highlighted in yellow with pivot point cited based on its 4/22/14 high in the earlier mid-day report (read here).
It reported earnings +46% on +334% sales revenues for the Mar '14 quarter. Quarterly comparisons show strong sales revenues and earnings increases well above the +25% minimum guideline (C criteria). Annual earnings (A criteria) history showed losses in the years prior to its IPO in Dec '11, yet it has done well in the earnings department since and earned the highest possible Earnings Per Share Rating of 99. The number of top-rated funds owning its shares rose from 147 in Jun '13 to 227 in Mar '14, a reassuring sign concerning the I criteria.
|
|
|
Color Codes Explained :
Y - Better candidates highlighted by our
staff of experts.
G - Previously featured
in past reports as yellow but may no longer be buyable under the
guidelines.
***Last / Change / Volume data in this table is the closing quote data***
Symbol/Exchange
Company Name
Industry Group |
PRICE |
CHANGE
(%Change) |
Day High |
Volume
(% DAV)
(% 50 day avg vol) |
52 Wk Hi
% From Hi |
Featured
Date |
Price
Featured |
Pivot Featured |
|
Max Buy |
AFSI
-
NASDAQ
Amtrust Financial Svcs
INSURANCE - Property and; Casualty Insurance
|
$42.69
|
+0.35
0.83% |
$42.88
|
389,969
57.86% of 50 DAV
50 DAV is 674,000
|
$47.10
-9.36%
|
5/21/2014
|
$44.85
|
PP = $44.85
|
|
MB = $47.09
|
Most Recent Note - 6/6/2014 6:06:33 PM
G - Consolidating above its 50 DMA line. Disciplined investors always limit losses by selling any stock that falls more than -7% from their purchase price. See the latest FSU analysis for more details and new annotated graphs.
>>> FEATURED STOCK ARTICLE : Halted Slide at 50-Day Moving Average After Distributional Pressure - 6/6/2014
View all notes |
Set NEW NOTE alert |
CANSLIM.net Company Profile |
SEC
News |
Chart |
Request a new note
C
A N
S L
I M


|
AL
-
NYSE
Air Lease Corp Cl A
DIVERSIFIED SERVICES - Rental and Leasing Services
|
$42.32
|
-0.12
-0.28% |
$42.84
|
1,128,545
134.51% of 50 DAV
50 DAV is 839,000
|
$42.89
-1.33%
|
5/9/2014
|
$38.27
|
PP = $38.25
|
|
MB = $40.16
|
Most Recent Note - 6/5/2014 12:24:20 PM
G - Hitting a new 52-week high today after stubbornly holding its ground following volume-driven gains. Prior highs near $40 define near-term support to watch on pullbacks.
>>> FEATURED STOCK ARTICLE : Finished Near Session Low and Below "Max Buy" Level After Gain on Volume - 5/28/2014
View all notes |
Set NEW NOTE alert |
CANSLIM.net Company Profile |
SEC
News |
Chart |
Request a new note
C
A N
S L
I M
|
EQM
-
NYSE
E Q T Midstream Partners
ENERGY - Oil and Gas Pipelines
|
$89.57
|
-0.19
-0.21% |
$89.90
|
420,959
173.95% of 50 DAV
50 DAV is 242,000
|
$89.82
-0.28%
|
12/12/2013
|
$53.17
|
PP = $56.51
|
|
MB = $59.34
|
Most Recent Note - 6/6/2014 6:18:36 PM
G - Hit yet another new 52-week high with today's 9th consecutive gain on below average volume. Fundamental concerns remain after 2 consecutive sub par quarters below the +25% minimum earnings guideline.
>>> FEATURED STOCK ARTICLE : New Highs Again With Light Volume Behind Streak of Gains - 6/4/2014
View all notes |
Set NEW NOTE alert |
CANSLIM.net Company Profile |
SEC
News |
Chart |
Request a new note
C
A N
S L
I M
|
GRFS
-
NASDAQ
Grifols Sa Ads
Medical-Ethical Drugs
|
$46.44
|
+1.07
2.36% |
$46.56
|
2,545,108
392.76% of 50 DAV
50 DAV is 648,000
|
$45.48
2.11%
|
5/15/2014
|
$41.14
|
PP = $43.55
|
|
MB = $45.73
|
 Most Recent Note - 6/9/2014 6:57:47 PM
G - Color code is changed to green after finishing near the session high and above its "max buy" level with today's 5th consecutive gain on above average and ever-increasing volume. Prior highs near $43 area define near-term support to watch on pullbacks.
>>> FEATURED STOCK ARTICLE : Finding Support Above 50-Day Moving Average - 6/3/2014
View all notes |
Set NEW NOTE alert |
CANSLIM.net Company Profile |
SEC
News |
Chart |
Request a new note
C
A N
S L
I M
|
ICON
-
NASDAQ
Iconix Brand Group Inc
CONSUMER NON-DURABLES - Textile - Apparel Footwear
|
$44.22
|
+0.08
0.18% |
$44.81
|
552,766
103.13% of 50 DAV
50 DAV is 536,000
|
$44.35
-0.29%
|
6/5/2014
|
$43.54
|
PP = $43.44
|
|
MB = $45.61
|
Most Recent Note - 6/5/2014 6:40:25 PM
Y - Hit a new all-time high today with a gain on average volume. New pivot point is cited based on its 5/01/14 high plus 10 cents. The gain on the prior session was backed by +50% above average volume as it rallied for a new high close and triggered a new (or add-on) technical buy signal. See the latest FSU analysis for more details and new annotated graphs.
>>> FEATURED STOCK ARTICLE : Gain With Above Average Volume an Encouraging Sign - 6/5/2014
View all notes |
Set NEW NOTE alert |
CANSLIM.net Company Profile |
SEC
News |
Chart |
Request a new note
C
A N
S L
I M
|
Symbol/Exchange
Company Name
Industry Group |
PRICE |
CHANGE
(%Change) |
Day High |
Volume
(% DAV)
(% 50 day avg vol) |
52 Wk Hi
% From Hi |
Featured
Date |
Price
Featured |
Pivot Featured |
|
Max Buy |
KORS
-
NYSE
Michael Kors Hldgs Ltd
RETAIL - Apparel Stores
|
$93.93
|
-0.40
-0.42% |
$94.57
|
1,753,820
65.00% of 50 DAV
50 DAV is 2,698,000
|
$101.04
-7.04%
|
5/27/2014
|
$96.70
|
PP = $101.14
|
|
MB = $106.20
|
Most Recent Note - 6/4/2014 6:12:02 PM
Y - Relative Strength rating has improved to 83, above the 80+ minimum guideline for buy candidates. Finding support at its 50 DMA line, but deterioration below that important short-term average would raise more concerns and trigger a technical sell signal. A breakout above the pivot point with at least +40% above average volume is needed to trigger a new technical buy signal.
>>> FEATURED STOCK ARTICLE : Earnings News May Prompt Volume and Volatility - 5/27/2014
View all notes |
Set NEW NOTE alert |
CANSLIM.net Company Profile |
SEC
News |
Chart |
Request a new note
C
A N
S L
I M
|
PANW
-
NYSE
Palo Alto Networks
Computer Sftwr-Security
|
$77.40
|
-0.58
-0.74% |
$78.64
|
1,239,148
61.47% of 50 DAV
50 DAV is 2,016,000
|
$80.84
-4.26%
|
5/29/2014
|
$75.95
|
PP = $72.50
|
|
MB = $76.13
|
Most Recent Note - 6/5/2014 1:05:00 PM
G - Color code is changed to green after rallying above its "max buy" level with today's gain. Little overhead supply remains up through the $80 level. Prior highs near $72 define important support above its 50 DMA line.
>>> FEATURED STOCK ARTICLE : Finish Near Session Low Following Gap Up From Double Bottom Base - 5/29/2014
View all notes |
Set NEW NOTE alert |
CANSLIM.net Company Profile |
SEC
News |
Chart |
Request a new note
C
A N
S L
I M
|
SN
-
NYSE
Sanchez Energy Corp
ENERGY - Independent Oil and Gas
|
$34.89
|
+0.07
0.20% |
$35.93
|
1,679,908
136.58% of 50 DAV
50 DAV is 1,230,000
|
$35.50
-1.72%
|
5/22/2014
|
$33.00
|
PP = $31.59
|
|
MB = $33.17
|
Most Recent Note - 6/9/2014 6:55:34 PM
G - Encountered distributional pressure and finished near the session low after hitting a new 52-week high with today's 5th consecutive gain. Prior highs near $31-32 define support to watch on pullbacks. See the latest FSU analysis for more details and new annotated graphs.
>>> FEATURED STOCK ARTICLE : Finished Near Session Low After Hitting new 52-Week High - 6/9/2014
View all notes |
Set NEW NOTE alert |
CANSLIM.net Company Profile |
SEC
News |
Chart |
Request a new note
C
A N
S L
I M
|
TRN
-
NYSE
Trinity Industries Inc
TRANSPORTATION - Railroads
|
$83.09
|
+0.25
0.30% |
$84.09
|
1,745,623
114.17% of 50 DAV
50 DAV is 1,529,000
|
$87.89
-5.46%
|
4/30/2014
|
$75.57
|
PP = $76.05
|
|
MB = $79.85
|
Most Recent Note - 6/6/2014 1:05:42 PM
G - Halted its slide after 5 consecutive losses and gapped up today. Prior highs in the $75-76 area coincide with its 50 DMA line ($76.48) defining important support to watch.
>>> FEATURED STOCK ARTICLE : Extended From Prior Base After +15% Rally in One Month - 6/2/2014
View all notes |
Set NEW NOTE alert |
CANSLIM.net Company Profile |
SEC
News |
Chart |
Request a new note
C
A N
S L
I M
|
WLK
-
NYSE
Westlake Chemical Corp
CHEMICALS - Specialty Chemicals
|
$81.93
|
-0.40
-0.49% |
$82.47
|
423,055
55.16% of 50 DAV
50 DAV is 767,000
|
$82.35
-0.51%
|
4/29/2014
|
$72.79
|
PP = $69.31
|
|
MB = $72.78
|
Most Recent Note - 6/4/2014 6:10:34 PM
G - Hit a new 52-week high with today's volume-driven gain. Recent lows near $73 define important near-term support to watch on pullbacks.
>>> FEATURED STOCK ARTICLE : Extended From Prior Base After 5 Weekly Gains - 5/30/2014
View all notes |
Set NEW NOTE alert |
CANSLIM.net Company Profile |
SEC
News |
Chart |
Request a new note
C
A N
S L
I M
|
Symbol/Exchange
Company Name
Industry Group |
PRICE |
CHANGE
(%Change) |
Day High |
Volume
(% DAV)
(% 50 day avg vol) |
52 Wk Hi
% From Hi |
Featured
Date |
Price
Featured |
Pivot Featured |
|
Max Buy |
|
|
|
THESE ARE NOT BUY RECOMMENDATIONS!
Comments contained in the body of this report are technical
opinions only. The material herein has been obtained
from sources believed to be reliable and accurate, however,
its accuracy and completeness cannot be guaranteed.
This site is not an investment advisor, hence it does
not endorse or recommend any securities or other investments.
Any recommendation contained in this report may not
be suitable for all investors and it is not to be deemed
an offer or solicitation on our part with respect to
the purchase or sale of any securities. All trademarks,
service marks and trade names appearing in this report
are the property of their respective owners, and are
likewise used for identification purposes only.
This report is a service available
only to active Paid Premium Members.
You may opt-out of receiving report notifications
at any time. Questions or comments may be submitted
by writing to Premium Membership Services 665 S.E. 10 Street, Suite 201 Deerfield Beach, FL 33441-5634 or by calling 1-800-965-8307
or 954-785-1121.
|
|
|

