You are not logged in.
This means you
CAN ONLY VIEW reports that were published prior to Monday, April 14, 2025.
You
MUST UPGRADE YOUR MEMBERSHIP if you want to see any current reports.
AFTER MARKET UPDATE - WEDNESDAY, JUNE 5TH, 2013
Previous After Market Report Next After Market Report >>>
|
|
|
|
DOW |
-216.95 |
14,960.59 |
-1.43% |
|
Volume |
741,011,220 |
-6% |
|
Volume |
1,754,001,960 |
-1% |
|
NASDAQ |
-43.78 |
3,401.48 |
-1.27% |
|
Advancers |
563 |
18% |
|
Advancers |
570 |
22% |
|
S&P 500 |
-22.48 |
1,608.90 |
-1.38% |
|
Decliners |
2,478 |
79% |
|
Decliners |
1,947 |
75% |
|
Russell 2000 |
-13.81 |
968.16 |
-1.41% |
|
52 Wk Highs |
25 |
|
|
52 Wk Highs |
47 |
|
|
S&P 600 |
-7.08 |
544.56 |
-1.28% |
|
52 Wk Lows |
82 |
|
|
52 Wk Lows |
29 |
|
|
 |
Major Averages Endure More Losses
Kenneth J. Gruneisen - Passed the CAN SLIM® Master's Exam
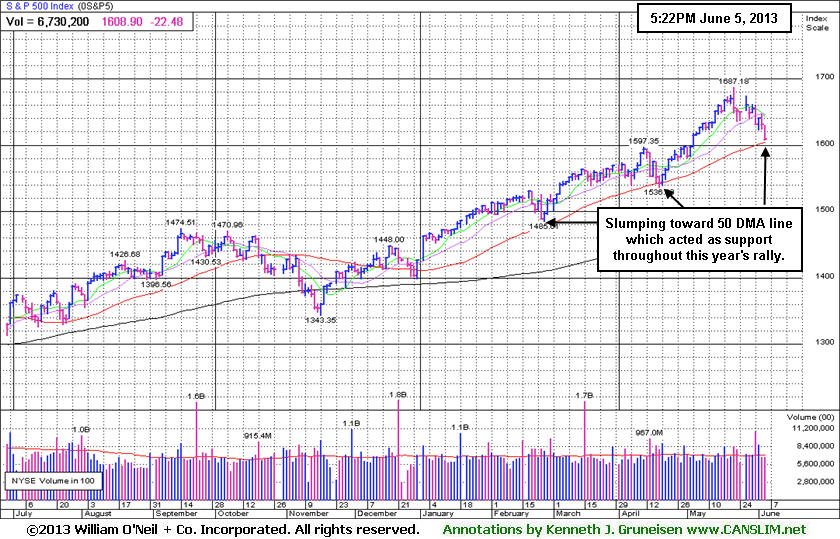
The major averages retreated for a second day due to disappointing economic data and amid the Fed's continued debate over the future of its bond purchases. Wednesday's volume totals were reported slightly lower than the prior session totals on the Nasdaq exchange and on the NYSE, which was a slightly reassuring sign that institutional investors were not increasing their selling efforts even while the market rally has encountered distributional pressure. Breadth was negative as decliners led advancers by a 9-2 margin on the NYSE and by a 7-2 margin on the Nasdaq exchange. There were 9 high-ranked companies from the CANSLIM.net Leaders List making new 52-week highs and appearing on the CANSLIM.net BreakOuts Page, down abruptly from the prior session total of 41 stocks. New 52-week lows outnumbered new 52-week highs on the NYSE, meanwhile on the Nasdaq exchange new 52-week highs still outnumbered new 52-week lows. Only 1 of the 12 high-ranked companies currently included on the Featured Stocks Page posted a gain on the decisively negative session.
An ADP report showed private sector hiring continued to slow down in May and factory orders for April came in weaker-than-expected. Later in the session, the Beige Book revealed the U.S. economy is growing at a "modest to moderate" pace, but hiring remains sluggish in seven of the 12 Fed districts.
Overall, every S&P 500 sector declined. Materials firms including The Mosaic Co (MOS -3.03%) and Financial firms including Citigroup Inc (C -2.34%) gave up the most ground. Industrial stocks were also notable laggards. Fastenal Co (FAST -6.32%) led the group lower after the company posted disappointing monthly sales figures.
In fixed-income, Treasury yields declined. The 10-year note was up 17/32 to yield 2.08% and the 30-year bond gained over a full point to yield 3.24%.
The market (M criteria) uptrend clearly came under pressure as May drew to a close, and the ongoing weakness is threatening to become a full blown "correction". However, lighter volume totals are a sign that institutional volume has not been intensifying while the major averages have retreated. As more damaging losses mount in the broader market this can serve as a reminder for investors to be protective of any gains and to limit losses by being especially watchful for any individual issues flashing technical sell signals. It is vitally important to your success with the fact-based investment system to reduce exposure and preserve cash during market downdrafts.
As always, watch upcoming CANSLIM.net reports for new action-worthy leaders best matching the winning models to be covered as they emerge and then included on the Featured Stocks Page - with our Certified experts' latest notes and links to additional resources including detailed analysis with annotated graphs. The Premium Member Homepage - includes "dynamic archives" to all prior pay reports published. Watch for an announcement via email concerning the next WEBCAST.
PICTURED: The S&P 500 Index is slumping toward its 50-day moving average (DMA) line. That important short-term average acted as support during pullbacks earlier this year, however any more damaging violation would raise concerns and prompt investors to reduce their exposure to stocks.
|
 Kenneth J. Gruneisen started out as a licensed stockbroker in August 1987, a couple of months prior to the historic stock market crash that took the Dow Jones Industrial Average down -22.6% in a single day. He has published daily fact-based fundamental and technical analysis on high-ranked stocks online for two decades. Through FACTBASEDINVESTING.COM, Kenneth provides educational articles, news, market commentary, and other information regarding proven investment systems that work in good times and bad.
Comments contained in the body of this report are technical opinions only and are not necessarily those of Gruneisen Growth Corp. The material herein has been obtained from sources believed to be reliable and accurate, however, its accuracy and completeness cannot be guaranteed. Our firm, employees, and customers may effect transactions, including transactions contrary to any recommendation herein, or have positions in the securities mentioned herein or options with respect thereto. Any recommendation contained in this report may not be suitable for all investors and it is not to be deemed an offer or solicitation on our part with respect to the purchase or sale of any securities. |
|
 |
Financial, Tech, Retail, Healthcare and Energy Groups Fell
Kenneth J. Gruneisen - Passed the CAN SLIM® Master's Exam
The Broker/Dealer Index ($XBD -2.31%) and Bank Index ($BKX -1.72%) both suffered losses and weighed on the major averages on Wednesday's mostly negative session. The Retail Index ($RLX -1.10%) also fell, and their were unanimous losses in the tech sector as the Biotechnology Index ($BTK -2.54%) and the Semiconductor Index ($SOX -1.52%) outpaced the Internet Index ($IIX -0.82%) and the Networking Index ($NWX -0.34%) to the downside. The Healthcare Index ($HMO -1.98%) was weaker, and losses in energy-related shares weighed on the Integrated Oil Index ($XOI -1.42%) and the Oil Services Index ($OSX -0.52%). The Gold & Silver Index ($XAU +0.24%) was a standout as it eked out a small gain.
Charts courtesy www.stockcharts.com
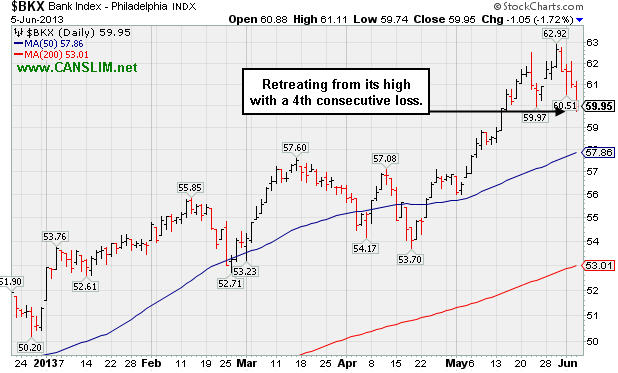
PICTURED: The Bank Index ($BKX -1.72%) has retreated from its highs with a streak of 4 consecutive losses.
| Oil Services |
$OSX |
252.52 |
-1.32 |
-0.52% |
+14.70% |
| Healthcare |
$HMO |
3,002.26 |
-60.59 |
-1.98% |
+19.41% |
| Integrated Oil |
$XOI |
1,369.04 |
-19.71 |
-1.42% |
+10.24% |
| Semiconductor |
$SOX |
465.29 |
-7.16 |
-1.52% |
+21.15% |
| Networking |
$NWX |
252.04 |
-0.87 |
-0.34% |
+11.25% |
| Internet |
$IIX |
373.46 |
-3.08 |
-0.82% |
+14.21% |
| Broker/Dealer |
$XBD |
119.75 |
-2.83 |
-2.31% |
+26.95% |
| Retail |
$RLX |
771.73 |
-8.57 |
-1.10% |
+18.17% |
| Gold & Silver |
$XAU |
108.49 |
+0.26 |
+0.24% |
-34.49% |
| Bank |
$BKX |
59.95 |
-1.05 |
-1.72% |
+16.91% |
| Biotech |
$BTK |
1,873.08 |
-48.75 |
-2.54% |
+21.08% |
|
|
|
 |
Following 50-Day Moving Average Violation More Damage Mounts
Kenneth J. Gruneisen - Passed the CAN SLIM® Master's Exam
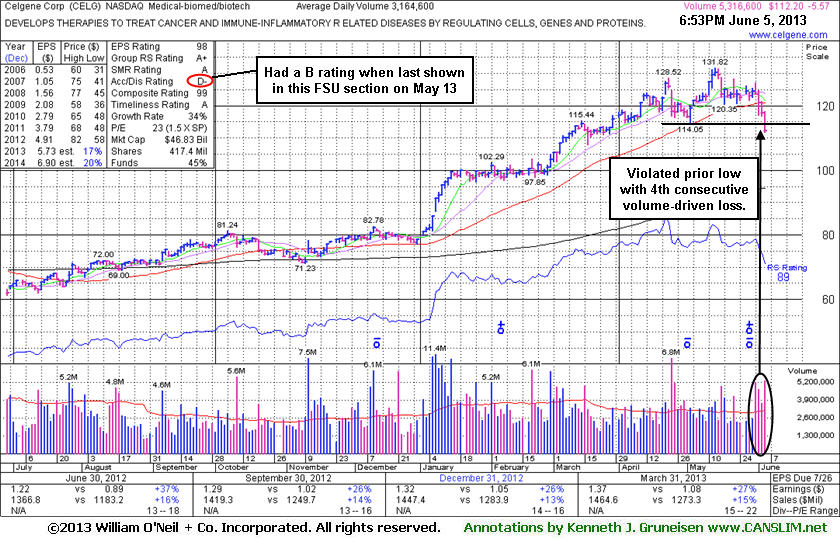
Celgene Corp (CELG +$2.20 or +1.73% to $129.66) violated the prior low (5/02/13 low $114.05) with another damaging loss today raising more serious concerns and triggering additional technical sell signals after its slump below its 50-day moving average (DMA) line with consecutive losses backed by above average volume already triggered an earlier technical sell signal. The stock's Accumulation/ Distribution Rating has slumped to a D+ today, down from a B when CELG had rallied to new highs immediately following its last appearance in this FSU section on 5/13/13 with an annotated graph under the headline, "Extended From Base After Tallying +57% Gain in 6-Months". The technical sell signals coupled with weak action in the broader market (M criteria) are signs that serve as a reminder to reduce market exposure and preserve cash. Any stock that is sold can always be bought back later if strength returns. It will be dropped from the Featured Stocks list tonight.
While CELG may go on to consolidate and form a new base, a rebound above its 50 DMA line is obviously needed for its outlook to improve. CELG has maintained a strong earnings history (C and A criteria), and it recently reported earnings +27% on +15% sales revenues for the Mar '13 quarter. The number of top-rated funds owning its shares rose from 1,623 in Dec '11 to 1,834 in Mar '13, a reassuring trend concerning the I criteria. However, the company is already well-known by the institutional crowd, and that means that very few are likely to just be discovering it. Some have clearly decided to lock in profits from what this chart is telling us this week, whether it is due to concerns with respect to the broader market or the individual company. Since 3 out of 4 stocks follow the direction of the broader market averages (M criteria), chances may not be good for most stocks to make progress if the market falls into a more serious correction.
|
|
|
Color Codes Explained :
Y - Better candidates highlighted by our
staff of experts.
G - Previously featured
in past reports as yellow but may no longer be buyable under the
guidelines.
***Last / Change / Volume data in this table is the closing quote data***
Symbol/Exchange
Company Name
Industry Group |
PRICE |
CHANGE
(%Change) |
Day High |
Volume
(% DAV)
(% 50 day avg vol) |
52 Wk Hi
% From Hi |
Featured
Date |
Price
Featured |
Pivot Featured |
|
Max Buy |
AL
-
NYSE
Air Lease Corp Cl A
DIVERSIFIED SERVICES - Rental and Leasing Services
|
$27.15
|
-0.71
-2.55% |
$28.00
|
866,036
157.06% of 50 DAV
50 DAV is 551,400
|
$31.00
-12.42%
|
5/9/2013
|
$30.95
|
PP = $29.38
|
|
MB = $30.85
|
Most Recent Note - 6/4/2013 12:18:58 PM
G - Consolidating near its 50 DMA line now, it completed a Secondary Offering on 5/31/13. Often times companies attract additional institutional interest (I criteria) with the help of underwriters when Secondary Offerings are completed, however they can typically be a short-term hindrance to price progress.
>>> The latest Featured Stock Update with an annotated graph appeared on 5/30/2013. Click here.
View all notes |
Alert me of new notes |
CANSLIM.net Company Profile |
SEC |
Zacks Reports |
StockTalk |
News |
Chart |
Request a new note
C
A N
S L
I M


|
AMBA
-
NASDAQ
Ambarella Inc
ELECTRONICS - Semiconductor - Specialized
|
$16.65
|
+0.46
2.84% |
$17.74
|
4,063,092
478.86% of 50 DAV
50 DAV is 848,500
|
$17.90
-6.98%
|
5/6/2013
|
$15.31
|
PP = $16.10
|
|
MB = $16.91
|
 Most Recent Note - 6/5/2013 11:00:37 AM
Y - Gapped up today challenging its 52-week high and trading near its "max buy" level after reporting earnings +129% on +31% sales revenues for the April '13 quarter versus the year ago period. Its 50 DMA line ($14.53 now) defines important chart support to watch.
>>> The latest Featured Stock Update with an annotated graph appeared on 5/29/2013. Click here.
View all notes |
Alert me of new notes |
CANSLIM.net Company Profile |
SEC |
Zacks Reports |
StockTalk |
News |
Chart |
Request a new note
C
A N
S L
I M
|
CELG
-
NASDAQ
Celgene Corp
DRUGS - Drug Manufacturers - Major
|
$112.20
|
-5.57
-4.73% |
$118.15
|
5,320,155
168.11% of 50 DAV
50 DAV is 3,164,600
|
$131.82
-14.88%
|
3/27/2013
|
$113.24
|
PP = $115.54
|
|
MB = $121.32
|
Most Recent Note - 6/5/2013 7:23:29 PM
Sank deeper below its 50 DMA line with a 4th consecutive loss backed by above average volume. Triggered another more worrisome technical sell signal as it violated the prior low (5/02/13 low $114.05) defining important chart support. It will be dropped from the Featured Stocks list tonight. See the latest FSU analysis for more details and a new annotated graph.
>>> The latest Featured Stock Update with an annotated graph appeared on 6/5/2013. Click here.
View all notes |
Alert me of new notes |
CANSLIM.net Company Profile |
SEC |
Zacks Reports |
StockTalk |
News |
Chart |
Request a new note
C
A N
S L
I M
|
EQM
-
NYSE
E Q T Midstream Partners
ENERGY - Oil and Gas Pipelines
|
$45.44
|
-0.81
-1.75% |
$46.08
|
185,334
170.81% of 50 DAV
50 DAV is 108,500
|
$51.72
-12.14%
|
4/25/2013
|
$40.16
|
PP = $40.84
|
|
MB = $42.88
|
Most Recent Note - 6/4/2013 7:01:35 PM
G - Down with above average volume today, encountering distributional pressure. Retreating since a "negative reversal" on 5/28/13 at its 52-week high. Still well above its 50 DMA line defining important near-term chart support.
>>> The latest Featured Stock Update with an annotated graph appeared on 5/16/2013. Click here.
View all notes |
Alert me of new notes |
CANSLIM.net Company Profile |
SEC |
Zacks Reports |
StockTalk |
News |
Chart |
Request a new note
C
A N
S L
I M
|
FLT
-
NYSE
Fleetcor Technologies
DIVERSIFIED SERVICES - Business/Management Services
|
$84.13
|
-1.20
-1.41% |
$85.82
|
555,272
62.19% of 50 DAV
50 DAV is 892,800
|
$88.83
-5.29%
|
5/29/2013
|
$86.02
|
PP = $85.66
|
|
MB = $89.94
|
Most Recent Note - 5/31/2013 7:33:26 PM
Y- Was last noted in the mid-day report on 5/29/13 with a new pivot point cited based on its 5/03/13 high, and it rose from an advanced "3-weeks tight" base with a gain on the session backed by +56% above average volume. It may go on to produce more climactic gains, however this was a riskier "late-stage" base. See the latest FSU analysis for more details and a new annotated graph.
>>> The latest Featured Stock Update with an annotated graph appeared on 5/31/2013. Click here.
View all notes |
Alert me of new notes |
CANSLIM.net Company Profile |
SEC |
Zacks Reports |
StockTalk |
News |
Chart |
Request a new note
C
A N
S L
I M
|
Symbol/Exchange
Company Name
Industry Group |
PRICE |
CHANGE
(%Change) |
Day High |
Volume
(% DAV)
(% 50 day avg vol) |
52 Wk Hi
% From Hi |
Featured
Date |
Price
Featured |
Pivot Featured |
|
Max Buy |
LOPE
-
NASDAQ
Grand Canyon Education
DIVERSIFIED SERVICES - Education and; Training Services
|
$31.50
|
-0.09
-0.28% |
$32.10
|
212,613
52.82% of 50 DAV
50 DAV is 402,500
|
$34.07
-7.54%
|
5/10/2013
|
$29.03
|
PP = $27.28
|
|
MB = $28.64
|
Most Recent Note - 6/3/2013 5:43:15 PM
G - Volume totals have been cooling while holding its ground stubbornly perched at its 52-week high, very extended from its previous base. Prior highs in the $27 area define support to watch on pullbacks. Gains of greater than +20% in the first 2-3 weeks following its "breakaway gap" suggest holding for a minimum of 8 week under the fact-based investment system's rules. See the latest FSU analysis for more details and a new annotated graph.
>>> The latest Featured Stock Update with an annotated graph appeared on 6/3/2013. Click here.
View all notes |
Alert me of new notes |
CANSLIM.net Company Profile |
SEC |
Zacks Reports |
StockTalk |
News |
Chart |
Request a new note
C
A N
S L
I M
|
MRLN
-
NASDAQ
Marlin Business Services
DIVERSIFIED SERVICES - Rental and Leasing Services
|
$23.01
|
-0.17
-0.73% |
$23.59
|
44,104
189.29% of 50 DAV
50 DAV is 23,300
|
$25.97
-11.40%
|
3/15/2013
|
$22.29
|
PP = $23.18
|
|
MB = $24.34
|
Most Recent Note - 6/3/2013 2:02:46 PM
G - Slumping under its 50 DMA line and its color code is changed to green. The recent low ($21.49 on 5/23/13) defines important near-term support below that short-term average where a violation would raise more serious concerns.
>>> The latest Featured Stock Update with an annotated graph appeared on 5/23/2013. Click here.
View all notes |
Alert me of new notes |
CANSLIM.net Company Profile |
SEC |
Zacks Reports |
StockTalk |
News |
Chart |
Request a new note
C
A N
S L
I M
|
NSM
-
NYSE
Nationstar Mtg Hldgs Inc
FINANCIAL SERVICES - Credit Services
|
$40.65
|
-0.98
-2.35% |
$41.32
|
880,076
70.49% of 50 DAV
50 DAV is 1,248,500
|
$46.91
-13.34%
|
5/7/2013
|
$39.71
|
PP = $42.34
|
|
MB = $44.46
|
Most Recent Note - 6/3/2013 4:30:52 PM
Y - Volume was below average behind today's gain following a spurt of damaging losses marked by above average volume. Weak action recently negated its prior breakout and raised concerns. Disciplined investors always limit losses if any stock falls more than -7% from their purchase price.
>>> The latest Featured Stock Update with an annotated graph appeared on 5/28/2013. Click here.
View all notes |
Alert me of new notes |
CANSLIM.net Company Profile |
SEC |
Zacks Reports |
StockTalk |
News |
Chart |
Request a new note
C
A N
S L
I M
|
PRAA
-
NASDAQ
Portfolio Recovery Assoc
DIVERSIFIED SERVICES - Business/Management Services
|
$149.24
|
-1.17
-0.78% |
$151.29
|
54,170
78.39% of 50 DAV
50 DAV is 69,100
|
$153.85
-3.00%
|
5/1/2013
|
$130.77
|
PP = $127.88
|
|
MB = $134.27
|
Most Recent Note - 5/30/2013 4:55:19 PM
G - Edged higher with below average volume today for a 4th consecutive gain and its best-ever close. Very extended from prior highs in the $127 area and well above its 50 DMA line defining important chart support.
>>> The latest Featured Stock Update with an annotated graph appeared on 5/22/2013. Click here.
View all notes |
Alert me of new notes |
CANSLIM.net Company Profile |
SEC |
Zacks Reports |
StockTalk |
News |
Chart |
Request a new note
C
A N
S L
I M
|
PRLB
-
NYSE
Proto Labs Inc
MANUFACTURING - Small Tools and Accessories
|
$51.52
|
-1.48
-2.79% |
$53.08
|
210,389
38.46% of 50 DAV
50 DAV is 547,000
|
$59.84
-13.90%
|
5/3/2013
|
$54.77
|
PP = $54.01
|
|
MB = $56.71
|
Most Recent Note - 6/3/2013 2:10:12 PM
Y - Pulling back again today on light volume. Stayed well above its 50 DMA line during its recent consolidation, but a violation may trigger a technical sell signal.
>>> The latest Featured Stock Update with an annotated graph appeared on 5/24/2013. Click here.
View all notes |
Alert me of new notes |
CANSLIM.net Company Profile |
SEC |
Zacks Reports |
StockTalk |
News |
Chart |
Request a new note
C
A N
S L
I M
|
Symbol/Exchange
Company Name
Industry Group |
PRICE |
CHANGE
(%Change) |
Day High |
Volume
(% DAV)
(% 50 day avg vol) |
52 Wk Hi
% From Hi |
Featured
Date |
Price
Featured |
Pivot Featured |
|
Max Buy |
RRTS
-
NYSE
Roadrunner Trans Systems
TRANSPORTATION - Air Delivery and Freight Service
|
$27.13
|
-0.64
-2.30% |
$27.78
|
128,740
61.60% of 50 DAV
50 DAV is 209,000
|
$28.24
-3.93%
|
4/3/2013
|
$22.77
|
PP = $23.75
|
|
MB = $24.94
|
Most Recent Note - 6/4/2013 6:54:11 PM
G - Volume totals have been cooling while hovering at all-time highs. Fundamental concerns were raised by its sub par earnings increase in the Mar '13 quarter, below the +25% minimum guideline (C criteria). See the latest FSU analysis for more details and a new annotated graph.
>>> The latest Featured Stock Update with an annotated graph appeared on 6/4/2013. Click here.
View all notes |
Alert me of new notes |
CANSLIM.net Company Profile |
SEC |
Zacks Reports |
StockTalk |
News |
Chart |
Request a new note
C
A N
S L
I M
|
VRX
-
NYSE
Valeant Pharmaceuticals
DRUGS - Drug Manufacturers - Other
|
$84.16
|
-1.02
-1.20% |
$87.19
|
1,627,664
88.55% of 50 DAV
50 DAV is 1,838,200
|
$96.25
-12.56%
|
4/30/2013
|
$60.24
|
PP = $76.66
|
|
MB = $80.49
|
Most Recent Note - 6/4/2013 6:56:15 PM
G- Ended near the session low with a loss on average volume. It is extended from prior highs and prior reports cautioned - "Sub par earnings for the Mar '13 quarter below the +25% minimum guideline (C criteria) raised fundamental concerns."
>>> The latest Featured Stock Update with an annotated graph appeared on 5/17/2013. Click here.
View all notes |
Alert me of new notes |
CANSLIM.net Company Profile |
SEC |
Zacks Reports |
StockTalk |
News |
Chart |
Request a new note
C
A N
S L
I M
|
|
|
|
THESE ARE NOT BUY RECOMMENDATIONS!
Comments contained in the body of this report are technical
opinions only. The material herein has been obtained
from sources believed to be reliable and accurate, however,
its accuracy and completeness cannot be guaranteed.
This site is not an investment advisor, hence it does
not endorse or recommend any securities or other investments.
Any recommendation contained in this report may not
be suitable for all investors and it is not to be deemed
an offer or solicitation on our part with respect to
the purchase or sale of any securities. All trademarks,
service marks and trade names appearing in this report
are the property of their respective owners, and are
likewise used for identification purposes only.
This report is a service available
only to active Paid Premium Members.
You may opt-out of receiving report notifications
at any time. Questions or comments may be submitted
by writing to Premium Membership Services 665 S.E. 10 Street, Suite 201 Deerfield Beach, FL 33441-5634 or by calling 1-800-965-8307
or 954-785-1121.
|
|
|

