You are not logged in.
This means you
CAN ONLY VIEW reports that were published prior to Monday, April 14, 2025.
You
MUST UPGRADE YOUR MEMBERSHIP if you want to see any current reports.
AFTER MARKET UPDATE - WEDNESDAY, JUNE 4TH, 2014
Previous After Market Report Next After Market Report >>>
|
|
|
|
DOW |
+15.19 |
16,737.53 |
+0.09% |
|
Volume |
578,785,140 |
-10% |
|
Volume |
1,500,963,730 |
-5% |
|
NASDAQ |
+17.56 |
4,251.64 |
+0.41% |
|
Advancers |
1,592 |
50% |
|
Advancers |
1,507 |
54% |
|
S&P 500 |
+3.64 |
1,927.88 |
+0.19% |
|
Decliners |
1,474 |
46% |
|
Decliners |
1,216 |
43% |
|
Russell 2000 |
+5.07 |
1,131.22 |
+0.45% |
|
52 Wk Highs |
175 |
|
|
52 Wk Highs |
64 |
|
|
S&P 600 |
+2.82 |
652.24 |
+0.43% |
|
52 Wk Lows |
23 |
|
|
52 Wk Lows |
65 |
|
|
 |
Major Averages Quietly Edged Higher
Kenneth J. Gruneisen - Passed the CAN SLIM® Master's Exam
The major averages edged higher on Wednesday. The volume was reported lighter than the prior session totals on the NYSE and on the Nasdaq exchange. Advancers led decliners by a 5-4 margin on Nasdaq exchange and by a narrower margin on the NYSE. There were 62 high-ranked companies from the CANSLIM.net Leaders List that made new 52-week highs and appeared on the CANSLIM.net BreakOuts Page, up from the total of 57 stocks on the prior session. New 52-week highs easily outnumbered new 52-week lows on the NYSE while the totals were nearly even on the Nasdaq exchange. There were gains for 7 of the 10 high-ranked companies currently included on the Featured Stocks Page. The S&P 500 Index and Dow Jones Industrial Average both recently surged into new high territory coupled with an expansion in leadership (new 52-week highs) that helped signal that the market direction (M criteria) is in a "confirmed uptrend". Any new buying efforts should be selective and focused in stocks meeting all key criteria of the fact-based investment system.
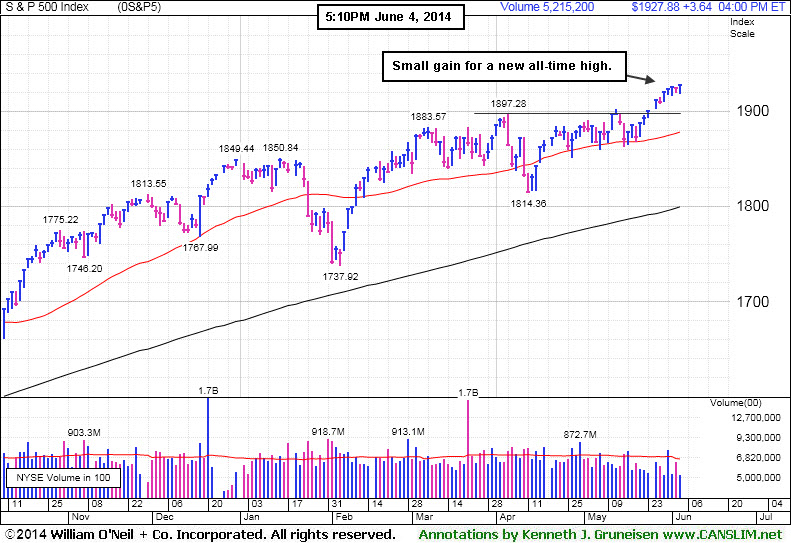
PICTURED: The s&p Index is consolidating -3.1% off its 2014 high.
The major averages finished a choppy trading session in positive territory as investors weighed mixed data on the U.S. economy. Before the open, ADP reported 179,000 workers added to private payrolls in May, below the consensus projection of 210,000. A separate release revealed service sector activity expanded at a faster-than-expected pace last month. The Fed's Beige Book report said economic conditions continued to improve in all 12 districts. Market gains also appeared to be muted by investor caution ahead of Thursday's ECB rate decision and Friday’s U.S. employment report.
In M&A news, Protective Life (PL +18.1%) after agreeing to be acquired by Japanese life insurer Dai-Ichi for $5.7 billion. On the earnings front, spirit maker Brown-Forman (BFB +0.3%) following its better-than-expected quarterly results.
Consumer discretionary was the best performing sector in the S&P 500 today. Walgreen's (WAG +4.2%) after posting same-store sales above analyst projections. Telecom was down the most with AT&T (T -0.4%).
Treasuries were little changed on the session. Benchmark 10-year notes were down 1/32 to yield 2.60%.
The CANSLIM.net Featured Stocks Page shows the most action-worthy candidates and their latest notes and a Headline Link directs members to the latest detailed analysis with data-packed graphs annotated by a Certified expert along with links to additional resources. The Premium Member Homepage includes "dynamic archives" to all prior pay reports published. Watch for an announcement via email concerning the next WEBCAST.
|
 Kenneth J. Gruneisen started out as a licensed stockbroker in August 1987, a couple of months prior to the historic stock market crash that took the Dow Jones Industrial Average down -22.6% in a single day. He has published daily fact-based fundamental and technical analysis on high-ranked stocks online for two decades. Through FACTBASEDINVESTING.COM, Kenneth provides educational articles, news, market commentary, and other information regarding proven investment systems that work in good times and bad.
Comments contained in the body of this report are technical opinions only and are not necessarily those of Gruneisen Growth Corp. The material herein has been obtained from sources believed to be reliable and accurate, however, its accuracy and completeness cannot be guaranteed. Our firm, employees, and customers may effect transactions, including transactions contrary to any recommendation herein, or have positions in the securities mentioned herein or options with respect thereto. Any recommendation contained in this report may not be suitable for all investors and it is not to be deemed an offer or solicitation on our part with respect to the purchase or sale of any securities. |
|
 |
Broker/Dealer and Biotech Indexes Led Group Gainers
Kenneth J. Gruneisen - Passed the CAN SLIM® Master's Exam
The Broker/Dealer Index ($XBD +1.03%) posted a gain while the Bank Index ($BKX +0.04%) finished flat. The Biotechnology Index ($BTK +1.41%) led the tech sector higher while the Semiconductor Index ($SOX +0.45%) posted a smaller gain, but the Networking Index ($NWX -0.16%) finished the session slightly in the red. The Retail Index ($RLX +0.30%) posted a small gain. Commodity-linked groups were little changed as the Gold & Silver Index ($XAU +0.07%) and the Oil Services Index ($OSX +0.12%) finished flat.
Charts courtesy www.stockcharts.com
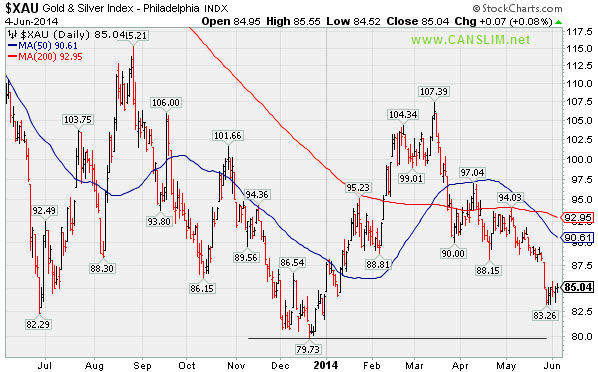
PICTURED: The Gold & Silver Index ($XAU +0.07%) is below its 50-day and 200-day moving average (DMA) lines while recently slumping near its December 2013 lows.
| Oil Services |
$OSX |
291.99 |
+0.35 |
+0.12% |
+3.90% |
| Integrated Oil |
$XOI |
1,619.18 |
-8.83 |
-0.54% |
+7.72% |
| Semiconductor |
$SOX |
611.14 |
+2.71 |
+0.45% |
+14.23% |
| Networking |
$NWX |
331.74 |
-0.54 |
-0.16% |
+2.41% |
| Broker/Dealer |
$XBD |
153.90 |
+1.57 |
+1.03% |
-4.15% |
| Retail |
$RLX |
878.71 |
+2.64 |
+0.30% |
-6.50% |
| Gold & Silver |
$XAU |
85.04 |
+0.06 |
+0.07% |
+1.06% |
| Bank |
$BKX |
69.55 |
+0.03 |
+0.04% |
+0.42% |
| Biotech |
$BTK |
2,635.76 |
+36.67 |
+1.41% |
+13.10% |
|
|
|
 |
New Highs Again With Light Volume Behind Streak of Gains
Kenneth J. Gruneisen - Passed the CAN SLIM® Master's Exam
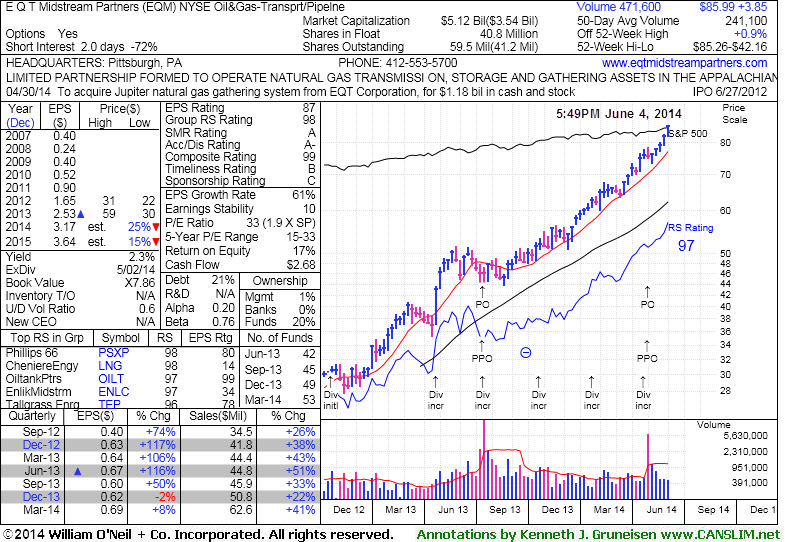
E Q T Midstream Partners (EQM +$0.95 or +1.12% to $85.99) hit yet another new 52-week high with today's 7th consecutive gain on below average volume. It completed a new Public Offering of 10.75 Million common units on 5/01/14. Fundamental concerns remain after 2 consecutive sub par quarters below the +25% minimum earnings guideline.
Its last appearance in this FSU section was on 5/16/14 under the headline, "Best Ever Close With Light Volume Gain". It is up +61.7% since first highlighted in yellow in the 12/12/13 mid-day report (read here) with pivot point based on its 11/18/13 high plus 10 cents. The fact-based system suggests watching for technical sell signals rather than selling purely on fundmentals, yet is wise to sometimes lock in gains at the +20% level. For those watching it and still giving it the benefit of the doubt, prior highs in the $78 area define near-term support above its 50-day moving average (DMA) line ($75.70) where violations may trigger technical sell signals.
It completed a new Public Offering on 7/16/13, then made gradual progress afterward. This MLP in the Natural Gas business has seen the number of top-rated funds owning its shares rise from 20 in Jun '12 to 53 in Mar '14, a reassuring sign concerning the I criteria. Its Up/Down Volume Ratio of 0.6 is an unbiased indication its shares have been under distributional over the past 50 days.

|
|
|
Color Codes Explained :
Y - Better candidates highlighted by our
staff of experts.
G - Previously featured
in past reports as yellow but may no longer be buyable under the
guidelines.
***Last / Change / Volume data in this table is the closing quote data***
Symbol/Exchange
Company Name
Industry Group |
PRICE |
CHANGE
(%Change) |
Day High |
Volume
(% DAV)
(% 50 day avg vol) |
52 Wk Hi
% From Hi |
Featured
Date |
Price
Featured |
Pivot Featured |
|
Max Buy |
AFSI
-
NASDAQ
Amtrust Financial Svcs
INSURANCE - Property and; Casualty Insurance
|
$42.16
|
+0.67
1.61% |
$42.68
|
573,882
84.89% of 50 DAV
50 DAV is 676,000
|
$47.10
-10.49%
|
5/21/2014
|
$44.85
|
PP = $44.85
|
|
MB = $47.09
|
Most Recent Note - 6/2/2014 6:34:47 PM
G - Finished near the session high today after testing support at its 50 DMA line but tallied a 6th consecutive loss. Disciplined investors always limit losses by selling any stock that falls more than -7% from their purchase price.
>>> FEATURED STOCK ARTICLE : Finished Strong With Gain From Advanced Base Pattern - 5/21/2014
View all notes |
Set NEW NOTE alert |
CANSLIM.net Company Profile |
SEC
News |
Chart |
Request a new note
C
A N
S L
I M


|
AL
-
NYSE
Air Lease Corp Cl A
DIVERSIFIED SERVICES - Rental and Leasing Services
|
$41.20
|
-0.32
-0.77% |
$41.73
|
1,146,019
144.88% of 50 DAV
50 DAV is 791,000
|
$42.12
-2.18%
|
5/9/2014
|
$38.27
|
PP = $38.25
|
|
MB = $40.16
|
Most Recent Note - 6/3/2014 5:42:34 PM
G - Small loss today broke a streak of 7 consecutive gains into new 52-week high territory. Prior highs near $40 define near-term support to watch on pullbacks.
>>> FEATURED STOCK ARTICLE : Finished Near Session Low and Below "Max Buy" Level After Gain on Volume - 5/28/2014
View all notes |
Set NEW NOTE alert |
CANSLIM.net Company Profile |
SEC
News |
Chart |
Request a new note
C
A N
S L
I M
|
EQM
-
NYSE
E Q T Midstream Partners
ENERGY - Oil and Gas Pipelines
|
$85.99
|
+0.95
1.12% |
$86.22
|
124,123
51.50% of 50 DAV
50 DAV is 241,000
|
$85.26
0.86%
|
12/12/2013
|
$53.17
|
PP = $56.51
|
|
MB = $59.34
|
 Most Recent Note - 6/4/2014 6:08:52 PM
G - Hit yet another new 52-week high with today's 7th consecutive gain on below average volume. Fundamental concerns remain after 2 consecutive sub par quarters below the +25% minimum earnings guideline. See the latest FSU analysis for more details and new annotated graphs.
>>> FEATURED STOCK ARTICLE : New Highs Again With Light Volume Behind Streak of Gains - 6/4/2014
View all notes |
Set NEW NOTE alert |
CANSLIM.net Company Profile |
SEC
News |
Chart |
Request a new note
C
A N
S L
I M
|
GRFS
-
NASDAQ
Grifols Sa Ads
Medical-Ethical Drugs
|
$42.56
|
+0.57
1.36% |
$43.06
|
1,163,469
189.80% of 50 DAV
50 DAV is 613,000
|
$43.50
-2.16%
|
5/15/2014
|
$41.14
|
PP = $43.55
|
|
MB = $45.73
|
Most Recent Note - 6/4/2014 12:27:33 PM
Y - Found support at its 50 DMA line and it is perched within close striking distance of its 52-week high today while on track for a 2nd consecutive volume-driven gain. A gain above its pivot point backed by at least +40% above average volume may trigger a technical buy signal.
>>> FEATURED STOCK ARTICLE : Finding Support Above 50-Day Moving Average - 6/3/2014
View all notes |
Set NEW NOTE alert |
CANSLIM.net Company Profile |
SEC
News |
Chart |
Request a new note
C
A N
S L
I M
|
ICON
-
NASDAQ
Iconix Brand Group Inc
CONSUMER NON-DURABLES - Textile - Apparel Footwear
|
$42.79
|
+0.25
0.59% |
$43.05
|
802,852
149.79% of 50 DAV
50 DAV is 536,000
|
$43.34
-1.27%
|
4/30/2014
|
$42.50
|
PP = $42.57
|
|
MB = $44.70
|
Most Recent Note - 6/3/2014 5:39:26 PM
Y - Quietly hovering near its all-time high. Confirming gains above the pivot point with above average volume could trigger a new (or add-on) technical buy signal.
>>> FEATURED STOCK ARTICLE : Consolidating Above 50 DMA Line Still Perched Near 52-Week High - 5/20/2014
View all notes |
Set NEW NOTE alert |
CANSLIM.net Company Profile |
SEC
News |
Chart |
Request a new note
C
A N
S L
I M
|
Symbol/Exchange
Company Name
Industry Group |
PRICE |
CHANGE
(%Change) |
Day High |
Volume
(% DAV)
(% 50 day avg vol) |
52 Wk Hi
% From Hi |
Featured
Date |
Price
Featured |
Pivot Featured |
|
Max Buy |
KORS
-
NYSE
Michael Kors Hldgs Ltd
RETAIL - Apparel Stores
|
$93.84
|
-0.21
-0.22% |
$94.69
|
2,258,091
81.76% of 50 DAV
50 DAV is 2,762,000
|
$101.04
-7.13%
|
5/27/2014
|
$96.70
|
PP = $101.14
|
|
MB = $106.20
|
Most Recent Note - 6/4/2014 6:12:02 PM
Y - Relative Strength rating has improved to 83, above the 80+ minimum guideline for buy candidates. Finding support at its 50 DMA line, but deterioration below that important short-term average would raise more concerns and trigger a technical sell signal. A breakout above the pivot point with at least +40% above average volume is needed to trigger a new technical buy signal.
>>> FEATURED STOCK ARTICLE : Earnings News May Prompt Volume and Volatility - 5/27/2014
View all notes |
Set NEW NOTE alert |
CANSLIM.net Company Profile |
SEC
News |
Chart |
Request a new note
C
A N
S L
I M
|
PANW
-
NYSE
Palo Alto Networks
Computer Sftwr-Security
|
$75.34
|
+1.08
1.45% |
$76.49
|
1,840,674
91.76% of 50 DAV
50 DAV is 2,006,000
|
$80.84
-6.80%
|
5/29/2014
|
$75.95
|
PP = $72.50
|
|
MB = $76.13
|
Most Recent Note - 6/4/2014 2:28:34 PM
Y - Approaching its "max buy" level with today's gain. Little overhead supply remains up through the $80 level. Prior highs near $72 define important support above its 50 DMA line.
>>> FEATURED STOCK ARTICLE : Finish Near Session Low Following Gap Up From Double Bottom Base - 5/29/2014
View all notes |
Set NEW NOTE alert |
CANSLIM.net Company Profile |
SEC
News |
Chart |
Request a new note
C
A N
S L
I M
|
SN
-
NYSE
Sanchez Energy Corp
ENERGY - Independent Oil and Gas
|
$33.94
|
+0.78
2.35% |
$34.24
|
1,698,827
144.09% of 50 DAV
50 DAV is 1,179,000
|
$35.50
-4.39%
|
5/22/2014
|
$33.00
|
PP = $31.59
|
|
MB = $33.17
|
Most Recent Note - 6/3/2014 12:50:58 PM
G - Pulling back further today following a "negative reversal" on the prior session after touching a new 52-week high. Prior highs near $31-32 define initial support to watch on pullbacks.
>>> FEATURED STOCK ARTICLE : Finish Near Low a Sign of Distributional Pressure Following Gap Up and New High - 5/22/2014
View all notes |
Set NEW NOTE alert |
CANSLIM.net Company Profile |
SEC
News |
Chart |
Request a new note
C
A N
S L
I M
|
TRN
-
NYSE
Trinity Industries Inc
TRANSPORTATION - Railroads
|
$80.26
|
-1.27
-1.56% |
$81.22
|
3,629,884
255.27% of 50 DAV
50 DAV is 1,422,000
|
$87.89
-8.68%
|
4/30/2014
|
$75.57
|
PP = $76.05
|
|
MB = $79.85
|
Most Recent Note - 6/4/2014 2:33:11 PM
G - Pulling back near its "max buy" level with above average volume behind today's 4th consecutive loss. Traded up as much as +15.57% since first highlighted in yellow in the 4/30/14 mid-day report. Prior highs in the $75-76 area coincide with its 50 DMA line ($76.12) defining important support to watch.
>>> FEATURED STOCK ARTICLE : Extended From Prior Base After +15% Rally in One Month - 6/2/2014
View all notes |
Set NEW NOTE alert |
CANSLIM.net Company Profile |
SEC
News |
Chart |
Request a new note
C
A N
S L
I M
|
WLK
-
NYSE
Westlake Chemical Corp
CHEMICALS - Specialty Chemicals
|
$81.20
|
+0.31
0.38% |
$81.92
|
1,272,911
170.40% of 50 DAV
50 DAV is 747,000
|
$81.74
-0.66%
|
4/29/2014
|
$72.79
|
PP = $69.31
|
|
MB = $72.78
|
Most Recent Note - 6/4/2014 6:10:34 PM
G - Hit a new 52-week high with today's volume-driven gain. Recent lows near $73 define important near-term support to watch on pullbacks.
>>> FEATURED STOCK ARTICLE : Extended From Prior Base After 5 Weekly Gains - 5/30/2014
View all notes |
Set NEW NOTE alert |
CANSLIM.net Company Profile |
SEC
News |
Chart |
Request a new note
C
A N
S L
I M
|
Symbol/Exchange
Company Name
Industry Group |
PRICE |
CHANGE
(%Change) |
Day High |
Volume
(% DAV)
(% 50 day avg vol) |
52 Wk Hi
% From Hi |
Featured
Date |
Price
Featured |
Pivot Featured |
|
Max Buy |
|
|
|
THESE ARE NOT BUY RECOMMENDATIONS!
Comments contained in the body of this report are technical
opinions only. The material herein has been obtained
from sources believed to be reliable and accurate, however,
its accuracy and completeness cannot be guaranteed.
This site is not an investment advisor, hence it does
not endorse or recommend any securities or other investments.
Any recommendation contained in this report may not
be suitable for all investors and it is not to be deemed
an offer or solicitation on our part with respect to
the purchase or sale of any securities. All trademarks,
service marks and trade names appearing in this report
are the property of their respective owners, and are
likewise used for identification purposes only.
This report is a service available
only to active Paid Premium Members.
You may opt-out of receiving report notifications
at any time. Questions or comments may be submitted
by writing to Premium Membership Services 665 S.E. 10 Street, Suite 201 Deerfield Beach, FL 33441-5634 or by calling 1-800-965-8307
or 954-785-1121.
|
|
|

