You are not logged in.
This means you
CAN ONLY VIEW reports that were published prior to Monday, April 14, 2025.
You
MUST UPGRADE YOUR MEMBERSHIP if you want to see any current reports.
AFTER MARKET UPDATE - FRIDAY, JUNE 4TH, 2010
Previous After Market Report Next After Market Report >>>
|
|
|
|
DOW |
-323.31 |
9,931.97 |
-3.15% |
|
Volume |
1,634,932,880 |
+34% |
|
Volume |
2,280,493,470 |
+7% |
|
NASDAQ |
-83.86 |
2,219.17 |
-3.64% |
|
Advancers |
291 |
9% |
|
Advancers |
311 |
11% |
|
S&P 500 |
-37.95 |
1,064.88 |
-3.44% |
|
Decliners |
2,808 |
88% |
|
Decliners |
2,395 |
86% |
|
Russell 2000 |
-33.40 |
633.97 |
-5.00% |
|
52 Wk Highs |
17 |
|
|
52 Wk Highs |
15 |
|
|
S&P 600 |
-17.15 |
339.53 |
-4.81% |
|
52 Wk Lows |
40 |
|
|
52 Wk Lows |
96 |
|
|
 |
Indices Dive on Heavier Volume With Poor Breadth
Adam Sarhan, Contributing Writer,
It was another volatile week on Wall Street as investors digested a questionable follow-through day (FTD), a very weak jobs report, and saw the euro plunge to a fresh multi-year low! On Friday, volume totals easily topped Thursday's levels on both major exchanges which indicated heavy distributional pressure from the institutional crowd. Decliners trumped advancers by almost a 10-to-1 ratio on the NYSE and by more than an 8-to-1 ratio on the Nasdaq exchange. There were 6 high-ranked companies from the CANSLIM.net Leaders List that made a new 52-week high and appeared on the CANSLIM.net BreakOuts Page, much lower than the 28 issues that appeared on the prior session. New 52-week lows outnumbered new 52-week highs on the NYSE and the Nasdaq exchange.
The US stock market was closed on Monday in observance of Memorial Day. Stocks fell on Tuesday after BP Amoco PLC (BP -5.37%) said that they were not able to stop the leak in the Gulf of Mexico. BP gapped down on monstrous volume and hit a fresh one-year low after news spread that the earliest they will be able to plug the leak will be August. In other news, the ISM manufacturing index topped estimates and the euro plunged to a fresh 2010 low which reiterated fears that the ongoing contagion woes will worsen.
On Wednesday, the major averages surged but volume, a critical component of institutional sponsorship, was mixed. Volume was significantly lighter than the prior session on the NYSE and edged higher on the Nasdaq exchange. The higher volume on the Nasdaq exchange, coupled with the strong gain, was enough for the paper to say the Nasdaq confirmed its latest rally attempt and produced a FTD. The Dow and S&P 500 have yet to follow-through which would be a great sign to confirm this nascent rally.
Elsewhere, the Japanese Prime Minister Yukio Hatoyama resigned from office ahead of the forthcoming election. His surprise resignation sent the yen plunging against 15 major currencies. In the US, pending home sales jumped to their highest level since October as buyers took advantage of the now expired tax credit. Bank of America's (BAC -2.91%) Chief Executive Officer, Brian Moynihan, reassured investors when he said that he sees "more than hopeful signs" on loan demand. Billionaire investor, Warren Buffett, spent part of his day testifying before the Financial Crisis Inquiry Committee (FCIC) and defended the credit agencies.
Stocks edged higher on Thursday as investors digested mixed economic data: Retail sales lagged, weekly jobless claims slid, and the ISM service index rose. The Labor Department said jobless claims fell by -10,000 to 453,000 last week and the ADP Employer Services report, based on private-sector payrolls, rose by +55,000 jobs. The ADP reading fell short of the Street's +70,000 estimate. Meanwhile, the Institute for Supply Management’s index of non-manufacturing businesses, which currently comprises approximately +90% of the economy, held steady at 55.4 for a third month. Stocks got smacked on Friday after the Labor Department said jobs rose by +431,000 last month which was the highest monthly gain since March 2000. However, +411,000 of those jobs were from the government hiring temporary workers for the 2010 census. That left a very small increase from the private sector which was very worrisome. In addition, the March 2000 reading was also due to census jobs.
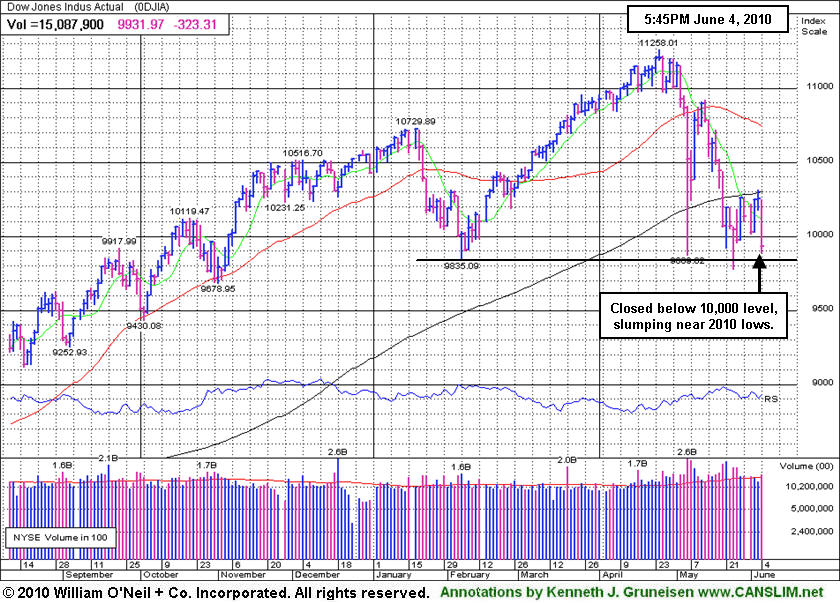
The author of "How To Make Money In Stocks", the book that explains the fact-based investment system, has observed in the past that a market should not be considered to be in "healthy" shape unless at least 2 of the 3 major averages are trading above their rising 200-day moving average (DMA) lines. The Nasdaq Composite Index ended the week slumping back to a close under its long-term average, meanwhile the S&P 500 and Dow encountered resistance and remain below their respective 200 DMA lines. It would be very encouraging to see a proper follow-through-day (FTD) emerge for the benchmark S&P 500 and the Dow Jones Industrial Average to offer additional confirmation of a hearty new rally. Yet, acknowledging that we have a new confirmed rally based on the latest market improvements, the window is now considered to be open again to begin buying high-ranked stocks that trigger new technical buy signals but caution is sometimes the better part of valor.
Professional Money Management Services - Free Portfolio Review:
If your portfolio is greater than $100,000 and you would like a free portfolio review, click here to get connected with one of our portfolio managers. ** Serious inquires only, please.
PICTURED: The Down Jones Industrial Average closed under the 10,000 level while slumping near 2010 lows.
|
|
|
 |
Bank Index Falls To Close Below 200-Day Average Line
Kenneth J. Gruneisen - Passed the CAN SLIM® Master's Exam
The tech sector ended unanimously lower as large losses from the Networking Index ($NWX -5.13%), Semiconductor Index ($SOX -4.38%), Biotechnology Index ($BTK -3.82%), and Internet Index ($IIX -3.36%) put pressure on the tech-heavy Nasdaq Composite Index. The influential Bank Index ($BKX -4.43%), Broker/Dealer Index ($XBD -3.08%), and the Retail Index ($RLX -3.96%) were collectively smacked with large losses. Meanwhile, energy-related shares slumped as the Integrated Oil Index ($XOI -4.26%) and Oil Services Index ($OSX -2.62%) fell hard, and defensive groups offered "safe haven" investors no comfort as the Gold & Silver Index ($XAU -2.40%) and Healthcare Index ($HMO -1.53%) also lost ground.
Charts courtesy www.stockcharts.com
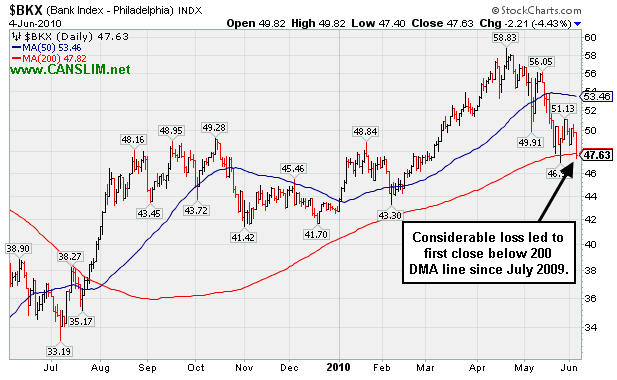
PICTURED: The Bank Index ($BKX -4.43%) suffered a considerable loss that led to the first close below its 200-day moving average (DMA) line since July 2009.
| Oil Services |
$OSX |
164.83 |
-4.44 |
-2.62% |
-15.44% |
| Healthcare |
$HMO |
1,516.18 |
-23.52 |
-1.53% |
+2.94% |
| Integrated Oil |
$XOI |
914.99 |
-40.75 |
-4.26% |
-14.34% |
| Semiconductor |
$SOX |
348.48 |
-15.97 |
-4.38% |
-3.18% |
| Networking |
$NWX |
228.38 |
-12.35 |
-5.13% |
-1.16% |
| Internet |
$IIX |
234.19 |
-8.13 |
-3.36% |
+0.14% |
| Broker/Dealer |
$XBD |
106.43 |
-3.38 |
-3.08% |
-7.49% |
| Retail |
$RLX |
426.94 |
-17.61 |
-3.96% |
+3.85% |
| Gold & Silver |
$XAU |
169.06 |
-4.15 |
-2.40% |
+0.48% |
| Bank |
$BKX |
47.63 |
-2.21 |
-4.43% |
+11.52% |
| Biotech |
$BTK |
1,044.06 |
-41.48 |
-3.82% |
+10.82% |
|
|
|
 |
Retail/Wholesale - Building Products Firm Again Slumps Under 50 DMA Line
Kenneth J. Gruneisen - Passed the CAN SLIM® Master's Exam
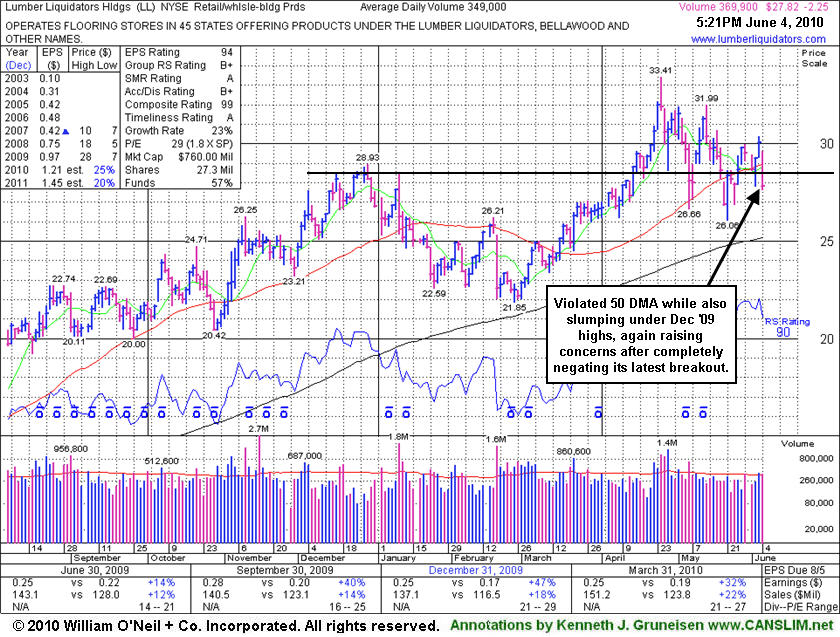
Lumber Liquidators Hldgs (LL -$2.25 or -7.48% to $27.82) suffered a considerable loss today that led to a violation of its 50-day moving average (DMA) line and December '09 highs, again raising concerns. A "negative reversal" on 4/26/10 marked its all-time high shown in this FSU section under the headline "Negative Reversal Today; Fresh Earnings News Wednesday" after hitting its $33.41 high. . Further deterioration below its recent chart lows would raise concerns and trigger more worrisome technical sell signals.
Sequentially, its quarterly comparisons show accelerating sales revenues with earnings above the +25% guideline versus the year ago period in the 3 most current (C criteria) quarters. LL quickly got extended beyond the "max buy" guideline used by disciplined investors after it was recently featured at $29.87 in the 4/22/10 the mid-day report (read here) with a timely note as it was - "rising from an orderly cup shaped pattern (without a proper handle) formed since last noted on 12/17/09. It rallied steadily after a 'breakaway gap' on 8/05/09 helped it clear stubborn resistance in the $17 area. Quarterly sales and earnings increases have recently shown encouraging acceleration while growth rates have previously been noted as below the investment system's guidelines." The number of top-rated funds owning its shares rose from 24 in Dec '09 to 60 in Mar '10, an encouraging sign concerning the I criteria of the fact-based system.
|
|
|
Color Codes Explained :
Y - Better candidates highlighted by our
staff of experts.
G - Previously featured
in past reports as yellow but may no longer be buyable under the
guidelines.
***Last / Change / Volume data in this table is the closing quote data***
Symbol/Exchange
Company Name
Industry Group |
PRICE |
CHANGE
(%Change) |
Day High |
Volume
(% DAV)
(% 50 day avg vol) |
52 Wk Hi
% From Hi |
Featured
Date |
Price
Featured |
Pivot Featured |
|
Max Buy |
BIDU
-
NASDAQ
Baidu Inc Ads
INTERNET - Internet Information Providers
|
$73.20
|
-3.46
-4.52% |
$76.24
|
9,168,114
55.06% of 50 DAV
50 DAV is 16,651,500
|
$82.29
-11.05%
|
1/13/2010
|
$43.13
|
PP = $42.68
|
|
MB = $44.81
|
 Most Recent Note - 6/4/2010 4:59:00 PM
G - Considerable loss on light volume today erased its 3 prior gains. It is extended from any sound base. A worrisome negative reversal from its all-time high on 5/13/10 followed a 10:1 stock split.
>>> The latest Featured Stock Update with an annotated graph appeared on 6/1/2010. Click here.
View all notes |
Alert me of new notes |
CANSLIM.net Company Profile |
SEC |
Zacks Reports |
StockTalk |
News |
Chart |
Request a new note
C
A N
S L
I M


|
BRLI
-
NASDAQ
Bio Reference Labs Inc
HEALTH SERVICES - Medical Laboratories and Researc
|
$22.36
|
-1.03
-4.40% |
$23.14
|
115,698
60.51% of 50 DAV
50 DAV is 191,200
|
$24.67
-9.38%
|
2/12/2010
|
$39.02
|
PP = $20.49
|
|
MB = $21.51
|
Most Recent Note - 6/4/2010 5:00:41 PM
G - Gapped down today, violating its 50 DMA line with a considerable loss on light volume. It reported sales revenues and earnings increases near the +25% minimum guideline for the latest quarter ended April 30, 2010 versus the year ago period. Consolidating for about 6 weeks since a 2:1 stock split effective on 4/22/10.
>>> The latest Featured Stock Update with an annotated graph appeared on 5/26/2010. Click here.
View all notes |
Alert me of new notes |
CANSLIM.net Company Profile |
SEC |
Zacks Reports |
StockTalk |
News |
Chart |
Request a new note
C
A N
S L
I M
|
CRM
-
NYSE
Salesforce.Com Inc
INTERNET - Internet Software and Services
|
$89.64
|
-5.56
-5.84% |
$96.35
|
6,447,804
302.05% of 50 DAV
50 DAV is 2,134,700
|
$95.78
-6.41%
|
6/2/2010
|
$88.44
|
PP = $89.60
|
|
MB = $94.08
|
Most Recent Note - 6/4/2010 5:03:21 PM
Y - Considerable loss today, negatively reversing from a new all-time high after its "breakaway gap" on 6/03/10 triggered a technical buy signal. Prior chart highs in the $89 area that were a resistance level may now act as a support level.
>>> The latest Featured Stock Update with an annotated graph appeared on 6/2/2010. Click here.
View all notes |
Alert me of new notes |
CANSLIM.net Company Profile |
SEC |
Zacks Reports |
StockTalk |
News |
Chart |
Request a new note
C
A N
S L
I M
|
LL
-
NYSE
Lumber Liquidators Hldgs
RETAIL - Home Improvement Stores
|
$27.82
|
-2.25
-7.48% |
$29.60
|
372,808
103.16% of 50 DAV
50 DAV is 361,400
|
$33.41
-16.73%
|
4/22/2010
|
$29.87
|
PP = $29.03
|
|
MB = $30.48
|
Most Recent Note - 6/4/2010 5:05:10 PM
G - Considerable loss today led to a violation of its 50 DMA line and December '09 highs, again raising concerns. A "negative reversal" on 4/26/10 marked its all-time high.
>>> The latest Featured Stock Update with an annotated graph appeared on 6/4/2010. Click here.
View all notes |
Alert me of new notes |
CANSLIM.net Company Profile |
SEC |
Zacks Reports |
StockTalk |
News |
Chart |
Request a new note
C
A N
S L
I M
|
LOPE
-
NASDAQ
Grand Canyon Education
DIVERSIFIED SERVICES - Education and; Training Services
|
$24.12
|
-0.85
-3.40% |
$24.88
|
480,320
111.21% of 50 DAV
50 DAV is 431,900
|
$28.46
-15.25%
|
4/13/2010
|
$27.71
|
PP = $27.33
|
|
MB = $28.70
|
Most Recent Note - 6/4/2010 5:07:28 PM
G - Slumping further below its 50 DMA line which is now acting as a resistance level. Pulling back near its 4/29/10 low of $23.66 which is the next important technical chart support.
>>> The latest Featured Stock Update with an annotated graph appeared on 5/27/2010. Click here.
View all notes |
Alert me of new notes |
CANSLIM.net Company Profile |
SEC |
Zacks Reports |
StockTalk |
News |
Chart |
Request a new note
C
A N
S L
I M
|
Symbol/Exchange
Company Name
Industry Group |
PRICE |
CHANGE
(%Change) |
Day High |
Volume
(% DAV)
(% 50 day avg vol) |
52 Wk Hi
% From Hi |
Featured
Date |
Price
Featured |
Pivot Featured |
|
Max Buy |
MELI
-
NASDAQ
Mercadolibre Inc
INTERNET - Internet Software and; Services
|
$54.05
|
-1.85
-3.31% |
$55.94
|
813,175
126.05% of 50 DAV
50 DAV is 645,100
|
$56.16
-3.76%
|
5/13/2010
|
$54.21
|
PP = $55.85
|
|
MB = $58.64
|
Most Recent Note - 6/4/2010 5:08:44 PM
Y - Consolidating near its 52-week high, its color code was changed to yellow. A powerful gain above its pivot point may confirm a new technical buy signal.
>>> The latest Featured Stock Update with an annotated graph appeared on 5/28/2010. Click here.
View all notes |
Alert me of new notes |
CANSLIM.net Company Profile |
SEC |
Zacks Reports |
StockTalk |
News |
Chart |
Request a new note
C
A N
S L
I M
|
ROVI
-
NASDAQ
Rovi Corp
COMPUTER SOFTWARE andamp; SERVICES - Security Software andamp; Services
|
$37.66
|
-1.56
-3.98% |
$38.97
|
1,007,573
78.69% of 50 DAV
50 DAV is 1,280,400
|
$40.06
-5.99%
|
6/3/2010
|
$38.70
|
PP = $40.16
|
|
MB = $42.17
|
Most Recent Note - 6/4/2010 5:10:43 PM
Y - Erased most of the prior session's gain with today's loss on lighter volume. Finished near its 50 DMA line within close striking distance (-6%) of its 52-week high. Color code was changed to yellow with new pivot point cited based upon its 4/26/10 high plus ten cents.
>>> The latest Featured Stock Update with an annotated graph appeared on 5/24/2010. Click here.
View all notes |
Alert me of new notes |
CANSLIM.net Company Profile |
SEC |
Zacks Reports |
StockTalk |
News |
Chart |
Request a new note
C
A N
S L
I M
|
SUMR
-
NASDAQ
Summer Infant Inc
CONSUMER NON-DURABLES - Personal Products
|
$7.59
|
-0.51
-6.30% |
$8.15
|
127,555
196.54% of 50 DAV
50 DAV is 64,900
|
$8.42
-9.86%
|
5/4/2010
|
$6.85
|
PP = $7.09
|
|
MB = $7.44
|
Most Recent Note - 6/4/2010 5:12:53 PM
G - Today marked its 3rd loss with above average volume within the span of 4 sessions, enduring moderate distributional pressure. Prior highs and its 50 DMA coincide near $7.00 as an important chart support level.
>>> The latest Featured Stock Update with an annotated graph appeared on 5/21/2010. Click here.
View all notes |
Alert me of new notes |
CANSLIM.net Company Profile |
SEC |
Zacks Reports |
StockTalk |
News |
Chart |
Request a new note
C
A N
S L
I M
|
THOR
-
NASDAQ
Thoratec Corp
HEALTH SERVICES - Medical Instruments and Supplies
|
$42.81
|
-1.40
-3.17% |
$44.01
|
1,260,412
149.67% of 50 DAV
50 DAV is 842,100
|
$46.50
-7.94%
|
6/3/2010
|
$44.38
|
PP = $45.35
|
|
MB = $47.62
|
Most Recent Note - 6/4/2010 5:16:58 PM
Y - Two consecutive losses have entirely erased its 6/02/10 breakout from a choppy 5-week base backed by above average volume. Recent quarterly comparisons showed impressive acceleration in its sales revenues increases and earnings above the +25% minimum guideline, satisfying the C criteria. Based on weakness it was dropped from the Featured Stocks list on 2/23/09, yet it has shown especially bullish action since its breakout on 3/05/10. Mentioned long ago in a 12/15/08 interview on WBBM 780AM - (listen here). This high-ranked Medical - Products firm was featured in yellow in the 12/05/08 Mid-Day Breakouts Report (read here) THOR had rebounded impressively after being featured in the past, then subsequently dropped from the CANSLIM.net Featured Stocks list on 2/2/2006.
>>> The latest Featured Stock Update with an annotated graph appeared on 6/3/2010. Click here.
View all notes |
Alert me of new notes |
CANSLIM.net Company Profile |
SEC |
Zacks Reports |
StockTalk |
News |
Chart |
Request a new note
C
A N
S L
I M
|
ULTA
-
NASDAQ
Ulta Salon Cosm & Frag
SPECIALTY RETAIL - Specialty Retail, Other
|
$23.16
|
-0.74
-3.10% |
$23.90
|
778,116
200.55% of 50 DAV
50 DAV is 388,000
|
$26.00
-10.92%
|
5/28/2010
|
$25.58
|
PP = $25.86
|
|
MB = $27.15
|
Most Recent Note - 6/4/2010 5:20:55 PM
G - Small loss today on above average volume, consolidating near its 50 DMA line and -11% off its 52-week high. Reported strong earnings news for the quarter ended April 30, 2010.
>>> The latest Featured Stock Update with an annotated graph appeared on 5/20/2010. Click here.
View all notes |
Alert me of new notes |
CANSLIM.net Company Profile |
SEC |
Zacks Reports |
StockTalk |
News |
Chart |
Request a new note
C
A N
S L
I M
|
Symbol/Exchange
Company Name
Industry Group |
PRICE |
CHANGE
(%Change) |
Day High |
Volume
(% DAV)
(% 50 day avg vol) |
52 Wk Hi
% From Hi |
Featured
Date |
Price
Featured |
Pivot Featured |
|
Max Buy |
|
|
|
THESE ARE NOT BUY RECOMMENDATIONS!
Comments contained in the body of this report are technical
opinions only. The material herein has been obtained
from sources believed to be reliable and accurate, however,
its accuracy and completeness cannot be guaranteed.
This site is not an investment advisor, hence it does
not endorse or recommend any securities or other investments.
Any recommendation contained in this report may not
be suitable for all investors and it is not to be deemed
an offer or solicitation on our part with respect to
the purchase or sale of any securities. All trademarks,
service marks and trade names appearing in this report
are the property of their respective owners, and are
likewise used for identification purposes only.
This report is a service available
only to active Paid Premium Members.
You may opt-out of receiving report notifications
at any time. Questions or comments may be submitted
by writing to Premium Membership Services 665 S.E. 10 Street, Suite 201 Deerfield Beach, FL 33441-5634 or by calling 1-800-965-8307
or 954-785-1121.
|
|
|


