You are not logged in.
This means you
CAN ONLY VIEW reports that were published prior to Monday, April 14, 2025.
You
MUST UPGRADE YOUR MEMBERSHIP if you want to see any current reports.
AFTER MARKET UPDATE - MONDAY, JUNE 3RD, 2013
Previous After Market Report Next After Market Report >>>
|
|
|
|
DOW |
+138.46 |
15,254.03 |
+0.92% |
|
Volume |
879,996,610 |
-22% |
|
Volume |
1,958,954,530 |
+9% |
|
NASDAQ |
+9.46 |
3,465.37 |
+0.27% |
|
Advancers |
1,384 |
44% |
|
Advancers |
1,459 |
57% |
|
S&P 500 |
+9.68 |
1,640.42 |
+0.59% |
|
Decliners |
1,694 |
54% |
|
Decliners |
1,019 |
40% |
|
Russell 2000 |
+6.39 |
990.53 |
+0.65% |
|
52 Wk Highs |
52 |
|
|
52 Wk Highs |
137 |
|
|
S&P 600 |
+4.49 |
556.47 |
+0.81% |
|
52 Wk Lows |
244 |
|
|
52 Wk Lows |
18 |
|
|
 |
Major Averages Started June With Gains
Kenneth J. Gruneisen - Passed the CAN SLIM® Master's Exam
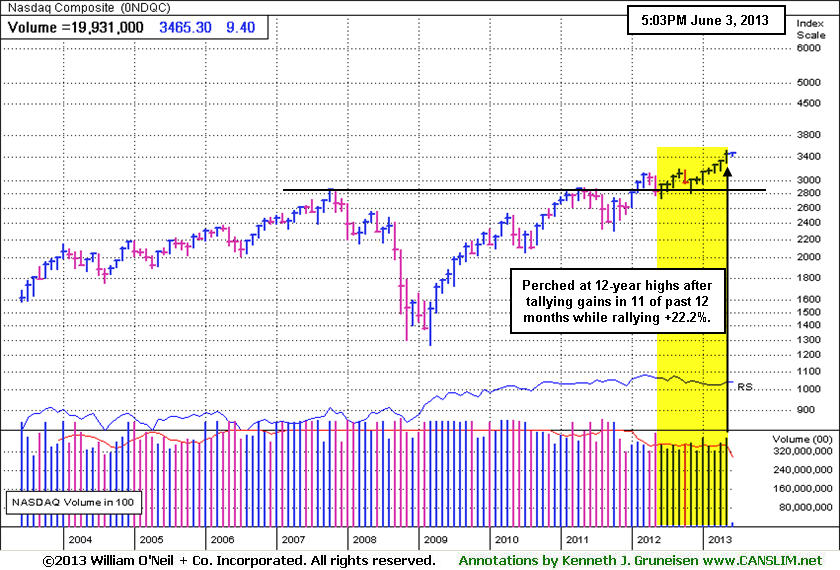
The major averages finished higher in June's first trading session. Monday's volume totals were reported mixed, higher than the prior session total on the Nasdaq exchange but lighter on the NYSE. Breadth was negative as decliners led advancers by an 8-7 margin on the NYSE and by a 3-2 margin on the Nasdaq exchange. There were 30 high-ranked companies from the CANSLIM.net Leaders List making new 52-week highs and appearing on the CANSLIM.net BreakOuts Page, down from the prior session total of 36 stocks. New 52-week lows swelled and substantially outnumbered new 52-week highs on the NYSE, meanwhile on the Nasdaq exchange new 52-week highs still outnumbered new 52-week lows. There were gains for only 4 of the 12 high-ranked companies currently included on the Featured Stocks Page.
Stocks were under pressure for most of the session after a measure of U.S. manufacturing unexpectedly contracted in May for the first time in six months, falling to its lowest level since June 2009. In addition, construction spending rose by +0.4% in April, missing expectations for an increase of +0.9%. However, the market erased earlier losses after Atlanta Fed President Dennis Lockhart said recent economic data suggests the economy isn't strong enough to justify a reduction in the central bank's bond-buying program.
Overall, nearly every sector finished higher. Energy was the best performing group as Apache Corp (APA +2.97%) and Occidental Petroleum Corp (OXY +2.39%) gained. Automakers were another bright spot. The new General Motors Company (GM +1.56%) and Ford Motor Co (F +1.34%) gained after both companies posted encouraging monthly sales figures. Financials lagged behind as Bank of America Corp (BAC -0.81%) and JP Morgan Chase & Co (JPM -0.18%) edged lower.
In fixed-income, Treasuries finished little changed. The 10-year note was flat to yield 2.13% and the 30-year bond gained 11/32 to yield 3.26%.
The market (M criteria) uptrend clearly came under pressure as May drew to a close. Friday's commentary also included a Special Notice and annotated graph illustrating the IBD 85-85 Index's Relative Strength line lagging in recent years(read here). More damaging losses in the broader market can serve as a reminder for investors to be protective of any gains and to limit losses by being especially watchful for any individual issues flashing technical sell signals. This is precisely how the fact-based investment system prompts investors to reduce exposure and preserve cash during market downdrafts.
As always, watch upcoming CANSLIM.net reports for new action-worthy leaders best matching the winning models to be covered as they emerge and then included on the Featured Stocks Page - with our Certified experts' latest notes and links to additional resources including detailed analysis with annotated graphs. The Premium Member Homepage - includes "dynamic archives" to all prior pay reports published. Watch for an announcement via email concerning the next WEBCAST.
PICTURED: The Nasdaq Composite Index is perched at 12-year highs after tallying gains in 11 of the past 12 months while rising +22.2%.
|
 Kenneth J. Gruneisen started out as a licensed stockbroker in August 1987, a couple of months prior to the historic stock market crash that took the Dow Jones Industrial Average down -22.6% in a single day. He has published daily fact-based fundamental and technical analysis on high-ranked stocks online for two decades. Through FACTBASEDINVESTING.COM, Kenneth provides educational articles, news, market commentary, and other information regarding proven investment systems that work in good times and bad.
Comments contained in the body of this report are technical opinions only and are not necessarily those of Gruneisen Growth Corp. The material herein has been obtained from sources believed to be reliable and accurate, however, its accuracy and completeness cannot be guaranteed. Our firm, employees, and customers may effect transactions, including transactions contrary to any recommendation herein, or have positions in the securities mentioned herein or options with respect thereto. Any recommendation contained in this report may not be suitable for all investors and it is not to be deemed an offer or solicitation on our part with respect to the purchase or sale of any securities. |
|
 |
Commodity-Linked Groups, Tech and Retail Indexes Led Gainers
Kenneth J. Gruneisen - Passed the CAN SLIM® Master's Exam
The Retail Index ($RLX +0.27%) posted a modest gain and there was a positive bias for the Semiconductor Index ($SOX +0.45%) and the Networking Index ($NWX +0.68%), meanwhile the Internet Index ($IIX -0.44%) sputtered for a small loss. Commodity-linked areas gained ground as the Oil Services Index ($OSX +0.53%) and Integrated Oil Index ($XOI +1.18%) rose and the Gold & Silver Index ($XAU +2.67%) was a standout gainer. Medical-related shares lost ground as the Biotechnology Index ($BTK -1.45%) and Healthcare Index ($HMO -0.70%) finished with losses. The Broker/Dealer Index ($XBD -0.87%) created a drag on the major averages while the Bank Index ($BKX -0.02%) finished flat.
Charts courtesy www.stockcharts.com
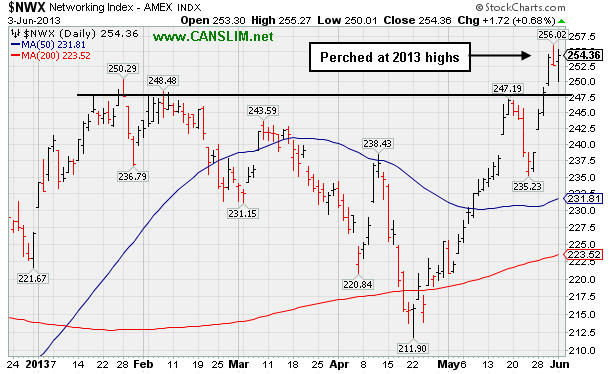
PICTURED: The Networking Index ($NWX +0.68%) is perched at 2013 highs. It rebounded impressively following a deep consolidation below its 200-day moving average (DMA) line in April.
| Oil Services |
$OSX |
255.04 |
+1.34 |
+0.53% |
+15.84% |
| Healthcare |
$HMO |
3,072.60 |
-21.56 |
-0.70% |
+22.21% |
| Integrated Oil |
$XOI |
1,400.95 |
+16.38 |
+1.18% |
+12.81% |
| Semiconductor |
$SOX |
470.72 |
+2.09 |
+0.45% |
+22.56% |
| Networking |
$NWX |
254.36 |
+1.72 |
+0.68% |
+12.27% |
| Internet |
$IIX |
379.02 |
-1.68 |
-0.44% |
+15.91% |
| Broker/Dealer |
$XBD |
122.57 |
-1.08 |
-0.87% |
+29.94% |
| Retail |
$RLX |
789.07 |
+2.15 |
+0.27% |
+20.83% |
| Gold & Silver |
$XAU |
110.23 |
+2.87 |
+2.67% |
-33.44% |
| Bank |
$BKX |
61.59 |
-0.01 |
-0.02% |
+20.11% |
| Biotech |
$BTK |
1,955.05 |
-28.72 |
-1.45% |
+26.37% |
|
|
|
 |
Hovering Near High Following Big Gains In First Weeks After Breakout
Kenneth J. Gruneisen - Passed the CAN SLIM® Master's Exam
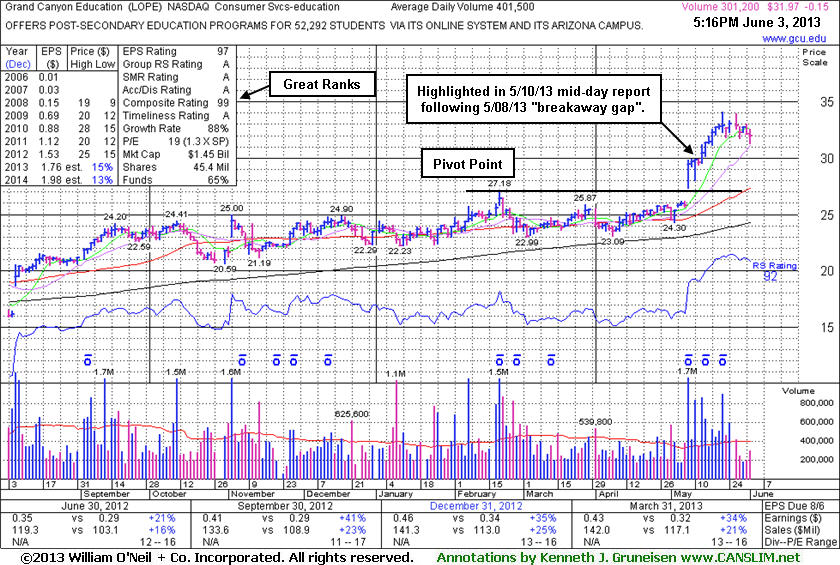
Grand Canyon Education (LOPE -$0.15 or -0.47% to $31.97) has seen its volume totals cooling while holding its ground stubbornly perched at its 52-week high, very extended from its previous base. Prior highs in the $27 area define support to watch on pullbacks. Gains of greater than +20% in the first 2-3 weeks following its "breakaway gap" suggest holding for a minimum of 8 weeks under the fact-based investment system's rules designed to help investors capture big profits from the market's biggest gainers.
Since the stock spiked into new 52-week high territory with volume-driven gains it has held its ground. As it made it to all-time high territory above its April 2010 high (N criteria) it was noted - "Showing bullish technical action which may mark the beginning of a meaningful and sustained advance in price." The Commercial Services - Schools group has shown more leadership (L criteria) and improved to an A Rating from a D+ when it was last shown in this FSU section on 5/10/13 with an annotated graph under the headline, " Breakaway Gap to All-Time Highs", after highlighted in yellow in the earlier 5/10/13 mid-day report (read here) following its considerable "breakaway gap" on 5/08/13. Its pivot point was based on its 2/20/13 high plus 10 cents. A breakaway gap is one noted exception where investors may chase a stock more than +5% above its prior high or pivot point. However, buying further above prior highs increases the chances that a normal pullback may prompt disciplined investors to limit losses and sell if the stock falls more than -7% from their purchase price.
The number of top-rated funds owning its shares rose from 200 in Mar '12 to 292 in Mar '13, a reassuring trend concerning the I criteria. Its current Up/Down Volume Ratio of 2.3 is an unbiased indication that its shares have been under accumulation over the past 50 days. It most recently reported earnings +34% on +21% sales revenues for the Mar '13 quarter, and earnings increases were above the +25% minimum earnings guideline (C criteria) the past 3 quarterly comparisons. It found support near its 50-day moving average (DMA) line and well above its 200 DMA line recently, proving resilient after dropped from the Featured Stocks list on 4/02/13. Its Relative Strength Rating (92) has improved further above the 80+ minimum guideline for buy candidates under the fact-based investment system.
|
|
|
Color Codes Explained :
Y - Better candidates highlighted by our
staff of experts.
G - Previously featured
in past reports as yellow but may no longer be buyable under the
guidelines.
***Last / Change / Volume data in this table is the closing quote data***
Symbol/Exchange
Company Name
Industry Group |
PRICE |
CHANGE
(%Change) |
Day High |
Volume
(% DAV)
(% 50 day avg vol) |
52 Wk Hi
% From Hi |
Featured
Date |
Price
Featured |
Pivot Featured |
|
Max Buy |
AL
-
NYSE
Air Lease Corp Cl A
DIVERSIFIED SERVICES - Rental and Leasing Services
|
$28.59
|
+0.59
2.11% |
$28.65
|
1,067,188
203.35% of 50 DAV
50 DAV is 524,800
|
$31.00
-7.77%
|
5/9/2013
|
$30.95
|
PP = $29.38
|
|
MB = $30.85
|
Most Recent Note - 5/31/2013 12:14:02 PM
G - Rebounding toward its 50 DMA line after pricing a Secondary Offering. It violated important support at its 50 DMA line with volume-driven losses raising concerns and triggering technical sell signals this week, and only a prompt rebound above its 50 DMA would help its outlook improve.
>>> The latest Featured Stock Update with an annotated graph appeared on 5/30/2013. Click here.
View all notes |
Alert me of new notes |
CANSLIM.net Company Profile |
SEC |
Zacks Reports |
StockTalk |
News |
Chart |
Request a new note
C
A N
S L
I M


|
AMBA
-
NASDAQ
Ambarella Inc
ELECTRONICS - Semiconductor - Specialized
|
$15.71
|
-0.46
-2.84% |
$16.57
|
1,600,917
199.69% of 50 DAV
50 DAV is 801,700
|
$17.90
-12.23%
|
5/6/2013
|
$15.31
|
PP = $16.10
|
|
MB = $16.91
|
 Most Recent Note - 6/3/2013 2:05:13 PM
Y - Recovered from early lows near its 50 DMA line, trading down today with above average volume indicating distributional pressure.
>>> The latest Featured Stock Update with an annotated graph appeared on 5/29/2013. Click here.
View all notes |
Alert me of new notes |
CANSLIM.net Company Profile |
SEC |
Zacks Reports |
StockTalk |
News |
Chart |
Request a new note
C
A N
S L
I M
|
CELG
-
NASDAQ
Celgene Corp
DRUGS - Drug Manufacturers - Major
|
$120.89
|
-2.76
-2.23% |
$124.72
|
4,714,925
153.70% of 50 DAV
50 DAV is 3,067,700
|
$131.82
-8.29%
|
3/27/2013
|
$113.24
|
PP = $115.54
|
|
MB = $121.32
|
Most Recent Note - 6/3/2013 2:08:27 PM
G - Trading near its 50 DMA line after slumping lower with a 2nd consecutive loss backed by above average volume. Deterioration below that important short-term average may be considered a technical sell signal.
>>> The latest Featured Stock Update with an annotated graph appeared on 5/13/2013. Click here.
View all notes |
Alert me of new notes |
CANSLIM.net Company Profile |
SEC |
Zacks Reports |
StockTalk |
News |
Chart |
Request a new note
C
A N
S L
I M
|
EQM
-
NYSE
E Q T Midstream Partners
ENERGY - Oil and Gas Pipelines
|
$47.55
|
-1.20
-2.46% |
$48.73
|
144,662
141.13% of 50 DAV
50 DAV is 102,500
|
$51.72
-8.06%
|
4/25/2013
|
$40.16
|
PP = $40.84
|
|
MB = $42.88
|
Most Recent Note - 5/29/2013 12:20:32 PM
G - Churning above average volume today while retreating after a "negative reversal" on the prior session broke a streak of 8 consecutive small gains. It is extended from its latest base and well above its 50 DMA line defining important near-term chart support.
>>> The latest Featured Stock Update with an annotated graph appeared on 5/16/2013. Click here.
View all notes |
Alert me of new notes |
CANSLIM.net Company Profile |
SEC |
Zacks Reports |
StockTalk |
News |
Chart |
Request a new note
C
A N
S L
I M
|
FLT
-
NYSE
Fleetcor Technologies
DIVERSIFIED SERVICES - Business/Management Services
|
$86.14
|
-0.94
-1.08% |
$87.21
|
919,952
98.05% of 50 DAV
50 DAV is 938,200
|
$88.83
-3.03%
|
5/29/2013
|
$86.02
|
PP = $85.66
|
|
MB = $89.94
|
Most Recent Note - 5/31/2013 7:33:26 PM
Y- Was last noted in the mid-day report on 5/29/13 with a new pivot point cited based on its 5/03/13 high, and it rose from an advanced "3-weeks tight" base with a gain on the session backed by +56% above average volume. It may go on to produce more climactic gains, however this was a riskier "late-stage" base. See the latest FSU analysis for more details and a new annotated graph.
>>> The latest Featured Stock Update with an annotated graph appeared on 5/31/2013. Click here.
View all notes |
Alert me of new notes |
CANSLIM.net Company Profile |
SEC |
Zacks Reports |
StockTalk |
News |
Chart |
Request a new note
C
A N
S L
I M
|
Symbol/Exchange
Company Name
Industry Group |
PRICE |
CHANGE
(%Change) |
Day High |
Volume
(% DAV)
(% 50 day avg vol) |
52 Wk Hi
% From Hi |
Featured
Date |
Price
Featured |
Pivot Featured |
|
Max Buy |
LOPE
-
NASDAQ
Grand Canyon Education
DIVERSIFIED SERVICES - Education and; Training Services
|
$31.97
|
-0.15
-0.47% |
$32.57
|
337,809
84.14% of 50 DAV
50 DAV is 401,500
|
$34.07
-6.16%
|
5/10/2013
|
$29.03
|
PP = $27.28
|
|
MB = $28.64
|
Most Recent Note - 6/3/2013 5:43:15 PM
G - Volume totals have been cooling while holding its ground stubbornly perched at its 52-week high, very extended from its previous base. Prior highs in the $27 area define support to watch on pullbacks. Gains of greater than +20% in the first 2-3 weeks following its "breakaway gap" suggest holding for a minimum of 8 week under the fact-based investment system's rules. See the latest FSU analysis for more details and a new annotated graph.
>>> The latest Featured Stock Update with an annotated graph appeared on 6/3/2013. Click here.
View all notes |
Alert me of new notes |
CANSLIM.net Company Profile |
SEC |
Zacks Reports |
StockTalk |
News |
Chart |
Request a new note
C
A N
S L
I M
|
MRLN
-
NASDAQ
Marlin Business Services
DIVERSIFIED SERVICES - Rental and Leasing Services
|
$22.96
|
-0.42
-1.80% |
$24.18
|
41,936
181.54% of 50 DAV
50 DAV is 23,100
|
$25.97
-11.59%
|
3/15/2013
|
$22.29
|
PP = $23.18
|
|
MB = $24.34
|
Most Recent Note - 6/3/2013 2:02:46 PM
G - Slumping under its 50 DMA line and its color code is changed to green. The recent low ($21.49 on 5/23/13) defines important near-term support below that short-term average where a violation would raise more serious concerns.
>>> The latest Featured Stock Update with an annotated graph appeared on 5/23/2013. Click here.
View all notes |
Alert me of new notes |
CANSLIM.net Company Profile |
SEC |
Zacks Reports |
StockTalk |
News |
Chart |
Request a new note
C
A N
S L
I M
|
NSM
-
NYSE
Nationstar Mtg Hldgs Inc
FINANCIAL SERVICES - Credit Services
|
$41.73
|
+1.02
2.51% |
$41.78
|
960,037
75.42% of 50 DAV
50 DAV is 1,273,000
|
$46.91
-11.04%
|
5/7/2013
|
$39.71
|
PP = $42.34
|
|
MB = $44.46
|
Most Recent Note - 6/3/2013 4:30:52 PM
Y - Volume was below average behind today's gain following a spurt of damaging losses marked by above average volume. Weak action recently negated its prior breakout and raised concerns. Disciplined investors always limit losses if any stock falls more than -7% from their purchase price.
>>> The latest Featured Stock Update with an annotated graph appeared on 5/28/2013. Click here.
View all notes |
Alert me of new notes |
CANSLIM.net Company Profile |
SEC |
Zacks Reports |
StockTalk |
News |
Chart |
Request a new note
C
A N
S L
I M
|
PRAA
-
NASDAQ
Portfolio Recovery Assoc
DIVERSIFIED SERVICES - Business/Management Services
|
$152.55
|
+0.28
0.18% |
$153.11
|
85,707
126.23% of 50 DAV
50 DAV is 67,900
|
$153.85
-0.84%
|
5/1/2013
|
$130.77
|
PP = $127.88
|
|
MB = $134.27
|
Most Recent Note - 5/30/2013 4:55:19 PM
G - Edged higher with below average volume today for a 4th consecutive gain and its best-ever close. Very extended from prior highs in the $127 area and well above its 50 DMA line defining important chart support.
>>> The latest Featured Stock Update with an annotated graph appeared on 5/22/2013. Click here.
View all notes |
Alert me of new notes |
CANSLIM.net Company Profile |
SEC |
Zacks Reports |
StockTalk |
News |
Chart |
Request a new note
C
A N
S L
I M
|
PRLB
-
NYSE
Proto Labs Inc
MANUFACTURING - Small Tools and Accessories
|
$52.96
|
-2.28
-4.13% |
$55.30
|
321,617
58.33% of 50 DAV
50 DAV is 551,400
|
$59.84
-11.50%
|
5/3/2013
|
$54.77
|
PP = $54.01
|
|
MB = $56.71
|
Most Recent Note - 6/3/2013 2:10:12 PM
Y - Pulling back again today on light volume. Stayed well above its 50 DMA line during its recent consolidation, but a violation may trigger a technical sell signal.
>>> The latest Featured Stock Update with an annotated graph appeared on 5/24/2013. Click here.
View all notes |
Alert me of new notes |
CANSLIM.net Company Profile |
SEC |
Zacks Reports |
StockTalk |
News |
Chart |
Request a new note
C
A N
S L
I M
|
Symbol/Exchange
Company Name
Industry Group |
PRICE |
CHANGE
(%Change) |
Day High |
Volume
(% DAV)
(% 50 day avg vol) |
52 Wk Hi
% From Hi |
Featured
Date |
Price
Featured |
Pivot Featured |
|
Max Buy |
RRTS
-
NYSE
Roadrunner Trans Systems
TRANSPORTATION - Air Delivery and Freight Service
|
$28.20
|
+0.50
1.81% |
$28.24
|
136,216
66.32% of 50 DAV
50 DAV is 205,400
|
$28.00
0.71%
|
4/3/2013
|
$22.77
|
PP = $23.75
|
|
MB = $24.94
|
Most Recent Note - 5/28/2013 5:45:55 PM
G - Today's 4th consecutive gain while led to a best-ever close, getting more extended from its latest base. Prior highs in the $23 area define initial support to watch above its 50 DMA line. Fundamental concerns were raised by its sub par earnings increase in the Mar '13 quarter, below the +25% minimum guideline (C criteria).
>>> The latest Featured Stock Update with an annotated graph appeared on 5/14/2013. Click here.
View all notes |
Alert me of new notes |
CANSLIM.net Company Profile |
SEC |
Zacks Reports |
StockTalk |
News |
Chart |
Request a new note
C
A N
S L
I M
|
VRX
-
NYSE
Valeant Pharmaceuticals
DRUGS - Drug Manufacturers - Other
|
$88.21
|
-2.91
-3.19% |
$91.74
|
1,817,685
99.24% of 50 DAV
50 DAV is 1,831,600
|
$96.25
-8.35%
|
4/30/2013
|
$60.24
|
PP = $76.66
|
|
MB = $80.49
|
Most Recent Note - 6/3/2013 4:28:59 PM
G- Pulled back today on average volume. Tallied 2 consecutive volume-driven gains and it is extended from prior highs since announcing plans to buy Bausch & Lomb for $8.7 billion. Prior reports cautioned - "Sub par earnings for the Mar '13 quarter below the +25% minimum guideline (C criteria) raised fundamental concerns."
>>> The latest Featured Stock Update with an annotated graph appeared on 5/17/2013. Click here.
View all notes |
Alert me of new notes |
CANSLIM.net Company Profile |
SEC |
Zacks Reports |
StockTalk |
News |
Chart |
Request a new note
C
A N
S L
I M
|
|
|
|
THESE ARE NOT BUY RECOMMENDATIONS!
Comments contained in the body of this report are technical
opinions only. The material herein has been obtained
from sources believed to be reliable and accurate, however,
its accuracy and completeness cannot be guaranteed.
This site is not an investment advisor, hence it does
not endorse or recommend any securities or other investments.
Any recommendation contained in this report may not
be suitable for all investors and it is not to be deemed
an offer or solicitation on our part with respect to
the purchase or sale of any securities. All trademarks,
service marks and trade names appearing in this report
are the property of their respective owners, and are
likewise used for identification purposes only.
This report is a service available
only to active Paid Premium Members.
You may opt-out of receiving report notifications
at any time. Questions or comments may be submitted
by writing to Premium Membership Services 665 S.E. 10 Street, Suite 201 Deerfield Beach, FL 33441-5634 or by calling 1-800-965-8307
or 954-785-1121.
|
|
|

