***Last / Change / Volume data in this table is the closing quote data***
Symbol/Exchange
Company Name
Industry Group |
PRICE |
CHANGE
(%Change) |
Day High |
Volume
(% DAV)
(% 50 day avg vol) |
52 Wk Hi
% From Hi |
Featured
Date |
Price
Featured |
Pivot Featured |
|
Max Buy |
CACC
-
NASDAQ
Credit Acceptance Corp
FINANCIAL SERVICES - Credit Services
|
$75.56
|
-0.62
-0.81% |
$76.65
|
20,559
55.56% of 50 DAV
50 DAV is 37,000
|
$82.29
-8.18%
|
6/2/2011
|
$76.10
|
PP = $82.39
|
|
MB = $86.51
|
Most Recent Note - 6/2/2011
Y - This high-ranked leader in the Finance - Consumer Loans industry is thinly traded (33,300 shares average daily volume) and has a small supply (S criteria) of shares outstanding. Strong earnings history satisfies the C and A criteria. It is consolidating near its 50 DMA line which defines important support along with recent lows near $75. A subsequent gain above its pivot point with heavy volume would trigger a technical buy signal, meanwhile it has formed a sound new base pattern of sufficient length and its color coded is changed to yellow with a pivot point based on its 52-week high plus 10 cents.

>>> The latest Featured Stock Update with an annotated graph appeared on 12/20/2010. Click here.
View all notes |
Alert me of new notes |
CANSLIM.net Company Profile |
SEC |
Zacks Reports |
StockTalk |
News |
Chart |
Request a new note
C
A N
S L
I M


|
CEVA
-
NASDAQ
Ceva Inc
ELECTRONICS - Semiconductor - Specialized
|
$31.90
|
-0.85
-2.60% |
$32.98
|
236,802
106.86% of 50 DAV
50 DAV is 221,600
|
$35.60
-10.39%
|
5/25/2011
|
$32.98
|
PP = $32.05
|
|
MB = $33.65
|
 Most Recent Note - 6/3/2011 4:01:20 PM
Y - Pulling back on light volume today for a 3rd consecutive loss, slumping near its pivot point. Prior highs define support to watch above its 50 DMA line.
>>> The latest Featured Stock Update with an annotated graph appeared on 5/25/2011. Click here.
View all notes |
Alert me of new notes |
CANSLIM.net Company Profile |
SEC |
Zacks Reports |
StockTalk |
News |
Chart |
Request a new note
C
A N
S L
I M
|
CMG
-
NYSE
Chipotle Mexican Grill
LEISURE - Restaurants
|
$286.51
|
+0.72
0.25% |
$291.89
|
1,024,766
94.71% of 50 DAV
50 DAV is 1,082,000
|
$295.99
-3.20%
|
4/1/2011
|
$274.00
|
PP = $275.10
|
|
MB = $288.86
|
Most Recent Note - 6/1/2011 5:26:36 PM
G - Down today with very quiet volume while perched near its all-time high. No resistance remains due to overhead supply. Formed a 5-week base with volume totals cooling in recent weeks while finding support near its 50 DMA line. Its sub par earnings increase of +23% in the latest quarter ended March 31st, 2011 versus the year ago period raised concern while marking its weakest quarterly earnings increase in more than 2 years.
>>> The latest Featured Stock Update with an annotated graph appeared on 5/17/2011. Click here.
View all notes |
Alert me of new notes |
CANSLIM.net Company Profile |
SEC |
Zacks Reports |
StockTalk |
News |
Chart |
Request a new note
C
A N
S L
I M
|
EZPW
-
NASDAQ
Ezcorp Inc Cl A
SPECIALTY RETAIL - Specialty Retail, Other
|
$31.19
|
-0.62
-1.95% |
$31.70
|
264,278
72.86% of 50 DAV
50 DAV is 362,700
|
$33.31
-6.36%
|
2/18/2011
|
$27.94
|
PP = $30.04
|
|
MB = $31.54
|
Most Recent Note - 6/3/2011 4:10:09 PM
G - There was a negative reversal on 6/01/11 for a loss on higher volume after touching a new 52-week high. Recent lows and its 50 DMA line define important nearby chart support to watch where technical violations would raise more serious concerns.
>>> The latest Featured Stock Update with an annotated graph appeared on 5/10/2011. Click here.
View all notes |
Alert me of new notes |
CANSLIM.net Company Profile |
SEC |
Zacks Reports |
StockTalk |
News |
Chart |
Request a new note
C
A N
S L
I M
|
FCFS
-
NASDAQ
First Cash Financial Svs
SPECIALTY RETAIL - Specialty Retail, Other
|
$38.43
|
-0.47
-1.21% |
$39.09
|
223,426
110.44% of 50 DAV
50 DAV is 202,300
|
$42.36
-9.28%
|
5/31/2011
|
$42.00
|
PP = $40.23
|
|
MB = $42.24
|
Most Recent Note - 6/3/2011 4:12:58 PM
G - Finding support near its 50 DMA line and prior lows. Its color code was changed to green after damaging losses on higher volume negated its latest breakout. See the latest FSU analysis for more details and an annotated graph.
>>> The latest Featured Stock Update with an annotated graph appeared on 5/31/2011. Click here.
View all notes |
Alert me of new notes |
CANSLIM.net Company Profile |
SEC |
Zacks Reports |
StockTalk |
News |
Chart |
Request a new note
C
A N
S L
I M
|
Symbol/Exchange
Company Name
Industry Group |
PRICE |
CHANGE
(%Change) |
Day High |
Volume
(% DAV)
(% 50 day avg vol) |
52 Wk Hi
% From Hi |
Featured
Date |
Price
Featured |
Pivot Featured |
|
Max Buy |
FOSL
-
NASDAQ
Fossil Inc
CONSUMER DURABLES - Recreational Goods, Other
|
$100.50
|
-1.76
-1.72% |
$102.97
|
394,155
52.17% of 50 DAV
50 DAV is 755,500
|
$107.54
-6.55%
|
2/1/2011
|
$73.30
|
PP = $74.44
|
|
MB = $78.16
|
Most Recent Note - 6/1/2011 2:01:34 PM
G - Pulling back today, its volume totals have been cooling while consolidating in a tight range since its considerable gap up gain on 5/10/11 for a new all-time high. It is extended from any sound base. Prior highs near $96 define initial support to watch above its 50 DMA line.
>>> The latest Featured Stock Update with an annotated graph appeared on 5/2/2011. Click here.
View all notes |
Alert me of new notes |
CANSLIM.net Company Profile |
SEC |
Zacks Reports |
StockTalk |
News |
Chart |
Request a new note
C
A N
S L
I M
|
HMSY
-
NASDAQ
H M S Holdings Corp
COMPUTER SOFTWARE and SERVICES - Healthcare Information Service
|
$75.42
|
-1.20
-1.57% |
$76.18
|
180,439
113.91% of 50 DAV
50 DAV is 158,400
|
$84.82
-11.08%
|
11/19/2010
|
$61.89
|
PP = $63.01
|
|
MB = $66.16
|
Most Recent Note - 6/1/2011 5:41:17 PM
G - Down on below average volume today. It has lingered for the past 4 weeks below its 50 DMA line which may now act as resistance. A rally above it would improve its technical stance. Deterioration below its recent chart low ($73.27) would raise more serious concerns and trigger an additional sell signal.
>>> The latest Featured Stock Update with an annotated graph appeared on 5/23/2011. Click here.
View all notes |
Alert me of new notes |
CANSLIM.net Company Profile |
SEC |
Zacks Reports |
StockTalk |
News |
Chart |
Request a new note
C
A N
S L
I M
|
HS
-
NYSE
Healthspring Inc
HEALTH SERVICES - Health Care Plans
|
$41.91
|
-1.14
-2.65% |
$43.08
|
833,049
84.97% of 50 DAV
50 DAV is 980,400
|
$45.11
-7.09%
|
3/22/2011
|
$38.29
|
PP = $38.85
|
|
MB = $40.79
|
Most Recent Note - 6/3/2011 3:51:06 PM
G - Volume totals have been cooling while consolidating above its 50 DMA line. That important short-term average defines chart support to watch where a violation would trigger a technical sell signal.
>>> The latest Featured Stock Update with an annotated graph appeared on 5/20/2011. Click here.
View all notes |
Alert me of new notes |
CANSLIM.net Company Profile |
SEC |
Zacks Reports |
StockTalk |
News |
Chart |
Request a new note
C
A N
S L
I M
|
INFA
-
NASDAQ
Informatica Corp
COMPUTER SOFTWARE and SERVICES - Business Software and Services
|
$56.88
|
-1.30
-2.23% |
$57.83
|
914,584
76.23% of 50 DAV
50 DAV is 1,199,800
|
$59.98
-5.17%
|
3/24/2011
|
$50.04
|
PP = $49.86
|
|
MB = $52.35
|
Most Recent Note - 6/3/2011 3:53:51 PM
G - Pulling back today and volume totals have been cooling since it hit a new 52-week high on 6/01/11 then reversed into the red. This high-ranked Computer Software - Database firm did not form a sound new base pattern. Its 50 DMA line defines near-term support to watch.
>>> The latest Featured Stock Update with an annotated graph appeared on 5/24/2011. Click here.
View all notes |
Alert me of new notes |
CANSLIM.net Company Profile |
SEC |
Zacks Reports |
StockTalk |
News |
Chart |
Request a new note
C
A N
S L
I M
|
LULU
-
NASDAQ
Lululemon Athletica
MANUFACTURING - Textile Manufacturing
|
$86.66
|
-0.66
-0.76% |
$88.95
|
1,568,739
77.04% of 50 DAV
50 DAV is 2,036,200
|
$102.83
-15.72%
|
5/18/2011
|
$98.15
|
PP = $102.93
|
|
MB = $108.08
|
Most Recent Note - 6/1/2011 5:00:42 PM
G - Sank to a close even further below its 50 DMA line with today's loss on average volume. Overhead supply may hinder its ability to rally for the near term. It failed to confirm a recent buy signal since a new pivot point was cited, and it triggered technical sell signals with damaging losses on above average volume last week.
>>> The latest Featured Stock Update with an annotated graph appeared on 5/27/2011. Click here.
View all notes |
Alert me of new notes |
CANSLIM.net Company Profile |
SEC |
Zacks Reports |
StockTalk |
News |
Chart |
Request a new note
C
A N
S L
I M
|
Symbol/Exchange
Company Name
Industry Group |
PRICE |
CHANGE
(%Change) |
Day High |
Volume
(% DAV)
(% 50 day avg vol) |
52 Wk Hi
% From Hi |
Featured
Date |
Price
Featured |
Pivot Featured |
|
Max Buy |
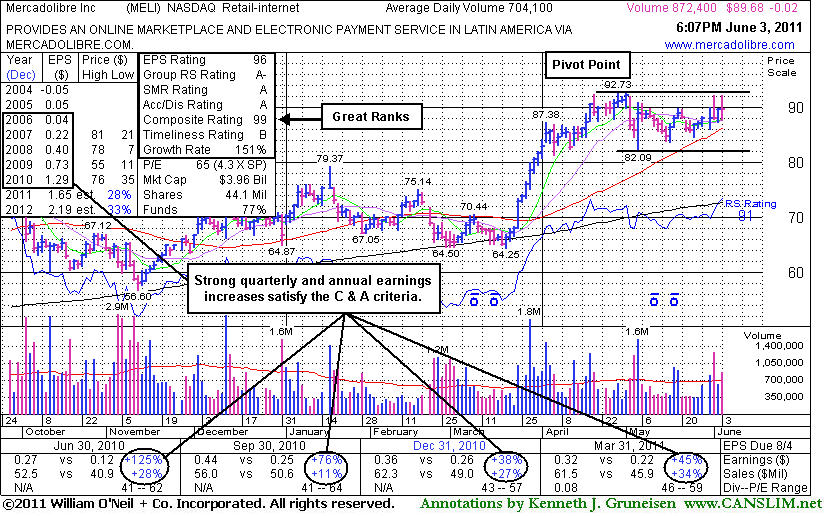
MELI
-
NASDAQ
Mercadolibre Inc
INTERNET - Internet Software and; Services
|
$89.68
|
-0.02
-0.02% |
$92.25
|
872,526
123.92% of 50 DAV
50 DAV is 704,100
|
$92.73
-3.29%
|
6/1/2011
|
$90.55
|
PP = $92.83
|
|
MB = $97.47
|
Most Recent Note - 6/3/2011 6:40:49 PM
Y - Consolidating above its 50 DMA line within close striking distance of its all-time high. It was featured in the 6/01/11 mid-day report in yellow with an annotated weekly graph (read here). For more details and a new annotated daily graph see the latest FSU analysis.
>>> The latest Featured Stock Update with an annotated graph appeared on 6/3/2011. Click here.
View all notes |
Alert me of new notes |
CANSLIM.net Company Profile |
SEC |
Zacks Reports |
StockTalk |
News |
Chart |
Request a new note
C
A N
S L
I M
|
MG
-
NYSE
Mistras Group Inc
DIVERSIFIED SERVICES - Bulding and Faci;ity Management Services
|
$16.52
|
-0.36
-2.13% |
$16.83
|
46,188
29.10% of 50 DAV
50 DAV is 158,700
|
$18.46
-10.51%
|
3/15/2011
|
$15.48
|
PP = $15.90
|
|
MB = $16.70
|
Most Recent Note - 6/3/2011 4:15:35 PM
G - Today's loss with very light volume has it slumping further below its 50 DMA line after that short-term average acted as resistance this week. The recent low ($16.10 on 5/25/11) defines near-term chart support to watch since its recently completed Public Offering.
>>> The latest Featured Stock Update with an annotated graph appeared on 5/12/2011. Click here.
View all notes |
Alert me of new notes |
CANSLIM.net Company Profile |
SEC |
Zacks Reports |
StockTalk |
News |
Chart |
Request a new note
C
A N
S L
I M
|
MWIV
-
NASDAQ
M W I Veterinary Supply
HEALTH SERVICES - Medical Instruments and; Supplies
|
$79.21
|
-2.61
-3.19% |
$81.01
|
102,625
112.04% of 50 DAV
50 DAV is 91,600
|
$86.99
-8.94%
|
11/4/2010
|
$61.79
|
PP = $59.60
|
|
MB = $62.58
|
Most Recent Note - 6/3/2011 3:35:27 PM
G - Down today with below average volume, violating its 50 DMA line and trading just under recent chart lows defining important support to watch.
>>> The latest Featured Stock Update with an annotated graph appeared on 5/5/2011. Click here.
View all notes |
Alert me of new notes |
CANSLIM.net Company Profile |
SEC |
Zacks Reports |
StockTalk |
News |
Chart |
Request a new note
C
A N
S L
I M
|
OPNT
-
NASDAQ
Opnet Technologies
INTERNET - Internet Software and Services
|
$36.87
|
-1.88
-4.85% |
$38.84
|
122,639
93.40% of 50 DAV
50 DAV is 131,300
|
$42.51
-13.27%
|
5/11/2011
|
$41.21
|
PP = $40.50
|
|
MB = $42.53
|
Most Recent Note - 6/3/2011 3:32:00 PM
G - Violated its 50 DMA line today with a damaging loss with volume lighter than average, and it traded just under recent lows raising greater concerns.
>>> The latest Featured Stock Update with an annotated graph appeared on 5/11/2011. Click here.
View all notes |
Alert me of new notes |
CANSLIM.net Company Profile |
SEC |
Zacks Reports |
StockTalk |
News |
Chart |
Request a new note
C
A N
S L
I M
|
OTEX
-
NASDAQ
Open Text Corp
INTERNET - Internet Software and Services
|
$63.73
|
-1.27
-1.95% |
$64.73
|
266,035
75.24% of 50 DAV
50 DAV is 353,600
|
$67.08
-4.99%
|
6/1/2011
|
$65.86
|
PP = $67.18
|
|
MB = $70.54
|
Most Recent Note - 6/3/2011 4:18:09 PM
Y - Small gap down today for a loss on below average volume. No resistance remains from overhead supply, however a breakout on volume is still needed to confirm a proper new technical buy signal. See the latest FSU analysis for details and a new annotated daily graph.
>>> The latest Featured Stock Update with an annotated graph appeared on 6/2/2011. Click here.
View all notes |
Alert me of new notes |
CANSLIM.net Company Profile |
SEC |
Zacks Reports |
StockTalk |
News |
Chart |
Request a new note
C
A N
S L
I M
|
Symbol/Exchange
Company Name
Industry Group |
PRICE |
CHANGE
(%Change) |
Day High |
Volume
(% DAV)
(% 50 day avg vol) |
52 Wk Hi
% From Hi |
Featured
Date |
Price
Featured |
Pivot Featured |
|
Max Buy |
PCLN
-
NASDAQ
Priceline.Com Inc
INTERNET - Internet Software and Services
|
$507.80
|
-4.98
-0.97% |
$516.36
|
896,979
82.42% of 50 DAV
50 DAV is 1,088,300
|
$561.88
-9.62%
|
1/3/2011
|
$399.55
|
PP = $428.20
|
|
MB = $449.61
|
Most Recent Note - 6/2/2011 3:17:10 PM
G - Recent gains with below average volume followed distributional action and it is lingering near its 50 DMA line now. Recent chart low ($487.70 on 5/25/11) defines an important near-term support level where further deterioration would raise even greater concerns.
>>> The latest Featured Stock Update with an annotated graph appeared on 5/19/2011. Click here.
View all notes |
Alert me of new notes |
CANSLIM.net Company Profile |
SEC |
Zacks Reports |
StockTalk |
News |
Chart |
Request a new note
C
A N
S L
I M
|
RAX
-
NYSE
Rackspace Hosting Inc
INTERNET - Internet Software and; Services
|
$43.38
|
-0.93
-2.10% |
$44.24
|
2,113,742
113.96% of 50 DAV
50 DAV is 1,854,800
|
$46.50
-6.70%
|
6/3/2011
|
$43.36
|
PP = $46.59
|
|
MB = $48.92
|
Most Recent Note - 6/3/2011 4:05:52 PM
Y - Consolidating above its 50 DMA line, perched within close striking distance of its 52-week high. Color code is changed to yellow with new pivot point based on its 52-week high plus 10 cents. Deterioration below its 50 DMA line recent chart low ($38.84 on 5/12/11) would trigger more worrisome technical sell signals.
>>> The latest Featured Stock Update with an annotated graph appeared on 5/13/2011. Click here.
View all notes |
Alert me of new notes |
CANSLIM.net Company Profile |
SEC |
Zacks Reports |
StockTalk |
News |
Chart |
Request a new note
C
A N
S L
I M
|
TIBX
-
NASDAQ
Tibco Software Inc
COMPUTER SOFTWARE and SERVICES - Business Software and Services
|
$26.64
|
-0.80
-2.92% |
$27.14
|
2,738,229
99.27% of 50 DAV
50 DAV is 2,758,400
|
$30.75
-13.37%
|
3/18/2011
|
$23.88
|
PP = $26.04
|
|
MB = $27.34
|
Most Recent Note - 6/3/2011 3:46:24 PM
G - Gapped down today and serious concerns were raised this week after it technically triggered sell signals with losses and slumped below its 50 DMA line. Overhead supply may act as resistance.
>>> The latest Featured Stock Update with an annotated graph appeared on 5/18/2011. Click here.
View all notes |
Alert me of new notes |
CANSLIM.net Company Profile |
SEC |
Zacks Reports |
StockTalk |
News |
Chart |
Request a new note
C
A N
S L
I M
|
ULTA
-
NASDAQ
Ulta Salon Cosm & Frag
SPECIALTY RETAIL - Specialty Retail, Other
|
$51.06
|
+0.47
0.93% |
$51.61
|
1,426,612
283.51% of 50 DAV
50 DAV is 503,200
|
$57.17
-10.69%
|
1/6/2011
|
$36.12
|
PP = $37.34
|
|
MB = $39.21
|
Most Recent Note - 6/2/2011 3:05:24 PM
G - Slumping under its 50 DMA line today with a second consecutive loss with above average volume, raising concerns. It is poised for its lowest close since 4/19/11, while a subsequent violation of its recent low ($50.43 on 5/23/11) may trigger a more worrisome technical sell signal.
>>> The latest Featured Stock Update with an annotated graph appeared on 5/26/2011. Click here.
View all notes |
Alert me of new notes |
CANSLIM.net Company Profile |
SEC |
Zacks Reports |
StockTalk |
News |
Chart |
Request a new note
C
A N
S L
I M
|
ZAGG
-
NASDAQ
Zagg Inc
SPECIALTY RETAIL - Specialty Retail, Other
|
$10.99
|
-0.20
-1.79% |
$11.42
|
1,314,149
108.02% of 50 DAV
50 DAV is 1,216,600
|
$11.53
-4.68%
|
6/1/2011
|
$10.92
|
PP = $10.59
|
|
MB = $11.12
|
Most Recent Note - 6/3/2011 3:48:41 PM
Y - Still holding its ground today after technically breaking out from a cup-with-handle type base this week. Prior high closes define important chart support to watch on pullbacks. See the latest FSU analysis for more details and an annotated graph.
>>> The latest Featured Stock Update with an annotated graph appeared on 6/1/2011. Click here.
View all notes |
Alert me of new notes |
CANSLIM.net Company Profile |
SEC |
Zacks Reports |
StockTalk |
News |
Chart |
Request a new note
C
A N
S L
I M
|
Symbol/Exchange
Company Name
Industry Group |
PRICE |
CHANGE
(%Change) |
Day High |
Volume
(% DAV)
(% 50 day avg vol) |
52 Wk Hi
% From Hi |
Featured
Date |
Price
Featured |
Pivot Featured |
|
Max Buy |