***Last / Change / Volume data in this table is the closing quote data***
Symbol/Exchange
Company Name
Industry Group |
PRICE |
CHANGE
(%Change) |
Day High |
Volume
(% DAV)
(% 50 day avg vol) |
52 Wk Hi
% From Hi |
Featured
Date |
Price
Featured |
Pivot Featured |
|
Max Buy |
CACC
-
NASDAQ
Credit Acceptance Corp
FINANCIAL SERVICES - Credit Services
|
$76.18
|
+0.20
0.26% |
$77.29
|
43,453
119.71% of 50 DAV
50 DAV is 36,300
|
$82.29
-7.42%
|
6/2/2011
|
$76.10
|
PP = $82.39
|
|
MB = $86.51
|
Most Recent Note - 6/2/2011
Y - This high-ranked leader in the Finance - Consumer Loans industry is thinly traded (33,300 shares average daily volume) and has a small supply (S criteria) of shares outstanding. Strong earnings history satisfies the C and A criteria. It is consolidating near its 50 DMA line which defines important support along with recent lows near $75. A subsequent gain above its pivot point with heavy volume would trigger a technical buy signal, meanwhile it has formed a sound new base pattern of sufficient length and its color coded is changed to yellow with a pivot point based on its 52-week high plus 10 cents.

>>> The latest Featured Stock Update with an annotated graph appeared on 12/20/2010. Click here.
View all notes |
Alert me of new notes |
CANSLIM.net Company Profile |
SEC |
Zacks Reports |
StockTalk |
News |
Chart |
Request a new note
C
A N
S L
I M


|
CEVA
-
NASDAQ
Ceva Inc
ELECTRONICS - Semiconductor - Specialized
|
$32.75
|
-0.46
-1.39% |
$33.48
|
178,069
80.65% of 50 DAV
50 DAV is 220,800
|
$35.60
-8.01%
|
5/25/2011
|
$32.98
|
PP = $32.05
|
|
MB = $33.65
|
 Most Recent Note - 6/2/2011 3:40:57 PM
Y - Pulling back on very light volume today. After getting extended from its prior base with a streak of 4 consecutive gains with above average volume it has consolidated back below its "max buy" level.
>>> The latest Featured Stock Update with an annotated graph appeared on 5/25/2011. Click here.
View all notes |
Alert me of new notes |
CANSLIM.net Company Profile |
SEC |
Zacks Reports |
StockTalk |
News |
Chart |
Request a new note
C
A N
S L
I M
|
CMG
-
NYSE
Chipotle Mexican Grill
LEISURE - Restaurants
|
$285.79
|
+0.23
0.08% |
$288.69
|
826,101
76.19% of 50 DAV
50 DAV is 1,084,200
|
$295.99
-3.45%
|
4/1/2011
|
$274.00
|
PP = $275.10
|
|
MB = $288.86
|
Most Recent Note - 6/1/2011 5:26:36 PM
G - Down today with very quiet volume while perched near its all-time high. No resistance remains due to overhead supply. Formed a 5-week base with volume totals cooling in recent weeks while finding support near its 50 DMA line. Its sub par earnings increase of +23% in the latest quarter ended March 31st, 2011 versus the year ago period raised concern while marking its weakest quarterly earnings increase in more than 2 years.
>>> The latest Featured Stock Update with an annotated graph appeared on 5/17/2011. Click here.
View all notes |
Alert me of new notes |
CANSLIM.net Company Profile |
SEC |
Zacks Reports |
StockTalk |
News |
Chart |
Request a new note
C
A N
S L
I M
|
EZPW
-
NASDAQ
Ezcorp Inc Cl A
SPECIALTY RETAIL - Specialty Retail, Other
|
$31.81
|
+0.08
0.25% |
$32.08
|
431,852
119.46% of 50 DAV
50 DAV is 361,500
|
$33.31
-4.50%
|
2/18/2011
|
$27.94
|
PP = $30.04
|
|
MB = $31.54
|
Most Recent Note - 6/1/2011 5:28:59 PM
G - There was a negative reversal today for a loss on higher volume after touching a new 52-week high. Its volume-driven gain on 5/31/11 helped it rally from a choppy 8-week consolidation, not a sound looking base pattern. Recent lows and its 50 DMA line define important nearby chart support to watch where technical violations would raise more serious concerns.
>>> The latest Featured Stock Update with an annotated graph appeared on 5/10/2011. Click here.
View all notes |
Alert me of new notes |
CANSLIM.net Company Profile |
SEC |
Zacks Reports |
StockTalk |
News |
Chart |
Request a new note
C
A N
S L
I M
|
FCFS
-
NASDAQ
First Cash Financial Svs
SPECIALTY RETAIL - Specialty Retail, Other
|
$38.90
|
-0.35
-0.89% |
$39.22
|
435,488
221.28% of 50 DAV
50 DAV is 196,800
|
$42.36
-8.17%
|
5/31/2011
|
$42.00
|
PP = $40.23
|
|
MB = $42.24
|
Most Recent Note - 6/2/2011 5:46:45 PM
G - Finished in the upper third of its intra-day range today, finding prompt support after slumping below its 50 DMA line intra-day. Its color code is changed to green as it still finished the session with a loss on higher volume and negated its latest breakout. See the latest FSU analysis for more details and an annotated graph.
>>> The latest Featured Stock Update with an annotated graph appeared on 5/31/2011. Click here.
View all notes |
Alert me of new notes |
CANSLIM.net Company Profile |
SEC |
Zacks Reports |
StockTalk |
News |
Chart |
Request a new note
C
A N
S L
I M
|
Symbol/Exchange
Company Name
Industry Group |
PRICE |
CHANGE
(%Change) |
Day High |
Volume
(% DAV)
(% 50 day avg vol) |
52 Wk Hi
% From Hi |
Featured
Date |
Price
Featured |
Pivot Featured |
|
Max Buy |
FOSL
-
NASDAQ
Fossil Inc
CONSUMER DURABLES - Recreational Goods, Other
|
$102.26
|
+0.20
0.20% |
$103.14
|
337,727
44.22% of 50 DAV
50 DAV is 763,800
|
$107.54
-4.91%
|
2/1/2011
|
$73.30
|
PP = $74.44
|
|
MB = $78.16
|
Most Recent Note - 6/1/2011 2:01:34 PM
G - Pulling back today, its volume totals have been cooling while consolidating in a tight range since its considerable gap up gain on 5/10/11 for a new all-time high. It is extended from any sound base. Prior highs near $96 define initial support to watch above its 50 DMA line.
>>> The latest Featured Stock Update with an annotated graph appeared on 5/2/2011. Click here.
View all notes |
Alert me of new notes |
CANSLIM.net Company Profile |
SEC |
Zacks Reports |
StockTalk |
News |
Chart |
Request a new note
C
A N
S L
I M
|
HMSY
-
NASDAQ
H M S Holdings Corp
COMPUTER SOFTWARE and SERVICES - Healthcare Information Service
|
$76.62
|
+0.35
0.46% |
$77.11
|
82,652
52.11% of 50 DAV
50 DAV is 158,600
|
$84.82
-9.67%
|
11/19/2010
|
$61.89
|
PP = $63.01
|
|
MB = $66.16
|
Most Recent Note - 6/1/2011 5:41:17 PM
G - Down on below average volume today. It has lingered for the past 4 weeks below its 50 DMA line which may now act as resistance. A rally above it would improve its technical stance. Deterioration below its recent chart low ($73.27) would raise more serious concerns and trigger an additional sell signal.
>>> The latest Featured Stock Update with an annotated graph appeared on 5/23/2011. Click here.
View all notes |
Alert me of new notes |
CANSLIM.net Company Profile |
SEC |
Zacks Reports |
StockTalk |
News |
Chart |
Request a new note
C
A N
S L
I M
|
HS
-
NYSE
Healthspring Inc
HEALTH SERVICES - Health Care Plans
|
$43.05
|
+0.05
0.12% |
$43.60
|
683,386
69.23% of 50 DAV
50 DAV is 987,100
|
$45.11
-4.57%
|
3/22/2011
|
$38.29
|
PP = $38.85
|
|
MB = $40.79
|
Most Recent Note - 6/1/2011 5:42:57 PM
G - Encountered mild distribuitional pressure today following 4 consecutive small gains on lighter volume. Its 50 DMA line defines important chart support to watch where a violation would trigger technical sell signals.
>>> The latest Featured Stock Update with an annotated graph appeared on 5/20/2011. Click here.
View all notes |
Alert me of new notes |
CANSLIM.net Company Profile |
SEC |
Zacks Reports |
StockTalk |
News |
Chart |
Request a new note
C
A N
S L
I M
|
INFA
-
NASDAQ
Informatica Corp
COMPUTER SOFTWARE and SERVICES - Business Software and Services
|
$58.18
|
-0.12
-0.21% |
$58.74
|
1,053,696
88.27% of 50 DAV
50 DAV is 1,193,700
|
$59.98
-3.00%
|
3/24/2011
|
$50.04
|
PP = $49.86
|
|
MB = $52.35
|
Most Recent Note - 6/1/2011 5:43:46 PM
G - Hit another new 52-week high today then reversed into the red, pausing after 4 consecutive gains on ever-increasing volume. This high-ranked Computer Software - Database firm did not form a sound new base pattern. Its 50 DMA line defines near-term support to watch.
>>> The latest Featured Stock Update with an annotated graph appeared on 5/24/2011. Click here.
View all notes |
Alert me of new notes |
CANSLIM.net Company Profile |
SEC |
Zacks Reports |
StockTalk |
News |
Chart |
Request a new note
C
A N
S L
I M
|
LULU
-
NASDAQ
Lululemon Athletica
MANUFACTURING - Textile Manufacturing
|
$87.32
|
-0.59
-0.67% |
$88.78
|
1,783,852
87.94% of 50 DAV
50 DAV is 2,028,600
|
$102.83
-15.08%
|
5/18/2011
|
$98.15
|
PP = $102.93
|
|
MB = $108.08
|
Most Recent Note - 6/1/2011 5:00:42 PM
G - Sank to a close even further below its 50 DMA line with today's loss on average volume. Overhead supply may hinder its ability to rally for the near term. It failed to confirm a recent buy signal since a new pivot point was cited, and it triggered technical sell signals with damaging losses on above average volume last week.
>>> The latest Featured Stock Update with an annotated graph appeared on 5/27/2011. Click here.
View all notes |
Alert me of new notes |
CANSLIM.net Company Profile |
SEC |
Zacks Reports |
StockTalk |
News |
Chart |
Request a new note
C
A N
S L
I M
|
Symbol/Exchange
Company Name
Industry Group |
PRICE |
CHANGE
(%Change) |
Day High |
Volume
(% DAV)
(% 50 day avg vol) |
52 Wk Hi
% From Hi |
Featured
Date |
Price
Featured |
Pivot Featured |
|
Max Buy |
MELI
-
NASDAQ
Mercadolibre Inc
INTERNET - Internet Software and; Services
|
$89.70
|
+1.70
1.93% |
$89.81
|
624,619
89.17% of 50 DAV
50 DAV is 700,500
|
$92.73
-3.27%
|
6/1/2011
|
$90.55
|
PP = $92.83
|
|
MB = $97.47
|
Most Recent Note - 6/2/2011 3:43:45 PM
Y - While approaching its all-time high it was featured in the 6/01/11 mid-day report in yellow and noted - "With new pivot point cited based on its high plus 10 cents after a short flat base above its 50 DMA line and prior highs which define chart support on pullbacks. A technical breakout with sufficient volume is needed to subsequently confirm a proper new buy signal. Based on technical deterioration it was dropped from the Featured Stocks list on 10/19/10, and it found support at its long-term 200 DMA line in the interim."

>>> The latest Featured Stock Update with an annotated graph appeared on 10/19/2010. Click here.
View all notes |
Alert me of new notes |
CANSLIM.net Company Profile |
SEC |
Zacks Reports |
StockTalk |
News |
Chart |
Request a new note
C
A N
S L
I M
|
MG
-
NYSE
Mistras Group Inc
DIVERSIFIED SERVICES - Bulding and Faci;ity Management Services
|
$16.88
|
-0.24
-1.40% |
$17.17
|
63,936
39.10% of 50 DAV
50 DAV is 163,500
|
$18.46
-8.56%
|
3/15/2011
|
$15.48
|
PP = $15.90
|
|
MB = $16.70
|
Most Recent Note - 6/2/2011 3:23:17 PM
G - Today's loss with light volume has it slumping back below its 50 DMA line. The recent low ($16.10 on 5/25/11) defines near-term chart support to watch since its recently completed Public Offering.
>>> The latest Featured Stock Update with an annotated graph appeared on 5/12/2011. Click here.
View all notes |
Alert me of new notes |
CANSLIM.net Company Profile |
SEC |
Zacks Reports |
StockTalk |
News |
Chart |
Request a new note
C
A N
S L
I M
|
MWIV
-
NASDAQ
M W I Veterinary Supply
HEALTH SERVICES - Medical Instruments and; Supplies
|
$81.82
|
+0.07
0.09% |
$82.89
|
124,148
138.10% of 50 DAV
50 DAV is 89,900
|
$86.99
-5.94%
|
11/4/2010
|
$61.79
|
PP = $59.60
|
|
MB = $62.58
|
Most Recent Note - 6/1/2011 5:09:43 PM
G - Down today with above average volume, slumping back toward its 50 DMA line and recent chart lows defining important support to watch. Stubbornly held its ground in recent weeks, but it did not form a sound new base pattern.
>>> The latest Featured Stock Update with an annotated graph appeared on 5/5/2011. Click here.
View all notes |
Alert me of new notes |
CANSLIM.net Company Profile |
SEC |
Zacks Reports |
StockTalk |
News |
Chart |
Request a new note
C
A N
S L
I M
|
OPNT
-
NASDAQ
Opnet Technologies
INTERNET - Internet Software and Services
|
$38.75
|
+0.19
0.49% |
$39.03
|
95,001
72.19% of 50 DAV
50 DAV is 131,600
|
$42.51
-8.84%
|
5/11/2011
|
$41.21
|
PP = $40.50
|
|
MB = $42.53
|
Most Recent Note - 6/1/2011 5:44:45 PM
G - Churned heavy volume for a second consecutive session with another small loss today while consolidating just above its 50 DMA line. It faces very little resistance due to overhead supply.
>>> The latest Featured Stock Update with an annotated graph appeared on 5/11/2011. Click here.
View all notes |
Alert me of new notes |
CANSLIM.net Company Profile |
SEC |
Zacks Reports |
StockTalk |
News |
Chart |
Request a new note
C
A N
S L
I M
|
OTEX
-
NASDAQ
Open Text Corp
INTERNET - Internet Software and Services
|
$65.00
|
-0.46
-0.70% |
$65.90
|
394,565
113.25% of 50 DAV
50 DAV is 348,400
|
$67.08
-3.10%
|
6/1/2011
|
$65.86
|
PP = $67.18
|
|
MB = $70.54
|
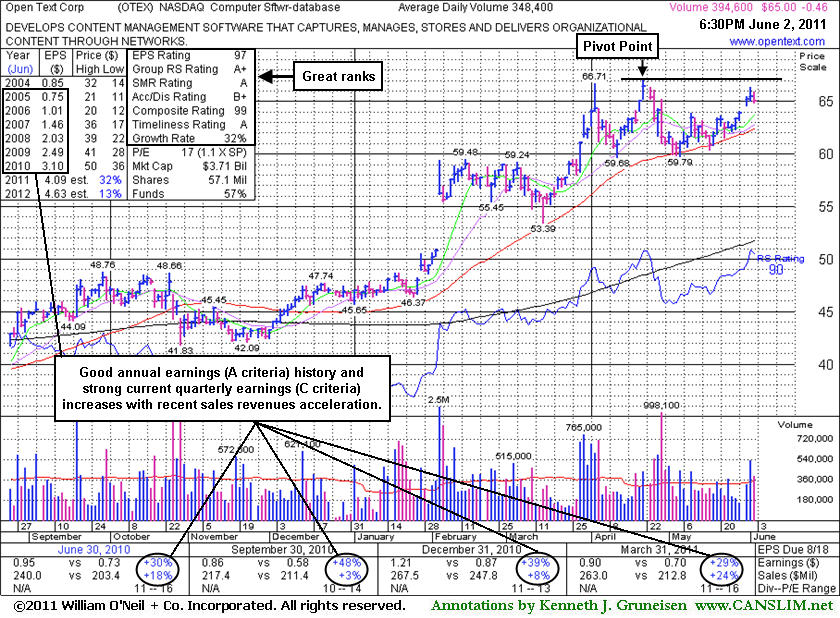
Most Recent Note - 6/2/2011 6:59:18 PM
Y - No resistance remains from overhead supply, however a breakout on volume is still needed to confirm a proper new technical buy signal. See the latest FSU analysis for details and a new annotated daily graph.
>>> The latest Featured Stock Update with an annotated graph appeared on 6/2/2011. Click here.
View all notes |
Alert me of new notes |
CANSLIM.net Company Profile |
SEC |
Zacks Reports |
StockTalk |
News |
Chart |
Request a new note
C
A N
S L
I M
|
Symbol/Exchange
Company Name
Industry Group |
PRICE |
CHANGE
(%Change) |
Day High |
Volume
(% DAV)
(% 50 day avg vol) |
52 Wk Hi
% From Hi |
Featured
Date |
Price
Featured |
Pivot Featured |
|
Max Buy |
PCLN
-
NASDAQ
Priceline.Com Inc
INTERNET - Internet Software and Services
|
$512.78
|
+5.72
1.13% |
$514.98
|
757,214
68.85% of 50 DAV
50 DAV is 1,099,800
|
$561.88
-8.74%
|
1/3/2011
|
$399.55
|
PP = $428.20
|
|
MB = $449.61
|
Most Recent Note - 6/2/2011 3:17:10 PM
G - Recent gains with below average volume followed distributional action and it is lingering near its 50 DMA line now. Recent chart low ($487.70 on 5/25/11) defines an important near-term support level where further deterioration would raise even greater concerns.
>>> The latest Featured Stock Update with an annotated graph appeared on 5/19/2011. Click here.
View all notes |
Alert me of new notes |
CANSLIM.net Company Profile |
SEC |
Zacks Reports |
StockTalk |
News |
Chart |
Request a new note
C
A N
S L
I M
|
RAX
-
NYSE
Rackspace Hosting Inc
INTERNET - Internet Software and; Services
|
$44.31
|
+0.41
0.93% |
$44.71
|
1,898,480
103.06% of 50 DAV
50 DAV is 1,842,100
|
$46.50
-4.70%
|
3/16/2011
|
$36.28
|
PP = $40.72
|
|
MB = $42.76
|
Most Recent Note - 6/2/2011 3:37:20 PM
G - Consolidating above its 50 DMA line within close striking distance of its 52-week high. It has not formed a sound new base pattern. Deterioration below its 50 DMA line recent chart low ($38.84 on 5/12/11) would trigger more worrisome technical sell signals.
>>> The latest Featured Stock Update with an annotated graph appeared on 5/13/2011. Click here.
View all notes |
Alert me of new notes |
CANSLIM.net Company Profile |
SEC |
Zacks Reports |
StockTalk |
News |
Chart |
Request a new note
C
A N
S L
I M
|
TIBX
-
NASDAQ
Tibco Software Inc
COMPUTER SOFTWARE and SERVICES - Business Software and Services
|
$27.44
|
+0.14
0.51% |
$27.71
|
2,031,541
74.13% of 50 DAV
50 DAV is 2,740,500
|
$30.75
-10.76%
|
3/18/2011
|
$23.88
|
PP = $26.04
|
|
MB = $27.34
|
Most Recent Note - 6/1/2011 5:20:22 PM
G - Today marked its lowest close since its 4/12/11 gap up gain on high volume, erasing all progress it made and leaving it now with 7-weeks worth of overhead supply to act as resistance. More damaging losses may raise serious concerns after it technically triggered sell signals with losses and slumped further below its 50 DMA line.
>>> The latest Featured Stock Update with an annotated graph appeared on 5/18/2011. Click here.
View all notes |
Alert me of new notes |
CANSLIM.net Company Profile |
SEC |
Zacks Reports |
StockTalk |
News |
Chart |
Request a new note
C
A N
S L
I M
|
ULTA
-
NASDAQ
Ulta Salon Cosm & Frag
SPECIALTY RETAIL - Specialty Retail, Other
|
$50.59
|
-3.53
-6.52% |
$53.93
|
1,406,493
290.78% of 50 DAV
50 DAV is 483,700
|
$57.17
-11.51%
|
1/6/2011
|
$36.12
|
PP = $37.34
|
|
MB = $39.21
|
Most Recent Note - 6/2/2011 3:05:24 PM
G - Slumping under its 50 DMA line today with a second consecutive loss with above average volume, raising concerns. It is poised for its lowest close since 4/19/11, while a subsequent violation of its recent low ($50.43 on 5/23/11) may trigger a more worrisome technical sell signal.
>>> The latest Featured Stock Update with an annotated graph appeared on 5/26/2011. Click here.
View all notes |
Alert me of new notes |
CANSLIM.net Company Profile |
SEC |
Zacks Reports |
StockTalk |
News |
Chart |
Request a new note
C
A N
S L
I M
|
ZAGG
-
NASDAQ
Zagg Inc
SPECIALTY RETAIL - Specialty Retail, Other
|
$11.19
|
+0.15
1.36% |
$11.53
|
1,907,512
157.88% of 50 DAV
50 DAV is 1,208,200
|
$11.42
-2.01%
|
6/1/2011
|
$10.92
|
PP = $10.59
|
|
MB = $11.12
|
Most Recent Note - 6/2/2011 1:03:46 PM
Y - Holding its ground today after technically breaking out from a cup-with-handle type base. Prior high closes define important chart support to watch on pullbacks. See the latest FSU analysis for more details and an annotated graph.
>>> The latest Featured Stock Update with an annotated graph appeared on 6/1/2011. Click here.
View all notes |
Alert me of new notes |
CANSLIM.net Company Profile |
SEC |
Zacks Reports |
StockTalk |
News |
Chart |
Request a new note
C
A N
S L
I M
|
Symbol/Exchange
Company Name
Industry Group |
PRICE |
CHANGE
(%Change) |
Day High |
Volume
(% DAV)
(% 50 day avg vol) |
52 Wk Hi
% From Hi |
Featured
Date |
Price
Featured |
Pivot Featured |
|
Max Buy |