***Last / Change / Volume data in this table is the closing quote data***
Symbol/Exchange
Company Name
Industry Group |
PRICE |
CHANGE
(%Change) |
Day High |
Volume
(% DAV)
(% 50 day avg vol) |
52 Wk Hi
% From Hi |
Featured
Date |
Price
Featured |
Pivot Featured |
|
Max Buy |
CEVA
-
NASDAQ
Ceva Inc
ELECTRONICS - Semiconductor - Specialized
|
$33.21
|
-1.12
-3.26% |
$34.50
|
343,009
157.42% of 50 DAV
50 DAV is 217,900
|
$35.60
-6.71%
|
5/25/2011
|
$32.98
|
PP = $32.05
|
|
MB = $33.65
|
 Most Recent Note - 6/1/2011 5:24:13 PM
Y - Paused today and pulled back after a streak of 4 consecutive gains with above average volume to new 52-week highs. It sank below its "max buy" level and its color code is changed to yellow.
>>> The latest Featured Stock Update with an annotated graph appeared on 5/25/2011. Click here.
View all notes |
Alert me of new notes |
CANSLIM.net Company Profile |
SEC |
Zacks Reports |
StockTalk |
News |
Chart |
Request a new note
C
A N
S L
I M


|
CMG
-
NYSE
Chipotle Mexican Grill
LEISURE - Restaurants
|
$285.56
|
-3.51
-1.21% |
$291.40
|
591,513
54.48% of 50 DAV
50 DAV is 1,085,700
|
$295.99
-3.52%
|
4/1/2011
|
$274.00
|
PP = $275.10
|
|
MB = $288.86
|
Most Recent Note - 6/1/2011 5:26:36 PM
G - Down today with very quiet volume while perched near its all-time high. No resistance remains due to overhead supply. Formed a 5-week base with volume totals cooling in recent weeks while finding support near its 50 DMA line. Its sub par earnings increase of +23% in the latest quarter ended March 31st, 2011 versus the year ago period raised concern while marking its weakest quarterly earnings increase in more than 2 years.
>>> The latest Featured Stock Update with an annotated graph appeared on 5/17/2011. Click here.
View all notes |
Alert me of new notes |
CANSLIM.net Company Profile |
SEC |
Zacks Reports |
StockTalk |
News |
Chart |
Request a new note
C
A N
S L
I M
|
EZPW
-
NASDAQ
Ezcorp Inc Cl A
SPECIALTY RETAIL - Specialty Retail, Other
|
$31.73
|
-1.06
-3.23% |
$33.31
|
708,750
199.82% of 50 DAV
50 DAV is 354,700
|
$33.08
-4.08%
|
2/18/2011
|
$27.94
|
PP = $30.04
|
|
MB = $31.54
|
Most Recent Note - 6/1/2011 5:28:59 PM
G - There was a negative reversal today for a loss on higher volume after touching a new 52-week high. Its volume-driven gain on 5/31/11 helped it rally from a choppy 8-week consolidation, not a sound looking base pattern. Recent lows and its 50 DMA line define important nearby chart support to watch where technical violations would raise more serious concerns.
>>> The latest Featured Stock Update with an annotated graph appeared on 5/10/2011. Click here.
View all notes |
Alert me of new notes |
CANSLIM.net Company Profile |
SEC |
Zacks Reports |
StockTalk |
News |
Chart |
Request a new note
C
A N
S L
I M
|
FCFS
-
NASDAQ
First Cash Financial Svs
SPECIALTY RETAIL - Specialty Retail, Other
|
$39.25
|
-2.50
-5.99% |
$42.26
|
311,036
158.94% of 50 DAV
50 DAV is 195,700
|
$42.36
-7.34%
|
5/31/2011
|
$42.00
|
PP = $40.23
|
|
MB = $42.24
|
Most Recent Note - 6/1/2011 5:38:35 PM
Y - Down considerably today with above average volume, negating its latest breakout and finishing near the session low while slumping well below its pivot point and prior high close. Reversing into its prior base raised concerns immediately after rising from an orderly flat base pattern with 3 times average volume. See the latest FSU analysis for more details and an annotated graph.
>>> The latest Featured Stock Update with an annotated graph appeared on 5/31/2011. Click here.
View all notes |
Alert me of new notes |
CANSLIM.net Company Profile |
SEC |
Zacks Reports |
StockTalk |
News |
Chart |
Request a new note
C
A N
S L
I M
|
FOSL
-
NASDAQ
Fossil Inc
CONSUMER DURABLES - Recreational Goods, Other
|
$102.06
|
-3.78
-3.57% |
$106.20
|
474,358
61.40% of 50 DAV
50 DAV is 772,600
|
$107.54
-5.09%
|
2/1/2011
|
$73.30
|
PP = $74.44
|
|
MB = $78.16
|
Most Recent Note - 6/1/2011 2:01:34 PM
G - Pulling back today, its volume totals have been cooling while consolidating in a tight range since its considerable gap up gain on 5/10/11 for a new all-time high. It is extended from any sound base. Prior highs near $96 define initial support to watch above its 50 DMA line.
>>> The latest Featured Stock Update with an annotated graph appeared on 5/2/2011. Click here.
View all notes |
Alert me of new notes |
CANSLIM.net Company Profile |
SEC |
Zacks Reports |
StockTalk |
News |
Chart |
Request a new note
C
A N
S L
I M
|
Symbol/Exchange
Company Name
Industry Group |
PRICE |
CHANGE
(%Change) |
Day High |
Volume
(% DAV)
(% 50 day avg vol) |
52 Wk Hi
% From Hi |
Featured
Date |
Price
Featured |
Pivot Featured |
|
Max Buy |
HMSY
-
NASDAQ
H M S Holdings Corp
COMPUTER SOFTWARE and SERVICES - Healthcare Information Service
|
$76.27
|
-1.79
-2.29% |
$78.13
|
131,879
82.94% of 50 DAV
50 DAV is 159,000
|
$84.82
-10.08%
|
11/19/2010
|
$61.89
|
PP = $63.01
|
|
MB = $66.16
|
Most Recent Note - 6/1/2011 5:41:17 PM
G - Down on below average volume today. It has lingered for the past 4 weeks below its 50 DMA line which may now act as resistance. A rally above it would improve its technical stance. Deterioration below its recent chart low ($73.27) would raise more serious concerns and trigger an additional sell signal.
>>> The latest Featured Stock Update with an annotated graph appeared on 5/23/2011. Click here.
View all notes |
Alert me of new notes |
CANSLIM.net Company Profile |
SEC |
Zacks Reports |
StockTalk |
News |
Chart |
Request a new note
C
A N
S L
I M
|
HS
-
NYSE
Healthspring Inc
HEALTH SERVICES - Health Care Plans
|
$43.00
|
-0.85
-1.94% |
$44.35
|
840,793
85.38% of 50 DAV
50 DAV is 984,800
|
$45.11
-4.68%
|
3/22/2011
|
$38.29
|
PP = $38.85
|
|
MB = $40.79
|
Most Recent Note - 6/1/2011 5:42:57 PM
G - Encountered mild distribuitional pressure today following 4 consecutive small gains on lighter volume. Its 50 DMA line defines important chart support to watch where a violation would trigger technical sell signals.
>>> The latest Featured Stock Update with an annotated graph appeared on 5/20/2011. Click here.
View all notes |
Alert me of new notes |
CANSLIM.net Company Profile |
SEC |
Zacks Reports |
StockTalk |
News |
Chart |
Request a new note
C
A N
S L
I M
|
INFA
-
NASDAQ
Informatica Corp
COMPUTER SOFTWARE and SERVICES - Business Software and Services
|
$58.30
|
-0.36
-0.61% |
$59.98
|
1,634,840
138.39% of 50 DAV
50 DAV is 1,181,300
|
$59.00
-1.19%
|
3/24/2011
|
$50.04
|
PP = $49.86
|
|
MB = $52.35
|
Most Recent Note - 6/1/2011 5:43:46 PM
G - Hit another new 52-week high today then reversed into the red, pausing after 4 consecutive gains on ever-increasing volume. This high-ranked Computer Software - Database firm did not form a sound new base pattern. Its 50 DMA line defines near-term support to watch.
>>> The latest Featured Stock Update with an annotated graph appeared on 5/24/2011. Click here.
View all notes |
Alert me of new notes |
CANSLIM.net Company Profile |
SEC |
Zacks Reports |
StockTalk |
News |
Chart |
Request a new note
C
A N
S L
I M
|
LULU
-
NASDAQ
Lululemon Athletica
MANUFACTURING - Textile Manufacturing
|
$87.91
|
-2.89
-3.18% |
$90.39
|
2,027,355
99.87% of 50 DAV
50 DAV is 2,030,000
|
$102.83
-14.51%
|
5/18/2011
|
$98.15
|
PP = $102.93
|
|
MB = $108.08
|
Most Recent Note - 6/1/2011 5:00:42 PM
G - Sank to a close even further below its 50 DMA line with today's loss on average volume. Overhead supply may hinder its ability to rally for the near term. It failed to confirm a recent buy signal since a new pivot point was cited, and it triggered technical sell signals with damaging losses on above average volume last week.
>>> The latest Featured Stock Update with an annotated graph appeared on 5/27/2011. Click here.
View all notes |
Alert me of new notes |
CANSLIM.net Company Profile |
SEC |
Zacks Reports |
StockTalk |
News |
Chart |
Request a new note
C
A N
S L
I M
|
MELI
-
NASDAQ
Mercadolibre Inc
INTERNET - Internet Software and; Services
|
$88.00
|
-0.12
-0.14% |
$92.25
|
1,282,443
187.82% of 50 DAV
50 DAV is 682,800
|
$92.73
-5.10%
|
6/1/2011
|
$90.55
|
PP = $92.83
|
|
MB = $97.47
|
Most Recent Note - 6/1/2011 5:06:59 PM
Y - Reversed an early gain and closed near the session low today for a small loss on nearly 2 times average volume. The action was indicative of distributional pressure while challenging its all-time high. In today's mid-day report its color code was changed to yellow while it was noted - "With new pivot point cited based on its high plus 10 cents after a short flat base above its 50 DMA line and prior highs which define chart support on pullbacks. A technical breakout with sufficient volume is needed to subsequently confirm a proper new buy signal. Based on technical deterioration it was dropped from the Featured Stocks list on 10/19/10, and it found support at its long-term 200 DMA line in the interim."

>>> The latest Featured Stock Update with an annotated graph appeared on 10/19/2010. Click here.
View all notes |
Alert me of new notes |
CANSLIM.net Company Profile |
SEC |
Zacks Reports |
StockTalk |
News |
Chart |
Request a new note
C
A N
S L
I M
|
Symbol/Exchange
Company Name
Industry Group |
PRICE |
CHANGE
(%Change) |
Day High |
Volume
(% DAV)
(% 50 day avg vol) |
52 Wk Hi
% From Hi |
Featured
Date |
Price
Featured |
Pivot Featured |
|
Max Buy |
MG
-
NYSE
Mistras Group Inc
DIVERSIFIED SERVICES - Bulding and Faci;ity Management Services
|
$17.12
|
-0.29
-1.67% |
$17.49
|
168,362
103.61% of 50 DAV
50 DAV is 162,500
|
$18.46
-7.26%
|
3/15/2011
|
$15.48
|
PP = $15.90
|
|
MB = $16.70
|
Most Recent Note - 5/31/2011 3:56:25 PM
G - Today's gain on below average (but higher) volume has it rallying back above its 50 DMA line helping its outlook, technically. The recent low ($15.44 on 5/05/11) defines the next chart support. Completed a new Public Offering on 5/05/11.
>>> The latest Featured Stock Update with an annotated graph appeared on 5/12/2011. Click here.
View all notes |
Alert me of new notes |
CANSLIM.net Company Profile |
SEC |
Zacks Reports |
StockTalk |
News |
Chart |
Request a new note
C
A N
S L
I M
|
MWIV
-
NASDAQ
M W I Veterinary Supply
HEALTH SERVICES - Medical Instruments and; Supplies
|
$81.75
|
-2.55
-3.02% |
$84.30
|
179,832
205.76% of 50 DAV
50 DAV is 87,400
|
$86.99
-6.02%
|
11/4/2010
|
$61.79
|
PP = $59.60
|
|
MB = $62.58
|
Most Recent Note - 6/1/2011 5:09:43 PM
G - Down today with above average volume, slumping back toward its 50 DMA line and recent chart lows defining important support to watch. Stubbornly held its ground in recent weeks, but it did not form a sound new base pattern.
>>> The latest Featured Stock Update with an annotated graph appeared on 5/5/2011. Click here.
View all notes |
Alert me of new notes |
CANSLIM.net Company Profile |
SEC |
Zacks Reports |
StockTalk |
News |
Chart |
Request a new note
C
A N
S L
I M
|
OPNT
-
NASDAQ
Opnet Technologies
INTERNET - Internet Software and Services
|
$38.56
|
-0.61
-1.56% |
$39.32
|
464,160
367.51% of 50 DAV
50 DAV is 126,300
|
$42.51
-9.29%
|
5/11/2011
|
$41.21
|
PP = $40.50
|
|
MB = $42.53
|
Most Recent Note - 6/1/2011 5:44:45 PM
G - Churned heavy volume for a second consecutive session with another small loss today while consolidating just above its 50 DMA line. It faces very little resistance due to overhead supply.
>>> The latest Featured Stock Update with an annotated graph appeared on 5/11/2011. Click here.
View all notes |
Alert me of new notes |
CANSLIM.net Company Profile |
SEC |
Zacks Reports |
StockTalk |
News |
Chart |
Request a new note
C
A N
S L
I M
|
OTEX
-
NASDAQ
Open Text Corp
INTERNET - Internet Software and Services
|
$65.46
|
+0.21
0.32% |
$66.34
|
533,119
156.29% of 50 DAV
50 DAV is 341,100
|
$67.08
-2.42%
|
6/1/2011
|
$65.86
|
PP = $67.18
|
|
MB = $70.54
|
Most Recent Note - 6/1/2011 5:48:08 PM
Y - Found support near prior highs and above its 50 DMA line during its consolidation. Higher than average volume without great price progress may be a sign of distributional pressure. In today's mid-day report its color code was changed to yellow as it was noted - "With pivot point cited based on its high plus 10 cents. No resistance remains from overhead supply, however a breakout on volume is still needed to confirm a proper new technical buy signal. It has a very good annual earnings (the A criteria) history. The 4 latest quarterly earnings increases have been reported above the +25% guideline of the investment system. This Ontario, Canada-based Computer Software - Database firm's sales revenues increased by +24% in the quarter ended March 31, 2011 versus the year ago period. Sales revenues were previously noted at only in the +3-8% range in the Sep '10 and Dec '10 quarters." 
>>> The latest Featured Stock Update with an annotated graph appeared on 4/24/2008. Click here.
View all notes |
Alert me of new notes |
CANSLIM.net Company Profile |
SEC |
Zacks Reports |
StockTalk |
News |
Chart |
Request a new note
C
A N
S L
I M
|
PCLN
-
NASDAQ
Priceline.Com Inc
INTERNET - Internet Software and Services
|
$507.06
|
-8.13
-1.58% |
$519.39
|
958,252
87.01% of 50 DAV
50 DAV is 1,101,300
|
$561.88
-9.76%
|
1/3/2011
|
$399.55
|
PP = $428.20
|
|
MB = $449.61
|
Most Recent Note - 5/31/2011 4:00:07 PM
G - Gain today with below average volume helped it rally just above its 50 DMA line. Losses on higher volume last week were noted as indicative of more distributional pressure. Recent chart low ($493.67 on 5/17/11) defines an important near-term support level where further deterioration would raise even greater concerns.
>>> The latest Featured Stock Update with an annotated graph appeared on 5/19/2011. Click here.
View all notes |
Alert me of new notes |
CANSLIM.net Company Profile |
SEC |
Zacks Reports |
StockTalk |
News |
Chart |
Request a new note
C
A N
S L
I M
|
Symbol/Exchange
Company Name
Industry Group |
PRICE |
CHANGE
(%Change) |
Day High |
Volume
(% DAV)
(% 50 day avg vol) |
52 Wk Hi
% From Hi |
Featured
Date |
Price
Featured |
Pivot Featured |
|
Max Buy |
RAX
-
NYSE
Rackspace Hosting Inc
INTERNET - Internet Software and; Services
|
$43.90
|
-0.10
-0.23% |
$44.49
|
2,561,649
141.06% of 50 DAV
50 DAV is 1,816,000
|
$46.50
-5.58%
|
3/16/2011
|
$36.28
|
PP = $40.72
|
|
MB = $42.76
|
Most Recent Note - 5/31/2011 7:11:48 PM
G - Up today with heavy volume for a 4th consecutive small gain. Consolidating above its 50 DMA line, it has not formed a sound new base pattern but may eventually form a new "late-stage" base. Meanwhile, deterioration below its recent chart low ($38.84 on 5/12/11) would trigger more worrisome technical sell signals.
>>> The latest Featured Stock Update with an annotated graph appeared on 5/13/2011. Click here.
View all notes |
Alert me of new notes |
CANSLIM.net Company Profile |
SEC |
Zacks Reports |
StockTalk |
News |
Chart |
Request a new note
C
A N
S L
I M
|
TIBX
-
NASDAQ
Tibco Software Inc
COMPUTER SOFTWARE and SERVICES - Business Software and Services
|
$27.30
|
-0.79
-2.81% |
$28.39
|
2,648,172
97.58% of 50 DAV
50 DAV is 2,713,800
|
$30.75
-11.22%
|
3/18/2011
|
$23.88
|
PP = $26.04
|
|
MB = $27.34
|
Most Recent Note - 6/1/2011 5:20:22 PM
G - Today marked its lowest close since its 4/12/11 gap up gain on high volume, erasing all progress it made and leaving it now with 7-weeks worth of overhead supply to act as resistance. More damaging losses may raise serious concerns after it technically triggered sell signals with losses and slumped further below its 50 DMA line.
>>> The latest Featured Stock Update with an annotated graph appeared on 5/18/2011. Click here.
View all notes |
Alert me of new notes |
CANSLIM.net Company Profile |
SEC |
Zacks Reports |
StockTalk |
News |
Chart |
Request a new note
C
A N
S L
I M
|
ULTA
-
NASDAQ
Ulta Salon Cosm & Frag
SPECIALTY RETAIL - Specialty Retail, Other
|
$54.12
|
-1.86
-3.32% |
$56.70
|
842,559
176.12% of 50 DAV
50 DAV is 478,400
|
$57.17
-5.33%
|
1/6/2011
|
$36.12
|
PP = $37.34
|
|
MB = $39.21
|
Most Recent Note - 6/1/2011 1:25:06 PM
G - Perched at its all-time high. Found support above its 50 DMA line last week, and currently it is extended from any sound base pattern.
>>> The latest Featured Stock Update with an annotated graph appeared on 5/26/2011. Click here.
View all notes |
Alert me of new notes |
CANSLIM.net Company Profile |
SEC |
Zacks Reports |
StockTalk |
News |
Chart |
Request a new note
C
A N
S L
I M
|
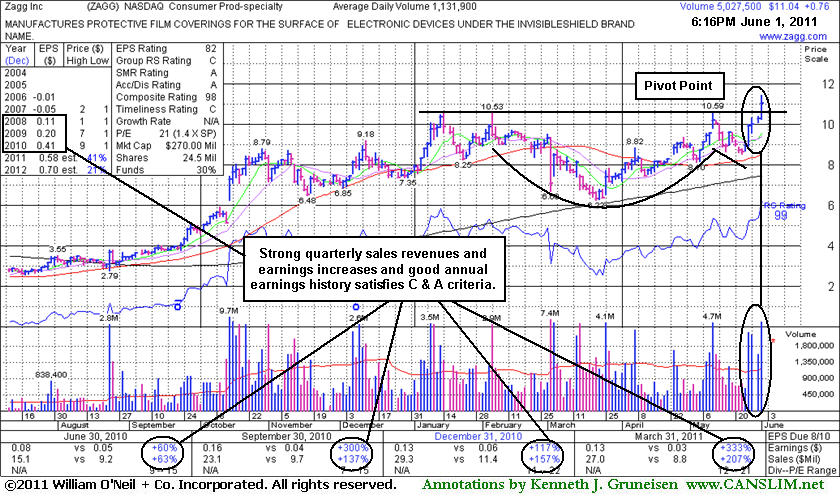
ZAGG
-
NASDAQ
Zagg Inc
SPECIALTY RETAIL - Specialty Retail, Other
|
$11.04
|
+0.76
7.39% |
$11.42
|
5,034,229
444.76% of 50 DAV
50 DAV is 1,131,900
|
$10.59
4.25%
|
6/1/2011
|
$10.92
|
PP = $10.59
|
|
MB = $11.12
|
Most Recent Note - 6/1/2011 5:52:01 PM
Y - Hit a new 52-week high today and closed in the upper half of its intra-day range. Broke out from a cup-with-handle type base with heavy volume behind its 4th consecutive gain triggering a technical buy signal. In recent months its 200 DMA acted as support. In today's mid-day report its color code was changed to yellow with pivot point cited based on its prior high. Quarterly and annual earnings increases satisfy the C and A criteria.
>>> The latest Featured Stock Update with an annotated graph appeared on 6/1/2011. Click here.
View all notes |
Alert me of new notes |
CANSLIM.net Company Profile |
SEC |
Zacks Reports |
StockTalk |
News |
Chart |
Request a new note
C
A N
S L
I M
|