You are not logged in.
This means you
CAN ONLY VIEW reports that were published prior to Monday, April 14, 2025.
You
MUST UPGRADE YOUR MEMBERSHIP if you want to see any current reports.
AFTER MARKET UPDATE - FRIDAY, MAY 28TH, 2010
Previous After Market Report Next After Market Report >>>
|
|
|
|
DOW |
-122.36 |
10,136.63 |
-1.19% |
|
Volume |
1,455,280,630 |
+2% |
|
Volume |
2,076,778,600 |
-10% |
|
NASDAQ |
-20.64 |
2,257.04 |
-0.91% |
|
Advancers |
974 |
31% |
|
Advancers |
857 |
31% |
|
S&P 500 |
-13.65 |
1,089.41 |
-1.24% |
|
Decliners |
2,087 |
66% |
|
Decliners |
1,834 |
66% |
|
Russell 2000 |
-8.90 |
661.61 |
-1.33% |
|
52 Wk Highs |
25 |
|
|
52 Wk Highs |
32 |
|
|
S&P 600 |
-4.79 |
353.31 |
-1.34% |
|
52 Wk Lows |
12 |
|
|
52 Wk Lows |
32 |
|
|
 |
New Rally Effort Still Awaits Follow-Through Day As Confirmation
Adam Sarhan, Contributing Writer,
The major averages closed in the upper half of their respective trading ranges this week after first falling to fresh 2010 lows. On Friday the volume totals in the US markets were mixed, reported slightly higher compared to Thursday's totals on the NYSE while the Nasdaq exchange's volume total was lower. Decliners led advancers by about a 2-to-1 ratio on the NYSE and on the Nasdaq exchange. There were 12 high-ranked companies from the CANSLIM.net Leaders List that made a new 52-week high and appeared on the CANSLIM.net BreakOuts Page, higher than the 9 issues that appeared on Tuesday. New 52-week highs outnumbered new 52-week lows on the NYSE while the totals were even on the Nasdaq exchange.
Stocks closed lower on Monday after the National Association of Realtors said sales of existing homes (i.e. previously owned homes) rose in April to the highest level in five months. The report said buyers scrambled to buy the homes before the government's tax credit expired. Sales increased +7.6% to a 5.77 million annual rate. This was the highest reading since November 2009 which was the month the incentive was first due to expire. The market closed mixed on Tuesday after geopolitical tensions escalated between North and South Korea.
On Wednesday the major averages and the euro negatively reversed (opened higher but closed lower) after Italy announced that it will restructure $30 billion in debt and Germany's bond auction was less than stellar. In the US, the economic news was healthy as new home sales and durable goods both jumped to multi year highs. New home sales rose +15% to an annual pace of +504,000 last month. This was the highest reading in two years which bodes well for the ailing housing market. The report showed that the median price of a new home fell to $198,400 which was the lowest level since December 2003. It was interesting to see that the vast majority of new sales occurred in houses costing less than $300,000 which reflects demand from first-time buyers due to the now expired tax credit. Elsewhere, the Commerce Department said durable goods orders jumped +2.9% which was the highest reading in at least three years.
Stocks surged around the world after China said it remains a long-term investor in Europe, which helped the euro snap a losing streak and allowed China's stock market to score a follow-through day (FTD). In the US, two important economic reports were released: gross domestic product (GDP) and weekly jobless claims. The government said the US economy grew at a slower pace than previously expected in the first quarter and jobless claims fell less than economists expected. First quarter GDP rose +3% compared to last month's reading of a +3.2% increase. Meanwhile, the Labor Department said, initial jobless claims fell by -14,000 to 460,000 in the week ended May 22 which was lower than the Street's forecast of 455,000. On Friday, stocks ended lower as the market prepared for the long holiday weekend.
Friday marked Day 4 of a new rally attempt for the benchmark S&P 500 Index and Day 2 for the other major averages. That said, as long Tuesday's lows are not breached in the S&P 500, the window is now opened for a proper follow-through day (FTD) to occur. However, if at anytime Tuesday's S&P 500 Index lows are breached, then the day count will be reset. What does all of this mean for investors? Simple, the market remains in a correction which reiterates the importance of adopting a strong defense stance until a new rally is confirmed. Trade accordingly.
Professional Money Management Services - Free Portfolio Review:
If your portfolio is greater than $100,000 and you would like a free portfolio review, click here to get connected with one of our portfolio managers. ** Serious inquires only, please.
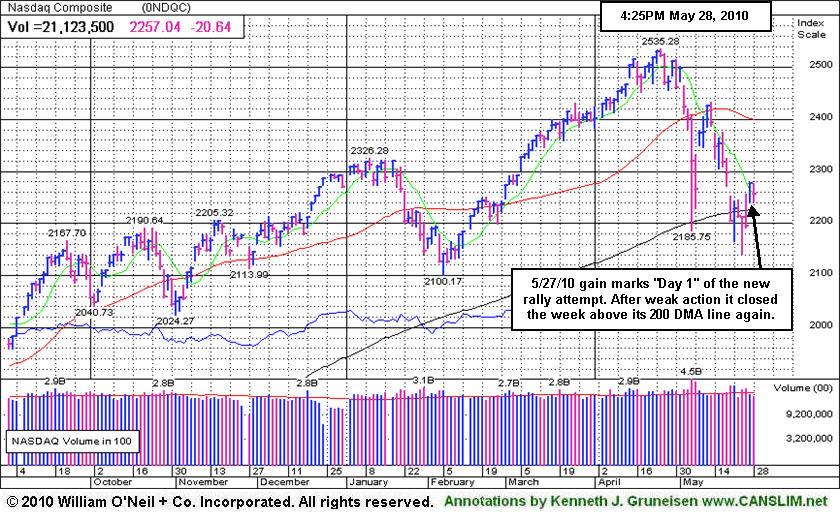
PICTURED: The Nasdaq Composite Index's 5/27/10 gain marked Day 1 of its newest rally attempt after the 5/25/10 low undercut its 5/21/10 low. For two weeks in a row the tech-heavy index traded below its 200-day moving average (DMA) line, yet closed the week above that important long-term average.
|
|
|
 |
Oil Services Index Dives Near 2010 Low
Kenneth J. Gruneisen - Passed the CAN SLIM® Master's Exam
The Bank Index ($BKX -2.25%) and Broker/Dealer Index ($XBD -1.71%) had a negative bias on Friday while the majority of groups faced pressure. Weakness in the Retail Index ($RLX -1.15%) and a negative bias to trading in the tech sector pressured the Networking Index ($NWX -2.11%), Semiconductor Index ($SOX -1.63%), Internet Index ($IIX -1.05%), and Biotechnology Index ($BTK -0.55%) to close with unanimous losses. The Integrated Oil Index ($XOI -1.85%) fell and the Gold & Silver Index ($XAU -0.95%) provided no relief for defensive investors, but the Healthcare Index ($HMO +0.07%) held its ground.
Charts courtesy www.stockcharts.com
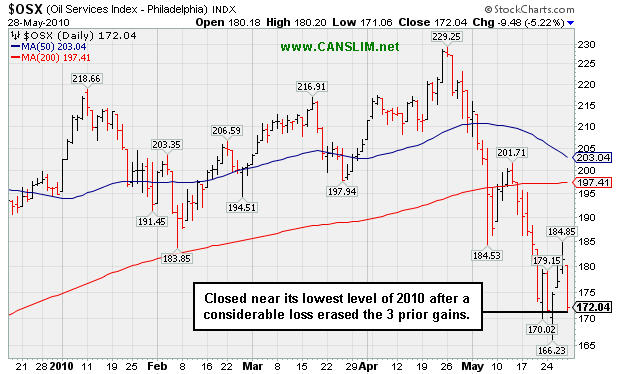
PICTURED: The Oil Services Index ($OSX -5.22%) closed near its 2010 low after a considerable loss erased the 3 prior gains.
| Oil Services |
$OSX |
172.04 |
-9.48 |
-5.22% |
-11.74% |
| Healthcare |
$HMO |
1,478.99 |
+1.08 |
+0.07% |
+0.41% |
| Integrated Oil |
$XOI |
963.48 |
-18.20 |
-1.85% |
-9.80% |
| Semiconductor |
$SOX |
355.66 |
-5.89 |
-1.63% |
-1.18% |
| Networking |
$NWX |
241.61 |
-5.20 |
-2.11% |
+4.57% |
| Internet |
$IIX |
237.23 |
-2.52 |
-1.05% |
+1.44% |
| Broker/Dealer |
$XBD |
108.63 |
-1.89 |
-1.71% |
-5.58% |
| Retail |
$RLX |
443.45 |
-5.14 |
-1.15% |
+7.86% |
| Gold & Silver |
$XAU |
173.93 |
-1.67 |
-0.95% |
+3.38% |
| Bank |
$BKX |
49.94 |
-1.15 |
-2.25% |
+16.93% |
| Biotech |
$BTK |
1,052.01 |
-5.78 |
-0.55% |
+11.66% |
|
|
|
 |
Gains Above 50 DMA Line Follow Recent Distributional Action
Kenneth J. Gruneisen - Passed the CAN SLIM® Master's Exam
Mercadolibre Inc. (MELI +$0.41 or +0.80% to $51.87) posted a 4th consecutive gain, rallying further above its 50-day moving average (DMA) line and finishing the week only -7% off its 52-week high. Its 200 DMA and recent lows define important near-term chart support. Market conditions (M criteria) remain doubtful until a follow-through day from at least one of the major averages confirms that sufficient institutional buying conviction has returned.
When it was last shown in this FSU section on 5/13/10 under the headline "Put Latin-American Internet - eCommerce Firm On Watch List an annotated graph showed its negative reversal for a loss on higher volume, an indication it was encountering distributional pressure while challenging previously stubborn resistance. The Latin American Internet - eCommerce firm was featured in yellow in the 5/13/10 mid-day report (read here) and noted as it traded within 5 cents of its 52-week high. It has found great support at its long-term 200-day moving average (DMA) line, including earlier in the year. The high-ranked leader's pivot point is based upon its 12/28/09 high plus ten cents. Top-rated funds owning an interest rose from 62 in Dec '08 to 101 in Mar '10, which is encouraging concerning the I criteria. Its strong quarterly earnings and annual earnings history satisfy the C and A criteria. Disciplined investors will watch for a proper technical buy signal. It is an ideal candidate for one's watch list while awaiting the new rally effort's confirmation in the form of a sound follow-through day of gains from at least one of the major averages on higher volume.

|
|
|
Color Codes Explained :
Y - Better candidates highlighted by our
staff of experts.
G - Previously featured
in past reports as yellow but may no longer be buyable under the
guidelines.
***Last / Change / Volume data in this table is the closing quote data***
Symbol/Exchange
Company Name
Industry Group |
PRICE |
CHANGE
(%Change) |
Day High |
Volume
(% DAV)
(% 50 day avg vol) |
52 Wk Hi
% From Hi |
Featured
Date |
Price
Featured |
Pivot Featured |
|
Max Buy |
BIDU
-
NASDAQ
Baidu Inc Ads
INTERNET - Internet Information Providers
|
$73.21
|
-0.29
-0.39% |
$74.20
|
10,410,781
61.11% of 50 DAV
50 DAV is 17,036,100
|
$82.29
-11.03%
|
1/13/2010
|
$43.13
|
PP = $42.68
|
|
MB = $44.81
|
 Most Recent Note - 5/28/2010 4:08:00 PM
G - Held its ground today after a 5/27/10 gap up. It is extended from any sound base, consolidating above its 50 DMA line. A worrisome negative reversal from its all-time high on 5/13/10 followed a 10:1 stock split.
>>> The latest Featured Stock Update with an annotated graph appeared on 5/14/2010. Click here.
View all notes |
Alert me of new notes |
CANSLIM.net Company Profile |
SEC |
Zacks Reports |
StockTalk |
News |
Chart |
Request a new note
C
A N
S L
I M


|
BRLI
-
NASDAQ
Bio Reference Labs Inc
HEALTH SERVICES - Medical Laboratories and Researc
|
$22.87
|
-0.09
-0.39% |
$23.38
|
120,014
63.77% of 50 DAV
50 DAV is 188,200
|
$24.67
-7.31%
|
2/12/2010
|
$39.02
|
PP = $20.49
|
|
MB = $21.51
|
Most Recent Note - 5/28/2010 4:10:46 PM
G - Finished the week above its 50 DMA line, quietly consolidating just -7% from its all-time high.
>>> The latest Featured Stock Update with an annotated graph appeared on 5/26/2010. Click here.
View all notes |
Alert me of new notes |
CANSLIM.net Company Profile |
SEC |
Zacks Reports |
StockTalk |
News |
Chart |
Request a new note
C
A N
S L
I M
|
CRM
-
NYSE
Salesforce.Com Inc
INTERNET - Internet Software and Services
|
$86.53
|
-0.47
-0.54% |
$87.50
|
2,353,891
114.41% of 50 DAV
50 DAV is 2,057,400
|
$89.84
-3.68%
|
3/5/2010
|
$72.28
|
PP = $75.53
|
|
MB = $79.31
|
Most Recent Note - 5/28/2010 4:12:35 PM
G - Perched -3% from its all time high. Recent gains including its positive reversal on 5/21/10 are signs of institutional support recently showing up near its 50 DMA line. For the quarter ended April 30, 2010 it showed only a +7% earnings per share increase, marking its first increase below the +25% minimum guideline in years.
>>> The latest Featured Stock Update with an annotated graph appeared on 5/17/2010. Click here.
View all notes |
Alert me of new notes |
CANSLIM.net Company Profile |
SEC |
Zacks Reports |
StockTalk |
News |
Chart |
Request a new note
C
A N
S L
I M
|
LL
-
NYSE
Lumber Liquidators Hldgs
RETAIL - Home Improvement Stores
|
$29.51
|
-0.29
-0.97% |
$29.96
|
381,556
102.49% of 50 DAV
50 DAV is 372,300
|
$33.41
-11.67%
|
4/22/2010
|
$29.87
|
PP = $29.03
|
|
MB = $30.48
|
Most Recent Note - 5/28/2010 4:14:02 PM
G - Gains with light volume this week helped it rebound above its 50 DMA line and back above its December '09 highs, yet it remains about -11% off its 52-week high and faces some resistance. It has been quietly consolidating for about 5 weeks since its "negative reversal" after hitting an all-time high on 4/26/10 was noted.
>>> The latest Featured Stock Update with an annotated graph appeared on 5/19/2010. Click here.
View all notes |
Alert me of new notes |
CANSLIM.net Company Profile |
SEC |
Zacks Reports |
StockTalk |
News |
Chart |
Request a new note
C
A N
S L
I M
|
LOPE
-
NASDAQ
Grand Canyon Education
DIVERSIFIED SERVICES - Education and; Training Services
|
$24.56
|
-0.88
-3.46% |
$25.48
|
402,388
98.31% of 50 DAV
50 DAV is 409,300
|
$28.46
-13.70%
|
4/13/2010
|
$27.71
|
PP = $27.33
|
|
MB = $28.70
|
Most Recent Note - 5/28/2010 4:17:38 PM
G - Heavy distributional pressure this week led to a close below its 50 DMA line which is now acting as a resistance level. Now -13% off its 52-week high, it has been consolidating for a 7-week period since peaking on 4/13/10. Technically, its 4/29/10 low of $23.66 is the next important chart support.
>>> The latest Featured Stock Update with an annotated graph appeared on 5/27/2010. Click here.
View all notes |
Alert me of new notes |
CANSLIM.net Company Profile |
SEC |
Zacks Reports |
StockTalk |
News |
Chart |
Request a new note
C
A N
S L
I M
|
Symbol/Exchange
Company Name
Industry Group |
PRICE |
CHANGE
(%Change) |
Day High |
Volume
(% DAV)
(% 50 day avg vol) |
52 Wk Hi
% From Hi |
Featured
Date |
Price
Featured |
Pivot Featured |
|
Max Buy |
MELI
-
NASDAQ
Mercadolibre Inc
INTERNET - Internet Software and; Services
|
$51.87
|
+0.41
0.80% |
$52.54
|
583,511
94.42% of 50 DAV
50 DAV is 618,000
|
$55.75
-6.96%
|
5/13/2010
|
$54.21
|
PP = $55.85
|
|
MB = $58.64
|
Most Recent Note - 5/28/2010 4:45:18 PM
G - Today was its 4th consecutive gain, rallying above its 50 DMA line and finishing the week only -7% off its 52-week high. Its 200 DMA and recent lows define important near-term chart support.
>>> The latest Featured Stock Update with an annotated graph appeared on 5/28/2010. Click here.
View all notes |
Alert me of new notes |
CANSLIM.net Company Profile |
SEC |
Zacks Reports |
StockTalk |
News |
Chart |
Request a new note
C
A N
S L
I M
|
ROVI
-
NASDAQ
Rovi Corp
COMPUTER SOFTWARE andamp; SERVICES - Security Software andamp; Services
|
$37.34
|
-0.40
-1.06% |
$37.73
|
963,088
79.36% of 50 DAV
50 DAV is 1,213,500
|
$40.06
-6.79%
|
4/20/2010
|
$37.62
|
PP = $38.60
|
|
MB = $40.53
|
Most Recent Note - 5/28/2010 4:49:46 PM
G - Consolidating just -7% from its 52-week high after 3 down weeks with above average volume in the past 4 weeks. Hovering near its 50 DMA line which has acted as resistance. Its recent chart low (5/25/10 low $35.09) defines near-term chart support above its 200 DMA line.
>>> The latest Featured Stock Update with an annotated graph appeared on 5/24/2010. Click here.
View all notes |
Alert me of new notes |
CANSLIM.net Company Profile |
SEC |
Zacks Reports |
StockTalk |
News |
Chart |
Request a new note
C
A N
S L
I M
|
SUMR
-
NASDAQ
Summer Infant Inc
CONSUMER NON-DURABLES - Personal Products
|
$8.25
|
+0.75
10.00% |
$8.42
|
376,075
678.84% of 50 DAV
50 DAV is 55,400
|
$8.21
0.49%
|
5/4/2010
|
$6.85
|
PP = $7.09
|
|
MB = $7.44
|
Most Recent Note - 5/28/2010 5:03:48 PM
G - Considerable gain today with heavy volume, spiking to a new all-time high and getting extended from a sound base. Color code was changed to green as rallied well above the "max buy" level previously cited.
>>> The latest Featured Stock Update with an annotated graph appeared on 5/21/2010. Click here.
View all notes |
Alert me of new notes |
CANSLIM.net Company Profile |
SEC |
Zacks Reports |
StockTalk |
News |
Chart |
Request a new note
C
A N
S L
I M
|
ULTA
-
NASDAQ
Ulta Salon Cosm & Frag
SPECIALTY RETAIL - Specialty Retail, Other
|
$25.58
|
+0.99
4.03% |
$26.00
|
636,297
169.91% of 50 DAV
50 DAV is 374,500
|
$25.76
-0.70%
|
5/28/2010
|
$25.58
|
PP = $25.86
|
|
MB = $27.15
|
Most Recent Note - 5/28/2010 5:08:56 PM
Y - Considerable gain today for a new high close. Color code is changed to yellow with new pivot point cited based on its 4/26/10 high plus ten cents.
>>> The latest Featured Stock Update with an annotated graph appeared on 5/20/2010. Click here.
View all notes |
Alert me of new notes |
CANSLIM.net Company Profile |
SEC |
Zacks Reports |
StockTalk |
News |
Chart |
Request a new note
C
A N
S L
I M
|
|
|
|
THESE ARE NOT BUY RECOMMENDATIONS!
Comments contained in the body of this report are technical
opinions only. The material herein has been obtained
from sources believed to be reliable and accurate, however,
its accuracy and completeness cannot be guaranteed.
This site is not an investment advisor, hence it does
not endorse or recommend any securities or other investments.
Any recommendation contained in this report may not
be suitable for all investors and it is not to be deemed
an offer or solicitation on our part with respect to
the purchase or sale of any securities. All trademarks,
service marks and trade names appearing in this report
are the property of their respective owners, and are
likewise used for identification purposes only.
This report is a service available
only to active Paid Premium Members.
You may opt-out of receiving report notifications
at any time. Questions or comments may be submitted
by writing to Premium Membership Services 665 S.E. 10 Street, Suite 201 Deerfield Beach, FL 33441-5634 or by calling 1-800-965-8307
or 954-785-1121.
|
|
|


