You are not logged in.
This means you
CAN ONLY VIEW reports that were published prior to Monday, April 14, 2025.
You
MUST UPGRADE YOUR MEMBERSHIP if you want to see any current reports.
AFTER MARKET UPDATE - TUESDAY, MAY 27TH, 2014
Previous After Market Report Next After Market Report >>>
|
|
|
|
DOW |
+69.23 |
16,675.50 |
+0.42% |
|
Volume |
646,266,990 |
+19% |
|
Volume |
1,695,181,960 |
+18% |
|
NASDAQ |
+51.26 |
4,237.07 |
+1.22% |
|
Advancers |
2,098 |
66% |
|
Advancers |
2,010 |
73% |
|
S&P 500 |
+11.38 |
1,911.91 |
+0.60% |
|
Decliners |
953 |
30% |
|
Decliners |
681 |
25% |
|
Russell 2000 |
+16.01 |
1,142.20 |
+1.42% |
|
52 Wk Highs |
221 |
|
|
52 Wk Highs |
99 |
|
|
S&P 600 |
+8.29 |
658.32 |
+1.28% |
|
52 Wk Lows |
17 |
|
|
52 Wk Lows |
25 |
|
|
 |
Leadership Expanded as S&P 500 Hit New All-Time Highs
Kenneth J. Gruneisen - Passed the CAN SLIM® Master's Exam
On Tuesday stocks finished higher. The volume was reported higher than the prior session totals on the NYSE and on the Nasdaq exchange, hinting that institutional buying demand was on the rise. Breadth was positive as advancers led decliners by more than a 2-1 margin on the NYSE and by nearly 3-1 on the Nasdaq exchange. Leadership expanded reassuringly as there were 78 high-ranked companies from the CANSLIM.net Leaders List that made new 52-week highs and appeared on the CANSLIM.net BreakOuts Page, up from the total of 41 stocks on the prior session. New 52-week highs expanded and easily outnumbered new 52-week lows on the NYSE and on the Nasdaq exchange. There were gains for 7 of the 9 high-ranked companies currently included on the Featured Stocks Page. Technically, the S&P 500 Index's surge into new high territory coupled with an expansion in leadership (new 52-week highs) argues that the market direction (M criteria) is in a "confirmed uptrend". Any new buying efforts should be selective and focused in stocks meeting all key criteria of the fact-based investment system.
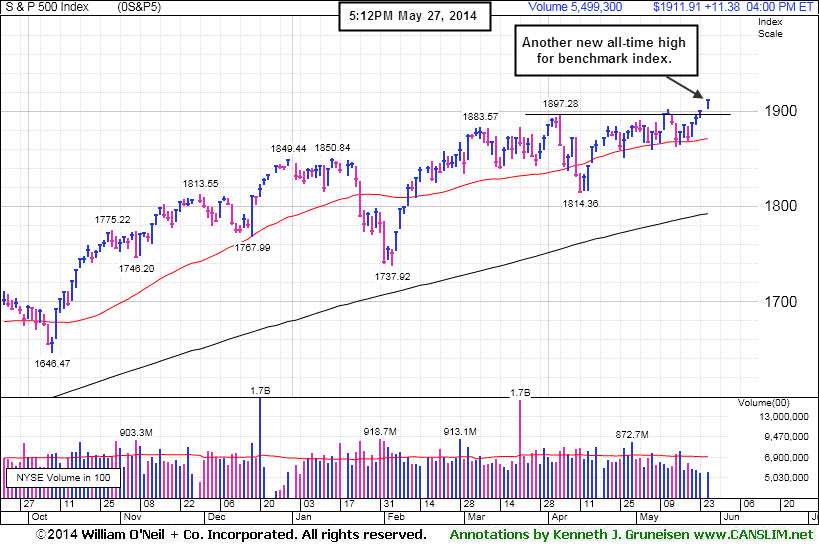
The Dow increased 69 points to 16,675. The S&P 500 advanced 11 points to a new record high of 1,911. The NASDAQ gained 51 points to 4,237.
The major averages rose thanks to a large batch of encouraging economic data. Durable goods orders topped analyst expectations with a gain of +0.8% in April while the S&P/Case-Shiller home price index unexpectedly increased +12.37% year-over-year in March. Separate reports showed consumer confidence advanced to the second-highest reading since 2008 and Markit's gauge on business activity jumped to more than a two-year high. M&A activity also helped lift the market. Hillshire Brands (HSH +22.2%) after Pilgrim Pride (PPC +1.67%) offered to buy the company for $6.5 billion.
Overall, eight of the 10 S&P 500 sectors gained ground. Financials and technology paced the advance as Bank of America (BAC +3.40%) and Index-heavyweight Apple (AAPL +1.87%) rose. The more defensive telecommunications sector retreated as AT&T (T -0.31%) edged lower. Materials also lagged behind as a drop in the price of gold pressured mining companies including Newmont Mining (NEM -3.08%).
Treasury prices rose and a government auction of two-year notes received better-than-average demand. The 10-year note increased 5/32 to yield 2.51%. The 30-year bond gained 19/32 yield 3.36%.
Keep in mind that any sustained and meaningful market advance requires leadership - a healthy crop of stocks hitting new 52-week highs. The CANSLIM.net Featured Stocks Page shows the most action-worthy candidates and their latest notes and a Headline Link directs members to the latest detailed analysis with data-packed graphs annotated by a Certified expert along with links to additional resources. The Premium Member Homepage includes "dynamic archives" to all prior pay reports published. Watch for an announcement via email concerning the next WEBCAST.
PICTURED: The S&P 500 Index hit another new all-time high as it posted a 4th consecutive gain. Subsequent deterioration below its 50-day moving average (DMA) line would raise concerns and prompt investors to aim toward reducing exposure in equities.
|
 Kenneth J. Gruneisen started out as a licensed stockbroker in August 1987, a couple of months prior to the historic stock market crash that took the Dow Jones Industrial Average down -22.6% in a single day. He has published daily fact-based fundamental and technical analysis on high-ranked stocks online for two decades. Through FACTBASEDINVESTING.COM, Kenneth provides educational articles, news, market commentary, and other information regarding proven investment systems that work in good times and bad.
Comments contained in the body of this report are technical opinions only and are not necessarily those of Gruneisen Growth Corp. The material herein has been obtained from sources believed to be reliable and accurate, however, its accuracy and completeness cannot be guaranteed. Our firm, employees, and customers may effect transactions, including transactions contrary to any recommendation herein, or have positions in the securities mentioned herein or options with respect thereto. Any recommendation contained in this report may not be suitable for all investors and it is not to be deemed an offer or solicitation on our part with respect to the purchase or sale of any securities. |
|
 |
Financial, Tech, and Retail Indexes Rose
Kenneth J. Gruneisen - Passed the CAN SLIM® Master's Exam
Financial shares helped underpin the major averages' rally on Tuesday as the Bank Index ($BKX +0.87%) and the Broker/Dealer Index ($XBD +1.04%) posted solid gains. The tech sector had a positive bias as the Semiconductor Index ($SOX +1.22%), Networking Index ($NWX +1.58%), and the Biotechnology Index ($BTK +2.02%) rose. The Retail Index ($RLX +0.56%) posted a smaller gain. Energy-related shares were mixed as the Oil Services Index ($OSX +0.70%) rose while the Integrated Oil Index ($XOI -0.22%) edged lower.
Charts courtesy www.stockcharts.com
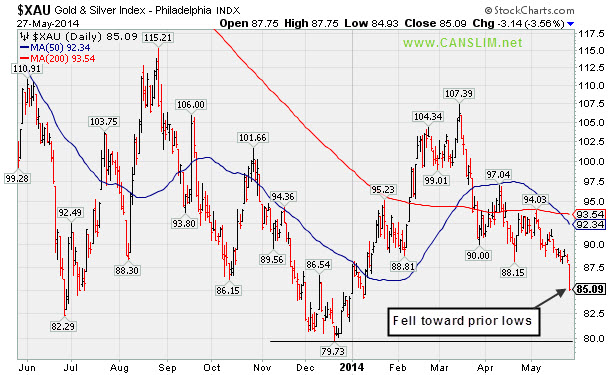
PICTURED: The Gold & Silver Index ($XAU -3.55%) tumbled hard and it was clearly a laggard while slumping toward prior lows.
| Oil Services |
$OSX |
288.91 |
+2.01 |
+0.70% |
+2.80% |
| Integrated Oil |
$XOI |
1,612.77 |
-3.48 |
-0.22% |
+7.29% |
| Semiconductor |
$SOX |
597.08 |
+7.17 |
+1.22% |
+11.60% |
| Networking |
$NWX |
338.89 |
+5.28 |
+1.58% |
+4.62% |
| Broker/Dealer |
$XBD |
154.69 |
+1.59 |
+1.04% |
-3.66% |
| Retail |
$RLX |
871.82 |
+4.86 |
+0.56% |
-7.23% |
| Gold & Silver |
$XAU |
85.09 |
-3.13 |
-3.55% |
+1.12% |
| Bank |
$BKX |
68.71 |
+0.59 |
+0.87% |
-0.79% |
| Biotech |
$BTK |
2,600.12 |
+51.60 |
+2.02% |
+11.57% |
|
|
|
 |
Earnings News May Prompt Volume and Volatility
Kenneth J. Gruneisen - Passed the CAN SLIM® Master's Exam
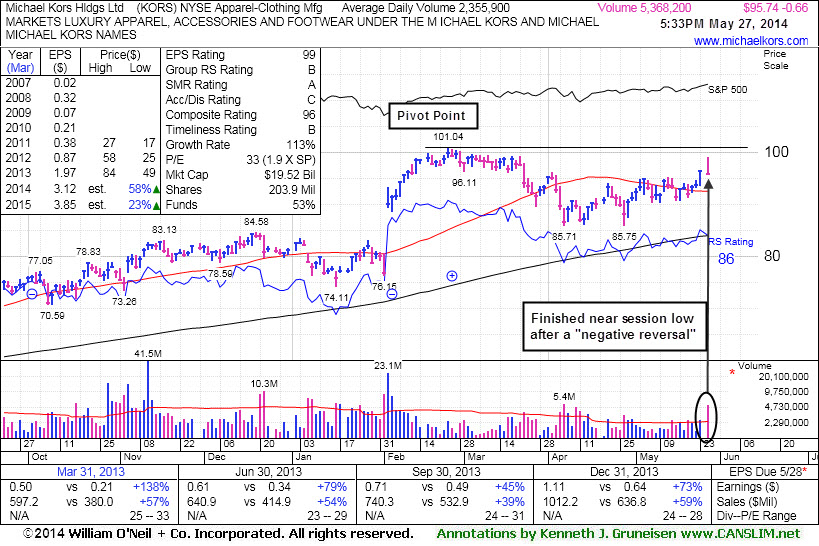
Michael Kors Hldgs Ltd (KORS -$0.66 or -0.68% to $95.74) encountered distributional pressure as it erased early gains and finished lower after a "negative reversal" on Tuesday's session. It was highlighted in yellow with new pivot point cited based on its 2/25/14 high plus 10 cents in the earlier mid-day report (read here). It is due to report earnings for the Mar '14 quarter before the market open on Wednesday. Volume and volatility often increase near earnings news. Members are reminded - "Subsequent volume-driven gains to new highs may trigger a new (or add-on) technical buy signal. Disciplined investors may watch for proof of fresh institutional buying demand and yet avoid chasing stocks more than +5% above prior highs."
KORS faces some resistance due to overhead supply up through the $101 level. A breakout above the pivot point with heavy volume is needed to trigger a new technical buy signal. Fundamentals remain favorable with respect to the fact-based investment system (C and A criteria). It found support above its 200-day moving average (DMA) line since dropped from the Featured Stocks list on 4/07/14.
KORS was last shown in this FSU section on 3/27/14 with annotated graphs under the headline, "Fell Below 50-Day Average Line With 6th Consecutive Loss",
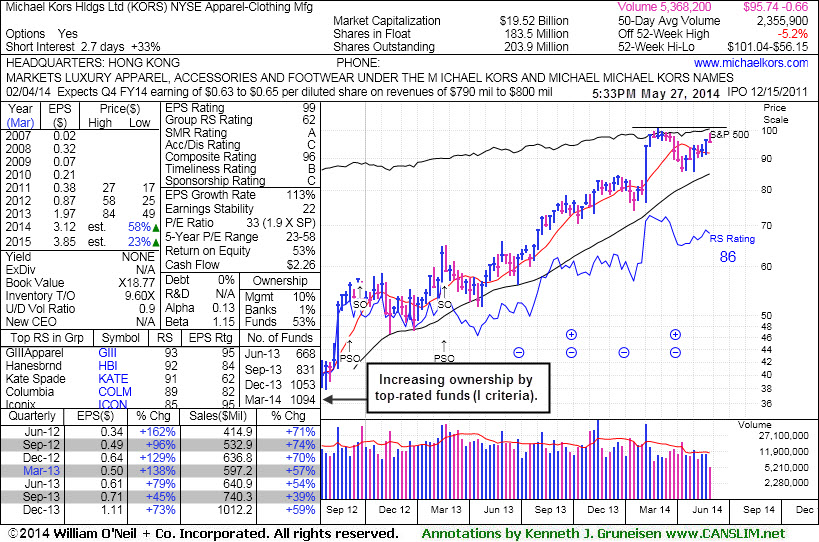
as weak action was raising concerns and its color code was changed to green. This high-ranked Apparel - Clothing Manufacturing firm has headquarters in Hong Kong. It completed Secondary Offerings on 9/25/12 and 2/20/13, each time while perched near its all-time highs. Prior reports noted - "Such offerings often are a short-term hindrance to upward price progress yet typically result in broader institutional ownership interest." The number of top-rated funds owning its shares rose from 668 in Jun '13 to 1,094 in Mar '14, a reassuring sign concerning the I criteria.
|
|
|
Color Codes Explained :
Y - Better candidates highlighted by our
staff of experts.
G - Previously featured
in past reports as yellow but may no longer be buyable under the
guidelines.
***Last / Change / Volume data in this table is the closing quote data***
Symbol/Exchange
Company Name
Industry Group |
PRICE |
CHANGE
(%Change) |
Day High |
Volume
(% DAV)
(% 50 day avg vol) |
52 Wk Hi
% From Hi |
Featured
Date |
Price
Featured |
Pivot Featured |
|
Max Buy |
AFSI
-
NASDAQ
Amtrust Financial Svcs
INSURANCE - Property and; Casualty Insurance
|
$44.90
|
-0.29
-0.64% |
$45.86
|
1,279,657
224.50% of 50 DAV
50 DAV is 570,000
|
$47.10
-4.67%
|
5/21/2014
|
$44.85
|
PP = $44.85
|
|
MB = $47.09
|
 Most Recent Note - 5/27/2014 12:12:25 PM
Y - Perched near its 52-week high today, consolidating after 5 consecutive gains. Rose from an advanced "3-weeks tight" base with volume-driven gains triggering a technical buy signal. Keep in mind 3 out of 4 stocks move in the direction of the major averages (M criteria).
>>> FEATURED STOCK ARTICLE : Finished Strong With Gain From Advanced Base Pattern - 5/21/2014
View all notes |
Set NEW NOTE alert |
CANSLIM.net Company Profile |
SEC
News |
Chart |
Request a new note
C
A N
S L
I M


|
AL
-
NYSE
Air Lease Corp Cl A
DIVERSIFIED SERVICES - Rental and Leasing Services
|
$39.39
|
+0.68
1.76% |
$39.57
|
1,412,947
196.52% of 50 DAV
50 DAV is 719,000
|
$40.36
-2.40%
|
5/9/2014
|
$38.27
|
PP = $38.25
|
|
MB = $40.16
|
Most Recent Note - 5/27/2014 5:51:04 PM
Y - Posted a gain today with nearly 2 times average volume, trading above its pivot point yet below its "max buy" level. Prior highs near $38 define near-term support to watch on pullbacks.
>>> FEATURED STOCK ARTICLE : Volume Heavy Following Gap Up Gain for New 52-Week High - 5/9/2014
View all notes |
Set NEW NOTE alert |
CANSLIM.net Company Profile |
SEC
News |
Chart |
Request a new note
C
A N
S L
I M
|
EQM
-
NYSE
E Q T Midstream Partners
ENERGY - Oil and Gas Pipelines
|
$80.03
|
+0.80
1.01% |
$80.15
|
86,807
36.94% of 50 DAV
50 DAV is 235,000
|
$80.20
-0.21%
|
12/12/2013
|
$53.17
|
PP = $56.51
|
|
MB = $59.34
|
Most Recent Note - 5/22/2014 9:21:53 PM
G - Higher again today for a new 52-week high with a gain on light volume. Completed a new Public Offering of 10.75 Million common units on 5/01/14. Fundamental concerns remain after 2 consecutive sub par quarters below the +25% minimum earnings guideline. Its 50 DMA line defines near-term support where a violation may trigger a technical sell signal.
>>> FEATURED STOCK ARTICLE : Best Ever Close With Light Volume Gain - 5/16/2014
View all notes |
Set NEW NOTE alert |
CANSLIM.net Company Profile |
SEC
News |
Chart |
Request a new note
C
A N
S L
I M
|
GRFS
-
NASDAQ
Grifols Sa Ads
Medical-Ethical Drugs
|
$41.86
|
+0.70
1.70% |
$42.51
|
405,832
65.67% of 50 DAV
50 DAV is 618,000
|
$43.50
-3.77%
|
5/15/2014
|
$41.14
|
PP = $43.55
|
|
MB = $45.73
|
Most Recent Note - 5/22/2014 9:23:39 PM
Y - Pulled back again today with lighter. Encountered resistance at prior highs. This Spanish firm from the Medical- Ethical Drugs industry needs subsequent volume-driven gains for new highs to trigger a technical buy signal.
>>> FEATURED STOCK ARTICLE : Perched Within Close Striking Distance of New Highs - 5/15/2014
View all notes |
Set NEW NOTE alert |
CANSLIM.net Company Profile |
SEC
News |
Chart |
Request a new note
C
A N
S L
I M
|
ICON
-
NASDAQ
Iconix Brand Group Inc
CONSUMER NON-DURABLES - Textile - Apparel Footwear
|
$42.78
|
+0.32
0.75% |
$43.34
|
466,794
84.41% of 50 DAV
50 DAV is 553,000
|
$43.34
-1.29%
|
4/30/2014
|
$42.50
|
PP = $42.57
|
|
MB = $44.70
|
Most Recent Note - 5/27/2014 5:56:04 PM
Y - Matched its all-time high today while posting a 4th consecutive gain backed by below average volume. Confirming gains above the pivot point with above average volume could trigger a new (or add-on) technical buy signal.
>>> FEATURED STOCK ARTICLE : Consolidating Above 50 DMA Line Still Perched Near 52-Week High - 5/20/2014
View all notes |
Set NEW NOTE alert |
CANSLIM.net Company Profile |
SEC
News |
Chart |
Request a new note
C
A N
S L
I M
|
Symbol/Exchange
Company Name
Industry Group |
PRICE |
CHANGE
(%Change) |
Day High |
Volume
(% DAV)
(% 50 day avg vol) |
52 Wk Hi
% From Hi |
Featured
Date |
Price
Featured |
Pivot Featured |
|
Max Buy |
KORS
-
NYSE
Michael Kors Hldgs Ltd
RETAIL - Apparel Stores
|
$95.74
|
-0.66
-0.68% |
$98.96
|
5,381,331
228.51% of 50 DAV
50 DAV is 2,355,000
|
$101.04
-5.25%
|
5/27/2014
|
$96.70
|
PP = $101.14
|
|
MB = $106.20
|
Most Recent Note - 5/27/2014 5:54:10 PM
Y - Erased early gains and lost ground after a "negative reversal" today following its appearance highlighted in yellow with new pivot point cited based on its 2/25/14 high plus 10 cents. Due to report earnings before the open for the Mar '14 quarter. Volume and volatility increase near earnings news. A breakout with volume is needed to trigger a new technical buy signal. Fundamentals remain favorable with respect to the fact-based investment system (C and A criteria). It found support above its 200 DMA line since dropped from the Featured Stocks list on 4/07/14. See the latest FSU analysis for more details and new annotated graphs.

>>> FEATURED STOCK ARTICLE : Earnings News May Prompt Volume and Volatility - 5/27/2014
View all notes |
Set NEW NOTE alert |
CANSLIM.net Company Profile |
SEC
News |
Chart |
Request a new note
C
A N
S L
I M
|
SN
-
NYSE
Sanchez Energy Corp
ENERGY - Independent Oil and Gas
|
$32.83
|
+1.46
4.65% |
$32.95
|
1,786,432
174.97% of 50 DAV
50 DAV is 1,021,000
|
$34.50
-4.84%
|
5/22/2014
|
$33.00
|
PP = $31.59
|
|
MB = $33.17
|
Most Recent Note - 5/27/2014 5:48:30 PM
Y - Today's gain above its pivot point backed by +75% above average volume helped clinch a technical buy signal. Disciplined investors avoid chasing stocks extended more than +5% above the pivot point and always limit losses by selling any stock that falls more than -7% from their purchase price.
>>> FEATURED STOCK ARTICLE : Finish Near Low a Sign of Distributional Pressure Following Gap Up and New High - 5/22/2014
View all notes |
Set NEW NOTE alert |
CANSLIM.net Company Profile |
SEC
News |
Chart |
Request a new note
C
A N
S L
I M
|
TRN
-
NYSE
Trinity Industries Inc
TRANSPORTATION - Railroads
|
$85.64
|
+0.60
0.71% |
$87.10
|
1,723,884
133.02% of 50 DAV
50 DAV is 1,296,000
|
$85.30
0.40%
|
4/30/2014
|
$75.57
|
PP = $76.05
|
|
MB = $79.85
|
Most Recent Note - 5/27/2014 5:59:00 PM
G - Posted a 4th consecutive gain today, getting more extended from its prior base. Traded up as much as +15.26% since first highlighted in yellow in the 4/30/14 mid-day report. Prior highs in the $75-76 area define near-term support to watch on pullbacks.
>>> FEATURED STOCK ARTICLE : Rose Beyond "Max Buy" Level With 7th Consecutive Gain - 5/12/2014
View all notes |
Set NEW NOTE alert |
CANSLIM.net Company Profile |
SEC
News |
Chart |
Request a new note
C
A N
S L
I M
|
WLK
-
NYSE
Westlake Chemical Corp
CHEMICALS - Specialty Chemicals
|
$77.02
|
+0.02
0.03% |
$78.00
|
569,208
82.61% of 50 DAV
50 DAV is 689,000
|
$77.69
-0.86%
|
4/29/2014
|
$72.79
|
PP = $69.31
|
|
MB = $72.78
|
Most Recent Note - 5/27/2014 6:01:28 PM
G - Touched a new 52-week high today after stubbornly holding its ground. Prior highs in the $69 area define near-term support to watch.
>>> FEATURED STOCK ARTICLE : Extended From Base Following Volume Driven Gains - 5/8/2014
View all notes |
Set NEW NOTE alert |
CANSLIM.net Company Profile |
SEC
News |
Chart |
Request a new note
C
A N
S L
I M
|
|
|
|
THESE ARE NOT BUY RECOMMENDATIONS!
Comments contained in the body of this report are technical
opinions only. The material herein has been obtained
from sources believed to be reliable and accurate, however,
its accuracy and completeness cannot be guaranteed.
This site is not an investment advisor, hence it does
not endorse or recommend any securities or other investments.
Any recommendation contained in this report may not
be suitable for all investors and it is not to be deemed
an offer or solicitation on our part with respect to
the purchase or sale of any securities. All trademarks,
service marks and trade names appearing in this report
are the property of their respective owners, and are
likewise used for identification purposes only.
This report is a service available
only to active Paid Premium Members.
You may opt-out of receiving report notifications
at any time. Questions or comments may be submitted
by writing to Premium Membership Services 665 S.E. 10 Street, Suite 201 Deerfield Beach, FL 33441-5634 or by calling 1-800-965-8307
or 954-785-1121.
|
|
|

