You are not logged in.
This means you
CAN ONLY VIEW reports that were published prior to Monday, April 14, 2025.
You
MUST UPGRADE YOUR MEMBERSHIP if you want to see any current reports.
AFTER MARKET UPDATE - THURSDAY, MAY 26TH, 2011
Previous After Market Report Next After Market Report >>>
|
|
|
|
DOW |
+8.10 |
12,402.76 |
+0.07% |
|
Volume |
863,187,610 |
-11% |
|
Volume |
1,850,787,860 |
+1% |
|
NASDAQ |
+21.54 |
2,782.92 |
+0.78% |
|
Advancers |
2,130 |
68% |
|
Advancers |
1,841 |
68% |
|
S&P 500 |
+5.22 |
1,325.69 |
+0.40% |
|
Decliners |
898 |
29% |
|
Decliners |
727 |
27% |
|
Russell 2000 |
+10.00 |
830.87 |
+1.22% |
|
52 Wk Highs |
77 |
|
|
52 Wk Highs |
72 |
|
|
S&P 600 |
+5.03 |
443.79 |
+1.15% |
|
52 Wk Lows |
29 |
|
|
52 Wk Lows |
53 |
|
|
 |
Small Cap Indexes Outpaced Larger Peers
Kenneth J. Gruneisen - Passed the CAN SLIM® Master's Exam
Economic reports were disappointing and yet the major averages shrugged off the news and edged higher for a second consecutive session. Thursday's volume totals were reported mixed, slightly higher than the prior session total on the Nasdaq exchange while lower on the NYSE. Advancing issues beat decliners by about 5-2 on both the NYSE and the Nasdaq. New 52-week highs outnumbered new 52-week lows on the NYSE and on the Nasdaq exchange. Leadership also improved again as there were 32 high-ranked companies from the CANSLIM.net Leaders List that made new 52-week highs and appeared on the CANSLIM.net BreakOuts Page, up from the total of 17 on the prior session and up from only 8 stocks on Tuesday. Lululemon Athletica (LULU -5.97%) was the only decliner of the 15 high-ranked leaders currently included on the Featured Stocks Page, slumping under its 50-day moving average (DMA) line after an analyst downgrade.
Initial jobless claims unexpectedly rose in the latest week, suggesting the labor market remains weak. First quarter gross domestic product growth was estimated at 1.8%, reflecting a smaller gain in consumer spending. Analysts had been looking for growth of 2.2%. Economic reports suggested the Federal Reserve may be in no hurry to raise interest rates. Initial jobless claims unexpectedly rose in the latest week, a sign that the labor market remains weak. Meanwhile, concerns about European debt lingered as the head of a group of European finance ministers said the International Monetary Fund may not release its portion of an aid payment to Greece next month.
Better-than-expected earnings boosted shares of debt management company NetApp Inc (NTAP +6.92%). Jewelry retailer Tiffany & Co (TIF +8.57%) rallied as sales recovered in Japan.
Treasuries rose, sending 10-year and 2-year yields to their lowest levels of the year. The 10-year Treasury note was up 20/32 to yield 3.06%.
The stock market has been recovering from losses early this week which caused the Nasdaq Composite Index, S&P 500 Index, and Dow Jones Industrial Average to violate their respective 50--day moving average lines. All of the above mentioned indexes remained just below their 50 DMA lines after Thursday's gains, and their respective April lows define the next important chart levels to watch. The weak technical action in the major indices has raised greater concerns. The recent slump suggested that market (M criteria) conditions have deteriorated from an "uptrend under pressure" to what may be a longer and more substantial correction. Until the nascent rally attempt produces a solid follow-through day as confirmation, disciplined investors know it is probably best to avoid new buying efforts and stay with a defensive stance. Eliminate weakening issues on a case-by-case basis, being sure to protect your hard-earned capital.
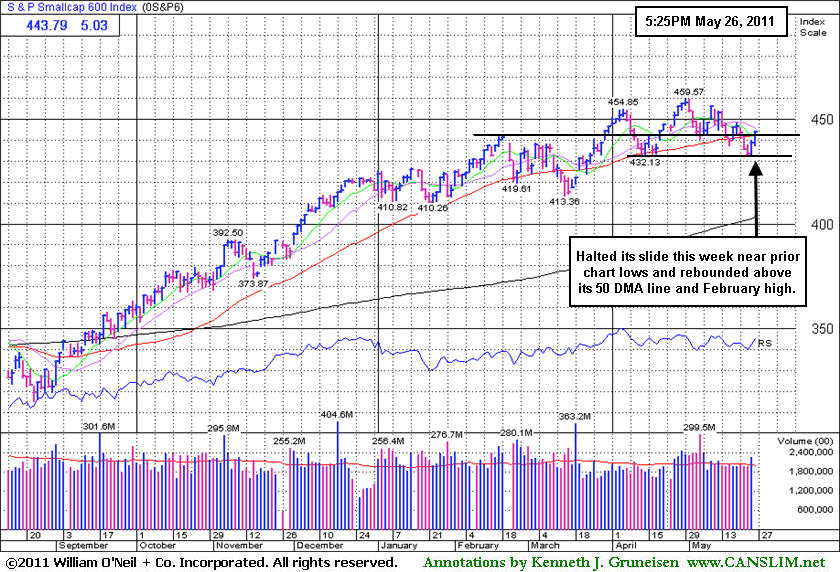
PICTURED: The S&P 600 Small-Cap Index ($SML +1.15%) outperformed its larger peers for the session. It halted its slide near its April low and has now rebounded above its 50 DMA line and above its February highs which were undercut during its latest consolidation.
|
 Kenneth J. Gruneisen started out as a licensed stockbroker in August 1987, a couple of months prior to the historic stock market crash that took the Dow Jones Industrial Average down -22.6% in a single day. He has published daily fact-based fundamental and technical analysis on high-ranked stocks online for two decades. Through FACTBASEDINVESTING.COM, Kenneth provides educational articles, news, market commentary, and other information regarding proven investment systems that work in good times and bad.
Comments contained in the body of this report are technical opinions only and are not necessarily those of Gruneisen Growth Corp. The material herein has been obtained from sources believed to be reliable and accurate, however, its accuracy and completeness cannot be guaranteed. Our firm, employees, and customers may effect transactions, including transactions contrary to any recommendation herein, or have positions in the securities mentioned herein or options with respect thereto. Any recommendation contained in this report may not be suitable for all investors and it is not to be deemed an offer or solicitation on our part with respect to the purchase or sale of any securities. |
|
 |
Financial Indexes and XAU Still Under 200-Day Moving Averages
Kenneth J. Gruneisen - Passed the CAN SLIM® Master's Exam
Small gains were posted by the Broker/Dealer Index ($XBD +0.15%) and the Bank Index ($BKX +0.35%), and the Gold & Silver Index ($XAU +0.20%) also edged higher. All three of the above mentioned indexes are currently trading under their longer-term 200-day moving average (DMA) lines. The Healthcare Index ($HMO +1.46%) and energy related indexes posted better gains as the Integrated Oil Index ($XOI +0.77%) and Oil Services Index ($OSX +0.79%) rose. The Retail Index ($RLX +0.62%) ands unanimous gains from the Biotechnology Index ($BTK +0.41%), Networking Index ($NWX +0.53%), Internet Index ($IIX +0.79%), and Semiconductor Index ($SOX +0.95%) rounded out the mostly positive session.
Charts courtesy www.stockcharts.com
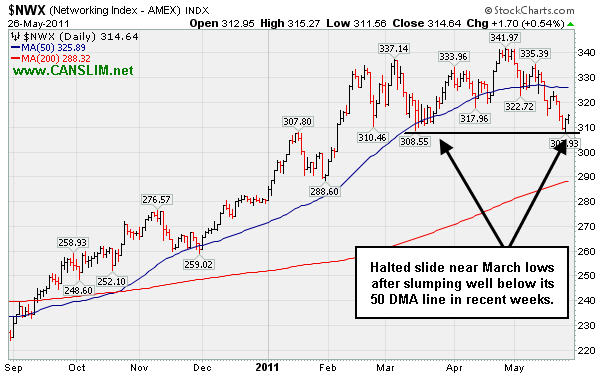
PICTURED: The Networking Index ($NWX +0.53%) halted its slide near its March lows after slumping well below its 50 DMA line in recent weeks.
| Oil Services |
$OSX |
272.02 |
+2.14 |
+0.79% |
+10.97% |
| Healthcare |
$HMO |
2,359.72 |
+34.07 |
+1.46% |
+39.46% |
| Integrated Oil |
$XOI |
1,308.24 |
+10.05 |
+0.77% |
+7.84% |
| Semiconductor |
$SOX |
428.24 |
+4.03 |
+0.95% |
+3.99% |
| Networking |
$NWX |
314.62 |
+1.67 |
+0.53% |
+12.14% |
| Internet |
$IIX |
315.34 |
+2.48 |
+0.79% |
+2.47% |
| Broker/Dealer |
$XBD |
113.13 |
+0.17 |
+0.15% |
-6.90% |
| Retail |
$RLX |
529.86 |
+3.28 |
+0.62% |
+4.23% |
| Gold & Silver |
$XAU |
205.46 |
+0.42 |
+0.20% |
-9.32% |
| Bank |
$BKX |
49.05 |
+0.17 |
+0.35% |
-6.05% |
| Biotech |
$BTK |
1,460.61 |
+5.96 |
+0.41% |
+12.56% |
|
|
|
 |
Institutional Ownership Increased During Considerable Rally
Kenneth J. Gruneisen - Passed the CAN SLIM® Master's Exam
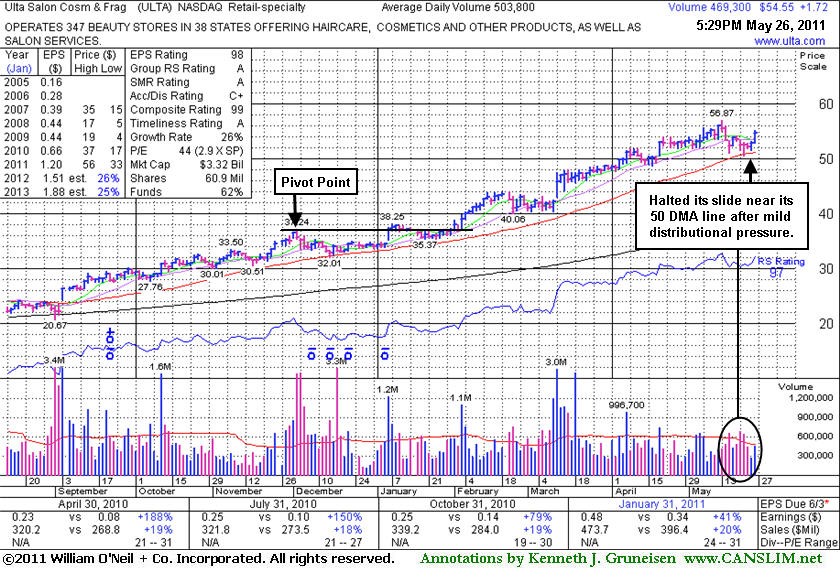
Ulta Salon Cosmetics & Fragrance, Inc. (ULTA +$1.72 or +3.26% to $54.55) rallied within close striking distance of its all-time high today after finding support above its 50-day moving average (DMA) line this week. Since its last appearance in this FSU section on 4/28/11 with analysis and an annotated graph under the headline, "Considerable Rally For Salon Services Firm", this high-ranked Retail - Specialty firm wedged up without great volume conviction to new all-time highs. It has been noted as extended from any sound base, having steadily climbed, hardly pausing for any sufficient new base to form since its breakout early this year cleared the last pivot point cited.
On pullbacks, its 50-day moving average (DMA) line has defined chart support throughout its ongoing advance. A damaging violation may trigger a technical sell signal. Since first featured in yellow in the 3/12/10 mid-day report at $22.81 and (read here) and in a more detailed Stock Bulletin later that afternoon under the headline "Strong Earnings Increases Help Leader Meet Key Criteria", in just over 13 months it has traded up as much as +149.3%. The number of top-rated funds with an ownership interest has grown from 274 funds in Mar '10 to 460 funds as of Mar '11 which is an encouraging sign of increasing institutional interest (the I criteria). Management's 25% ownership stake (after the latest offering) still keeps the company's directors very motivated to look after and build shareholder value. Its strong quarterly earnings increases above the +25% guideline in the 7 latest comparisons (satisfies the C criteria).
|
|
|
Color Codes Explained :
Y - Better candidates highlighted by our
staff of experts.
G - Previously featured
in past reports as yellow but may no longer be buyable under the
guidelines.
***Last / Change / Volume data in this table is the closing quote data***
Symbol/Exchange
Company Name
Industry Group |
PRICE |
CHANGE
(%Change) |
Day High |
Volume
(% DAV)
(% 50 day avg vol) |
52 Wk Hi
% From Hi |
Featured
Date |
Price
Featured |
Pivot Featured |
|
Max Buy |
CEVA
-
NASDAQ
Ceva Inc
ELECTRONICS - Semiconductor - Specialized
|
$33.35
|
+0.34
1.03% |
$33.85
|
250,216
121.82% of 50 DAV
50 DAV is 205,400
|
$33.10
0.76%
|
5/25/2011
|
$32.98
|
PP = $32.05
|
|
MB = $33.65
|
Most Recent Note - 5/25/2011 12:15:15 PM
Y - Hit a new 52-week high today with above average volume while rising clear of all resistance due to overhead supply. Its strong +92% earnings increase on +42% sales revenues for the March 31, 2011 ended quarter shows more impressive acceleration. Color code is changed to yellow with a pivot point of $32.05 based on a short "square box" type base pattern. Found support above its 50 DMA line when recently testing support near prior chart highs. It has a good annual earnings (A criteria) history. The M criteria is an overriding concern arguing against new buying efforts until a follow-through day from at least one of the major averages confirms a new rally.
>>> The latest Featured Stock Update with an annotated graph appeared on 5/25/2011. Click here.
View all notes |
Alert me of new notes |
CANSLIM.net Company Profile |
SEC |
Zacks Reports |
StockTalk |
News |
Chart |
Request a new note
C
A N
S L
I M


|
CMG
-
NYSE
Chipotle Mexican Grill
LEISURE - Restaurants
|
$290.88
|
+6.77
2.38% |
$291.21
|
1,035,243
93.07% of 50 DAV
50 DAV is 1,112,300
|
$289.35
0.53%
|
4/1/2011
|
$274.00
|
PP = $275.10
|
|
MB = $288.86
|
 Most Recent Note - 5/26/2011 3:19:38 PM
G - Inching higher today with very quiet volume while reaching a new all-time high, and no resistance remains due to overhead supply. Formed a 5-week base with volume totals cooling in recent weeks while finding support near its 50 DMA line. Its sub par earnings increase of +23% in the latest quarter ended March 31st, 2011 versus the year ago period raised concern while marking its weakest quarterly earnings increase in more than 2 years.
>>> The latest Featured Stock Update with an annotated graph appeared on 5/17/2011. Click here.
View all notes |
Alert me of new notes |
CANSLIM.net Company Profile |
SEC |
Zacks Reports |
StockTalk |
News |
Chart |
Request a new note
C
A N
S L
I M
|
EZPW
-
NASDAQ
Ezcorp Inc Cl A
SPECIALTY RETAIL - Specialty Retail, Other
|
$31.06
|
+0.47
1.54% |
$31.10
|
259,125
74.74% of 50 DAV
50 DAV is 346,700
|
$33.08
-6.11%
|
2/18/2011
|
$27.94
|
PP = $30.04
|
|
MB = $31.54
|
Most Recent Note - 5/23/2011 4:16:24 PM
G - Small loss on light volume after gapping down today. Continuing its healthy consolidation above its 50 DMA line. It has not formed a sound new base pattern. Recent lows define important nearby chart support to watch where technical violations would raise more serious concerns.
>>> The latest Featured Stock Update with an annotated graph appeared on 5/10/2011. Click here.
View all notes |
Alert me of new notes |
CANSLIM.net Company Profile |
SEC |
Zacks Reports |
StockTalk |
News |
Chart |
Request a new note
C
A N
S L
I M
|
FOSL
-
NASDAQ
Fossil Inc
CONSUMER DURABLES - Recreational Goods, Other
|
$105.15
|
+2.89
2.83% |
$105.33
|
662,761
80.25% of 50 DAV
50 DAV is 825,900
|
$107.54
-2.22%
|
2/1/2011
|
$73.30
|
PP = $74.44
|
|
MB = $78.16
|
Most Recent Note - 5/26/2011 2:52:20 PM
G - Volume totals have been cooling while consolidating in a tight range since its considerable gap up gain on 5/10/11 for a new all-time high. It is extended from any sound base. Prior highs near $96 define initial support to watch above its 50 DMA line.
>>> The latest Featured Stock Update with an annotated graph appeared on 5/2/2011. Click here.
View all notes |
Alert me of new notes |
CANSLIM.net Company Profile |
SEC |
Zacks Reports |
StockTalk |
News |
Chart |
Request a new note
C
A N
S L
I M
|
HMSY
-
NASDAQ
H M S Holdings Corp
COMPUTER SOFTWARE and SERVICES - Healthcare Information Service
|
$77.33
|
+0.00
0.00% |
$77.43
|
67,543
40.66% of 50 DAV
50 DAV is 166,100
|
$84.82
-8.83%
|
11/19/2010
|
$61.89
|
PP = $63.01
|
|
MB = $66.16
|
Most Recent Note - 5/23/2011 4:20:53 PM
G - Small gap down today on near average volume. Its has lingered for the past 3 weeks below its 50 DMA line which may now act as resistance. A rally above it would improve its technical stance. Deterioration below its recent chart low ($73.27) would raise more serious concerns and trigger an additional sell signal.
>>> The latest Featured Stock Update with an annotated graph appeared on 5/23/2011. Click here.
View all notes |
Alert me of new notes |
CANSLIM.net Company Profile |
SEC |
Zacks Reports |
StockTalk |
News |
Chart |
Request a new note
C
A N
S L
I M
|
Symbol/Exchange
Company Name
Industry Group |
PRICE |
CHANGE
(%Change) |
Day High |
Volume
(% DAV)
(% 50 day avg vol) |
52 Wk Hi
% From Hi |
Featured
Date |
Price
Featured |
Pivot Featured |
|
Max Buy |
HS
-
NYSE
Healthspring Inc
HEALTH SERVICES - Health Care Plans
|
$42.47
|
+0.70
1.68% |
$42.59
|
601,203
61.81% of 50 DAV
50 DAV is 972,700
|
$45.11
-5.85%
|
3/22/2011
|
$38.29
|
PP = $38.85
|
|
MB = $40.79
|
Most Recent Note - 5/24/2011 4:47:03 PM
G - Down on light volume today for a third consecutive loss, slumping toward prior highs closely coinciding with its 50 DMA line which define important chart support to watch. Violations would trigger technical sell signals.
>>> The latest Featured Stock Update with an annotated graph appeared on 5/20/2011. Click here.
View all notes |
Alert me of new notes |
CANSLIM.net Company Profile |
SEC |
Zacks Reports |
StockTalk |
News |
Chart |
Request a new note
C
A N
S L
I M
|
INFA
-
NASDAQ
Informatica Corp
COMPUTER SOFTWARE and SERVICES - Business Software and Services
|
$56.27
|
+1.51
2.76% |
$56.47
|
1,211,148
113.05% of 50 DAV
50 DAV is 1,071,300
|
$56.49
-0.39%
|
3/24/2011
|
$50.04
|
PP = $49.86
|
|
MB = $52.35
|
Most Recent Note - 5/26/2011 1:02:58 PM
G - Quietly wedging up near its 52-week high today, this high-ranked Computer Software - Database firm has not formed a sound new base pattern. Prior highs in the $49 area and its 50 DMA line define near-term support to watch. Subsequent violations would trigger technical sell signals.
>>> The latest Featured Stock Update with an annotated graph appeared on 5/24/2011. Click here.
View all notes |
Alert me of new notes |
CANSLIM.net Company Profile |
SEC |
Zacks Reports |
StockTalk |
News |
Chart |
Request a new note
C
A N
S L
I M
|
LULU
-
NASDAQ
Lululemon Athletica
MANUFACTURING - Textile Manufacturing
|
$91.75
|
-5.83
-5.97% |
$96.40
|
3,730,862
178.81% of 50 DAV
50 DAV is 2,086,500
|
$102.83
-10.77%
|
5/18/2011
|
$98.15
|
PP = $102.93
|
|
MB = $108.08
|
Most Recent Note - 5/26/2011 4:36:21 PM
G- Gapped down today following an analyst downgrade and later violated its 50 DMA line with a damaging loss on above average volume. Slumping near recent chart lows, raising concerns, this high-ranked Retail-Apparel firm's color code is changed to green. It failed to confirm a recent buy signal since a new pivot point was recently cited.
>>> The latest Featured Stock Update with an annotated graph appeared on 5/3/2011. Click here.
View all notes |
Alert me of new notes |
CANSLIM.net Company Profile |
SEC |
Zacks Reports |
StockTalk |
News |
Chart |
Request a new note
C
A N
S L
I M
|
MG
-
NYSE
Mistras Group Inc
DIVERSIFIED SERVICES - Bulding and Faci;ity Management Services
|
$16.94
|
+0.46
2.79% |
$17.03
|
47,287
26.31% of 50 DAV
50 DAV is 179,700
|
$18.46
-8.23%
|
3/15/2011
|
$15.48
|
PP = $15.90
|
|
MB = $16.70
|
Most Recent Note - 5/26/2011 2:55:07 PM
G - Today's gain on light volume has it approaching its 50 DMA line. Gains above that short-term average would help its outlook, technically, meanwhile the recent low ($15.44 on 5/05/11) defines the next chart support. Completed a new Public Offering on 5/05/11.
>>> The latest Featured Stock Update with an annotated graph appeared on 5/12/2011. Click here.
View all notes |
Alert me of new notes |
CANSLIM.net Company Profile |
SEC |
Zacks Reports |
StockTalk |
News |
Chart |
Request a new note
C
A N
S L
I M
|
MWIV
-
NASDAQ
M W I Veterinary Supply
HEALTH SERVICES - Medical Instruments and; Supplies
|
$82.36
|
+0.93
1.14% |
$82.38
|
29,331
33.33% of 50 DAV
50 DAV is 88,000
|
$86.99
-5.32%
|
11/4/2010
|
$61.79
|
PP = $59.60
|
|
MB = $62.58
|
Most Recent Note - 5/26/2011 2:57:20 PM
G - Hovering in a tight trading range just above its 50 DMA and near its all-time high with volume totals still cooling since 5/05/11. Stubbornly holding its ground, but it has not formed a sound base pattern. Its 50 DMA line defines important support to watch.
>>> The latest Featured Stock Update with an annotated graph appeared on 5/5/2011. Click here.
View all notes |
Alert me of new notes |
CANSLIM.net Company Profile |
SEC |
Zacks Reports |
StockTalk |
News |
Chart |
Request a new note
C
A N
S L
I M
|
Symbol/Exchange
Company Name
Industry Group |
PRICE |
CHANGE
(%Change) |
Day High |
Volume
(% DAV)
(% 50 day avg vol) |
52 Wk Hi
% From Hi |
Featured
Date |
Price
Featured |
Pivot Featured |
|
Max Buy |
OPNT
-
NASDAQ
Opnet Technologies
INTERNET - Internet Software and Services
|
$39.28
|
+1.34
3.53% |
$39.39
|
126,492
99.37% of 50 DAV
50 DAV is 127,300
|
$42.51
-7.60%
|
5/11/2011
|
$41.21
|
PP = $40.50
|
|
MB = $42.53
|
Most Recent Note - 5/26/2011 3:09:44 PM
G - Up today with higher volume (but still below average) while repairing its brief 50 DMA line breach helps its outlook, technically. Its color code was changed to green after it completely negated its latest breakout, yet it now faces very little resistance due to overhead supply.
>>> The latest Featured Stock Update with an annotated graph appeared on 5/11/2011. Click here.
View all notes |
Alert me of new notes |
CANSLIM.net Company Profile |
SEC |
Zacks Reports |
StockTalk |
News |
Chart |
Request a new note
C
A N
S L
I M
|
PCLN
-
NASDAQ
Priceline.Com Inc
INTERNET - Internet Software and Services
|
$505.11
|
+6.30
1.26% |
$507.45
|
809,241
71.58% of 50 DAV
50 DAV is 1,130,500
|
$561.88
-10.10%
|
1/3/2011
|
$399.55
|
PP = $428.20
|
|
MB = $449.61
|
Most Recent Note - 5/23/2011 3:55:20 PM
G - Gapped down today, violating its 50 DMA line again with a loss on higher volume indicative of more distributional pressure. Recent chart low ($493.67 on 5/17/11) defines an important near-term support level where further deterioration would raise even greater concerns.
>>> The latest Featured Stock Update with an annotated graph appeared on 5/19/2011. Click here.
View all notes |
Alert me of new notes |
CANSLIM.net Company Profile |
SEC |
Zacks Reports |
StockTalk |
News |
Chart |
Request a new note
C
A N
S L
I M
|
RAX
-
NYSE
Rackspace Hosting Inc
INTERNET - Internet Software and; Services
|
$42.66
|
+1.26
3.04% |
$42.82
|
1,090,214
61.40% of 50 DAV
50 DAV is 1,775,500
|
$46.50
-8.25%
|
3/16/2011
|
$36.28
|
PP = $40.72
|
|
MB = $42.76
|
Most Recent Note - 5/26/2011 3:01:42 PM
G - Up today with very light volume, struggling to stay above its 50 DMA line. It has not formed a sound new base pattern but may eventually form a new "late-stage" base. Meanwhile, deterioration below its recent chart low ($38.84 on 5/12/11) would trigger more worrisome technical sell signals.
>>> The latest Featured Stock Update with an annotated graph appeared on 5/13/2011. Click here.
View all notes |
Alert me of new notes |
CANSLIM.net Company Profile |
SEC |
Zacks Reports |
StockTalk |
News |
Chart |
Request a new note
C
A N
S L
I M
|
TIBX
-
NASDAQ
Tibco Software Inc
COMPUTER SOFTWARE and SERVICES - Business Software and Services
|
$28.70
|
+0.52
1.85% |
$28.76
|
1,655,956
62.28% of 50 DAV
50 DAV is 2,658,900
|
$30.75
-6.67%
|
3/18/2011
|
$23.88
|
PP = $26.04
|
|
MB = $27.34
|
Most Recent Note - 5/26/2011 3:05:24 PM
G - Up today with light volume, positively reversing after starting the session with a small gap down just below its 50 DMA line and dipping near the recent low ($27.17). More damaging violations may trigger technical sell signals.
>>> The latest Featured Stock Update with an annotated graph appeared on 5/18/2011. Click here.
View all notes |
Alert me of new notes |
CANSLIM.net Company Profile |
SEC |
Zacks Reports |
StockTalk |
News |
Chart |
Request a new note
C
A N
S L
I M
|
ULTA
-
NASDAQ
Ulta Salon Cosm & Frag
SPECIALTY RETAIL - Specialty Retail, Other
|
$54.55
|
+1.72
3.26% |
$55.17
|
469,302
90.30% of 50 DAV
50 DAV is 519,700
|
$56.87
-4.08%
|
1/6/2011
|
$36.12
|
PP = $37.34
|
|
MB = $39.21
|
Most Recent Note - 5/26/2011 2:49:14 PM
G - Rallying within close striking distance of its all-time high today after finding support above its 50 DMA line this week. It is extended from any sound base pattern.
>>> The latest Featured Stock Update with an annotated graph appeared on 5/26/2011. Click here.
View all notes |
Alert me of new notes |
CANSLIM.net Company Profile |
SEC |
Zacks Reports |
StockTalk |
News |
Chart |
Request a new note
C
A N
S L
I M
|
Symbol/Exchange
Company Name
Industry Group |
PRICE |
CHANGE
(%Change) |
Day High |
Volume
(% DAV)
(% 50 day avg vol) |
52 Wk Hi
% From Hi |
Featured
Date |
Price
Featured |
Pivot Featured |
|
Max Buy |
|
|
|
THESE ARE NOT BUY RECOMMENDATIONS!
Comments contained in the body of this report are technical
opinions only. The material herein has been obtained
from sources believed to be reliable and accurate, however,
its accuracy and completeness cannot be guaranteed.
This site is not an investment advisor, hence it does
not endorse or recommend any securities or other investments.
Any recommendation contained in this report may not
be suitable for all investors and it is not to be deemed
an offer or solicitation on our part with respect to
the purchase or sale of any securities. All trademarks,
service marks and trade names appearing in this report
are the property of their respective owners, and are
likewise used for identification purposes only.
This report is a service available
only to active Paid Premium Members.
You may opt-out of receiving report notifications
at any time. Questions or comments may be submitted
by writing to Premium Membership Services 665 S.E. 10 Street, Suite 201 Deerfield Beach, FL 33441-5634 or by calling 1-800-965-8307
or 954-785-1121.
|
|
|

