You are not logged in.
This means you
CAN ONLY VIEW reports that were published prior to Monday, April 14, 2025.
You
MUST UPGRADE YOUR MEMBERSHIP if you want to see any current reports.
AFTER MARKET UPDATE - TUESDAY, MAY 25TH, 2010
Previous After Market Report Next After Market Report >>>
|
|
|
|
DOW |
-22.82 |
10,043.75 |
-0.23% |
|
Volume |
1,884,996,190 |
+44% |
|
Volume |
2,825,988,530 |
+40% |
|
NASDAQ |
-2.60 |
2,210.95 |
-0.12% |
|
Advancers |
1,135 |
36% |
|
Advancers |
902 |
32% |
|
S&P 500 |
+0.38 |
1,074.03 |
+0.04% |
|
Decliners |
1,976 |
62% |
|
Decliners |
1,819 |
64% |
|
Russell 2000 |
-1.19 |
640.02 |
-0.19% |
|
52 Wk Highs |
18 |
|
|
52 Wk Highs |
9 |
|
|
S&P 600 |
-1.52 |
343.40 |
-0.44% |
|
52 Wk Lows |
126 |
|
|
52 Wk Lows |
182 |
|
|
 |
Stocks Recover After Dow and S&P 500 Hit New 2010 Lows
Adam Sarhan, Contributing Writer,
The major averages closed mixed after geopolitical tensions esclated between North and South Korea. Volume was heavier compared to Monday's volume reported on both major exchanges while decliners led advancers by a 2-to-1 ratio on the Nasdaq exchange and nearly a 2-to-1 ratio on the NYSE. Leadership dried up on Tuesday as there were no high-ranked companies from the CANSLIM.net Leaders List that made a new 52-week high and appeared on the CANSLIM.net BreakOuts Page, lower than the 4 issues that appeared on Monday. It is difficult for the market to mount a sustained rally without a healthy crop of strong leaders. New 52-week lows trumped new 52-week highs on the Nasdaq exchange and on the NYSE.
Overnight, stocks plunged in Asia and Europe after bank borrowing costs jumped and North Korea said it will sever ties with South Korea as tensions continue to mount. On Monday, the US announced plans to conduct anti-submarine exercises with South Korea after the March 26 torpedoing of a South Korean warship. The US dollar rallied on the news which sent the a slew of dollar denominated assets lower on the news (i.e. stocks and commodities).
In the US, Representative Barney Frank, who will lead congressional talks on the much anticipated financial-regulation bill, said Senate language that would require commercial banks to prevent swap-trading "goes too far." This helped a slew of financial stocks rally back from new 2010 lows. Goldman Sachs (GS +4.29%), Morgan Stanley (MS +1.40%), and Bank of America (BAC +0.58%) had opened lower and managed "positive reversals" to collectively close higher after hitting fresh 2010 lows.
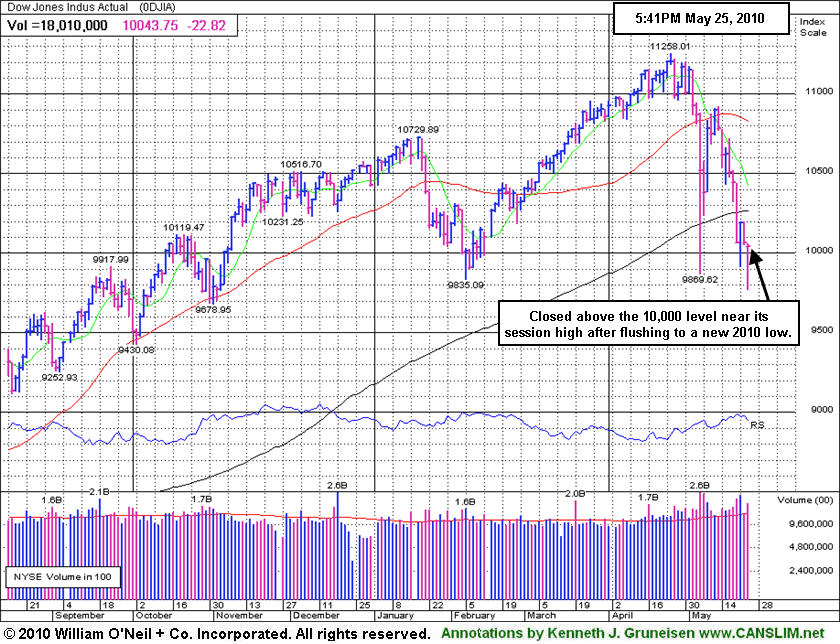
All the major averages sliced below Friday's lows which effectively ended the current rally attempt and reset the base count. However, the S&P 500 Index managed to close higher for the day which technically marks Day 1 of a new rally attempt for that index. In addition, the earliest a proper follow-through day (FTD) could occur would be Friday, providing Tuesday's lows are not breached. However, if at anytime, Tuesday's lows are breached, then the day count will be reset. What does all of this mean for investors? Simple, the market remains in a correction which reiterates the importance of adopting a strong defense stance until a new rally is confirmed. Trade accordingly.
Professional Money Management Services - Free Portfolio Review:
If your portfolio is greater than $100,000 and you would like a free portfolio review, click here to get connected with one of our portfolio managers. ** Serious inquires only, please.
PICTURED: The Dow Jones Industrial average closed above the 10,000 level near its session high on Tuesday. Early weakness briefly led to new 2010 lows for the blue chip index as well as the benchmark S&P 500 Index.
|
|
|
 |
XAU Rebounds Above 200-Day Moving Average
Kenneth J. Gruneisen - Passed the CAN SLIM® Master's Exam
A gain from the Retail Index ($RLX +1.38%) and the influential financial groups' gains from both the Bank Index ($BKX +1.03%) and Broker/Dealer Index ($XBD +0.45%) were offset by weakness in other areas which prevented the major averages from making headway. The Oil Services Index ($OSX +1.70%) tallied a solid gain while the Integrated Oil Index ($XOI +0.04%) ended flat. The Semiconductor Index ($SOX +0.58%) and Networking Index ($NWX +0.71%) posted modest gains, meanwhile the Internet Index ($IIX -0.07%) and Biotechnology Index ($BTK -0.05%) edged lower. The Healthcare Index ($HMO -0.94%) was also a laggard group.
Charts courtesy www.stockcharts.com
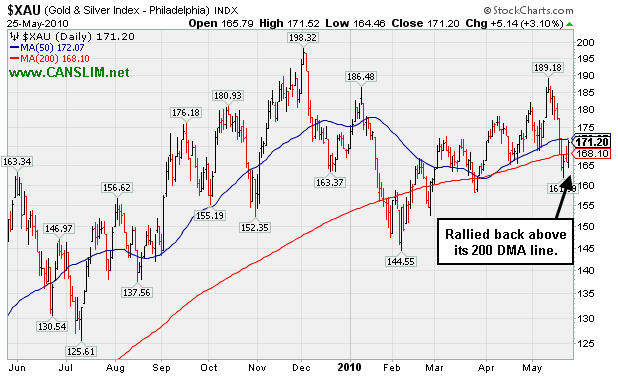
PICTURED: The Gold & Silver Index ($XAU +3.10%) was a standout among the groups posting gains Tuesday as it rallied back above its 200-day moving average (DMA) line.
| Oil Services |
$OSX |
174.53 |
+2.92 |
+1.70% |
-10.46% |
| Healthcare |
$HMO |
1,418.52 |
-13.45 |
-0.94% |
-3.69% |
| Integrated Oil |
$XOI |
940.83 |
+0.34 |
+0.04% |
-11.92% |
| Semiconductor |
$SOX |
344.51 |
+1.97 |
+0.58% |
-4.28% |
| Networking |
$NWX |
238.50 |
+1.69 |
+0.71% |
+3.22% |
| Internet |
$IIX |
232.41 |
-0.17 |
-0.07% |
-0.62% |
| Broker/Dealer |
$XBD |
106.18 |
+0.47 |
+0.45% |
-7.71% |
| Retail |
$RLX |
440.60 |
+5.99 |
+1.38% |
+7.17% |
| Gold & Silver |
$XAU |
171.20 |
+5.14 |
+3.10% |
+1.75% |
| Bank |
$BKX |
49.23 |
+0.50 |
+1.03% |
+15.27% |
| Biotech |
$BTK |
1,038.80 |
-0.53 |
-0.05% |
+10.26% |
|
|
|
 |
Damaging Losses Hurting Technical Outlook
Kenneth J. Gruneisen - Passed the CAN SLIM® Master's Exam
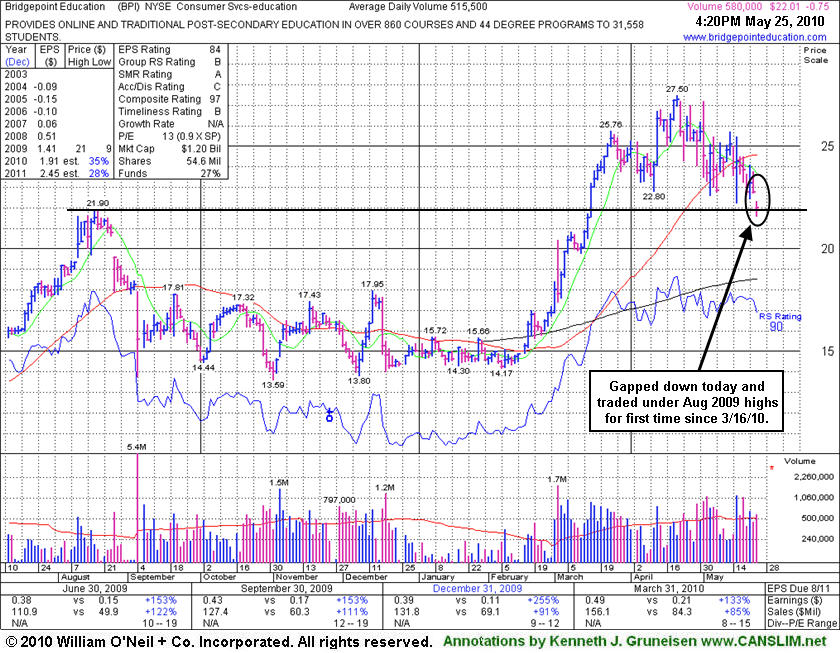
Bridgepoint Education (BPI -$0.64 or -2.81% to $22.12) gapped down today, diving below recent lows previously mentioned as "a very important support level to watch" and trading below its Aug 2009 highs for the first time sine 3/16/10. When it was last shown in this Featured Stock Update section on 5/07/10 under the headline "Leadership In Group Waning Under Threat Of Regulations" we observed that - "prompt sign of support near its 50 DMA line would be encouraging, while any further deterioration leading to a slump below its August 2009 highs would raise more serious concerns."
BPI would need to rally back above its 50-day moving average (DMA) line for its outlook to improve. Based on weakness it will be dropped from the Featured Stocks list tonight. Leadership in the Commercial Services - Schools group recently waned as many for-profit schools have encountered distributional pressure in the wake of proposed regulatory changes. Broader market action (M criteria) is normally expected to impact 3 out of 4 stocks, and widespread losses effectively ended the latest rally. BPI was featured in yellow in the 4/13/10 mid-day report (read here) as rose from a cup-with-high-handle hit a new 52 week high after a brief consolidation above its old chart high ($21.90). It has an impressive history of very strong annual and quarterly increases in sales revenues and earnings above the +25% guideline which is good concerning the C & A criteria.
|
|
|
Color Codes Explained :
Y - Better candidates highlighted by our
staff of experts.
G - Previously featured
in past reports as yellow but may no longer be buyable under the
guidelines.
***Last / Change / Volume data in this table is the closing quote data***
Symbol/Exchange
Company Name
Industry Group |
PRICE |
CHANGE
(%Change) |
Day High |
Volume
(% DAV)
(% 50 day avg vol) |
52 Wk Hi
% From Hi |
Featured
Date |
Price
Featured |
Pivot Featured |
|
Max Buy |
BIDU
-
NASDAQ
Baidu Inc Ads
INTERNET - Internet Information Providers
|
$69.08
|
-1.93
-2.71% |
$69.46
|
15,862,187
88.93% of 50 DAV
50 DAV is 17,837,300
|
$82.29
-16.05%
|
1/13/2010
|
$43.13
|
PP = $42.68
|
|
MB = $44.81
|
 Most Recent Note - 5/25/2010 12:49:58 PM
G - Gapped down today, falling toward its 50 DMA line. A worrisome negative reversal from its all-time high on 5/13/10 followed a 10:1 stock split. It is extended from any sound base.
>>> The latest Featured Stock Update with an annotated graph appeared on 5/14/2010. Click here.
View all notes |
Alert me of new notes |
CANSLIM.net Company Profile |
SEC |
Zacks Reports |
StockTalk |
News |
Chart |
Request a new note
C
A N
S L
I M


|
BPI
-
NYSE
Bridgepoint Education
DIVERSIFIED SERVICES - Education and; Training Services
|
$22.12
|
-0.64
-2.81% |
$22.33
|
602,262
116.94% of 50 DAV
50 DAV is 515,000
|
$27.50
-19.56%
|
4/13/2010
|
$25.59
|
PP = $25.76
|
|
MB = $27.05
|
Most Recent Note - 5/25/2010 12:56:38 PM
G - Gapped down today, diving below recent lows and old chart highs near $22 previously mentioned as "a very important support level to watch." It would need to rally back above its 50 DMA line for its outlook to improve. Based on weakness it will be dropped from the Featured Stocks list tonight.
>>> The latest Featured Stock Update with an annotated graph appeared on 5/25/2010. Click here.
View all notes |
Alert me of new notes |
CANSLIM.net Company Profile |
SEC |
Zacks Reports |
StockTalk |
News |
Chart |
Request a new note
C
A N
S L
I M
|
BRLI
-
NASDAQ
Bio Reference Labs Inc
HEALTH SERVICES - Medical Laboratories and Researc
|
$22.58
|
+0.44
1.99% |
$22.66
|
309,589
166.45% of 50 DAV
50 DAV is 186,000
|
$24.67
-8.48%
|
2/12/2010
|
$39.02
|
PP = $20.49
|
|
MB = $21.51
|
Most Recent Note - 5/25/2010 5:58:53 PM
G - Gain on higher volume today was somewhat encouraging, but it remains below its 50 DMA line. For its outlook to improve it would need to repair the violation of its short-term average line.
>>> The latest Featured Stock Update with an annotated graph appeared on 5/11/2010. Click here.
View all notes |
Alert me of new notes |
CANSLIM.net Company Profile |
SEC |
Zacks Reports |
StockTalk |
News |
Chart |
Request a new note
C
A N
S L
I M
|
CRM
-
NYSE
Salesforce.Com Inc
INTERNET - Internet Software and Services
|
$82.13
|
-0.06
-0.07% |
$82.23
|
2,846,364
142.11% of 50 DAV
50 DAV is 2,003,000
|
$89.84
-8.58%
|
3/5/2010
|
$72.28
|
PP = $75.53
|
|
MB = $79.31
|
Most Recent Note - 5/24/2010 4:10:59 PM
G - Holding its ground after a positive reversal on 5/21/10 a sign of great institutional support again near its 50 DMA line. Concerns were raised after Microsoft Corp. recently sued the company for infringing on nine of its patents.
>>> The latest Featured Stock Update with an annotated graph appeared on 5/17/2010. Click here.
View all notes |
Alert me of new notes |
CANSLIM.net Company Profile |
SEC |
Zacks Reports |
StockTalk |
News |
Chart |
Request a new note
C
A N
S L
I M
|
LL
-
NYSE
Lumber Liquidators Hldgs
RETAIL - Home Improvement Stores
|
$27.92
|
-0.25
-0.89% |
$27.98
|
267,031
71.65% of 50 DAV
50 DAV is 372,700
|
$33.41
-16.43%
|
4/22/2010
|
$29.87
|
PP = $29.03
|
|
MB = $30.48
|
Most Recent Note - 5/24/2010 4:25:33 PM
G - Holding its ground after a positive reversal on 5/21/10, but technically it remains below its 50 DMA line after its slump under its December 2009 highs recently negated the latest breakout.
>>> The latest Featured Stock Update with an annotated graph appeared on 5/19/2010. Click here.
View all notes |
Alert me of new notes |
CANSLIM.net Company Profile |
SEC |
Zacks Reports |
StockTalk |
News |
Chart |
Request a new note
C
A N
S L
I M
|
Symbol/Exchange
Company Name
Industry Group |
PRICE |
CHANGE
(%Change) |
Day High |
Volume
(% DAV)
(% 50 day avg vol) |
52 Wk Hi
% From Hi |
Featured
Date |
Price
Featured |
Pivot Featured |
|
Max Buy |
LOPE
-
NASDAQ
Grand Canyon Education
DIVERSIFIED SERVICES - Education and; Training Services
|
$25.61
|
-0.31
-1.20% |
$25.73
|
484,944
121.05% of 50 DAV
50 DAV is 400,600
|
$28.46
-10.01%
|
4/13/2010
|
$27.71
|
PP = $27.33
|
|
MB = $28.70
|
Most Recent Note - 5/24/2010 4:26:38 PM
G - Held its ground today after a positive reversal and rally for a close above its 50 DMA line on 5/21/10 were encouraging signs. Its 4/29/10 low of $23.66 is the next important chart support.
>>> The latest Featured Stock Update with an annotated graph appeared on 5/10/2010. Click here.
View all notes |
Alert me of new notes |
CANSLIM.net Company Profile |
SEC |
Zacks Reports |
StockTalk |
News |
Chart |
Request a new note
C
A N
S L
I M
|
MELI
-
NASDAQ
Mercadolibre Inc
INTERNET - Internet Software and; Services
|
$47.46
|
+0.53
1.13% |
$47.70
|
565,510
91.14% of 50 DAV
50 DAV is 620,500
|
$55.75
-14.87%
|
5/13/2010
|
$54.21
|
PP = $55.85
|
|
MB = $58.64
|
Most Recent Note - 5/24/2010 4:28:32 PM
G - It has struggled following its 5/13/10 negative reversal and would need to rally back above its 50 DMA line for its outlook to improve. Meanwhile, its 200 DMA and recent lows define important near-term chart support.
>>> The latest Featured Stock Update with an annotated graph appeared on 5/13/2010. Click here.
View all notes |
Alert me of new notes |
CANSLIM.net Company Profile |
SEC |
Zacks Reports |
StockTalk |
News |
Chart |
Request a new note
C
A N
S L
I M
|
ROVI
-
NASDAQ
Rovi Corp
COMPUTER SOFTWARE andamp; SERVICES - Security Software andamp; Services
|
$36.66
|
-0.17
-0.46% |
$36.74
|
1,352,260
99.03% of 50 DAV
50 DAV is 1,365,500
|
$40.06
-8.49%
|
4/20/2010
|
$37.62
|
PP = $38.60
|
|
MB = $40.53
|
Most Recent Note - 5/24/2010 4:33:54 PM
G - Loss today on light volume leaves it below its 50 DMA line which may now act as resistance. Consolidating just -8% from its 52-week high. Its recent chart low ($33.17) defines near-term chart support above its 200 DMA line.
>>> The latest Featured Stock Update with an annotated graph appeared on 5/24/2010. Click here.
View all notes |
Alert me of new notes |
CANSLIM.net Company Profile |
SEC |
Zacks Reports |
StockTalk |
News |
Chart |
Request a new note
C
A N
S L
I M
|
SUMR
-
NASDAQ
Summer Infant Inc
CONSUMER NON-DURABLES - Personal Products
|
$7.36
|
-0.39
-5.03% |
$7.68
|
85,052
154.08% of 50 DAV
50 DAV is 55,200
|
$8.21
-10.35%
|
5/4/2010
|
$6.85
|
PP = $7.09
|
|
MB = $7.44
|
Most Recent Note - 5/25/2010 1:00:54 PM
G - Gapped down today, consolidating near its "max buy" level. Recently found prompt support near prior chart highs and its 50 DMA line.
>>> The latest Featured Stock Update with an annotated graph appeared on 5/21/2010. Click here.
View all notes |
Alert me of new notes |
CANSLIM.net Company Profile |
SEC |
Zacks Reports |
StockTalk |
News |
Chart |
Request a new note
C
A N
S L
I M
|
ULTA
-
NASDAQ
Ulta Salon Cosm & Frag
SPECIALTY RETAIL - Specialty Retail, Other
|
$22.86
|
-0.69
-2.93% |
$23.09
|
464,162
109.81% of 50 DAV
50 DAV is 422,700
|
$25.76
-11.26%
|
3/12/2010
|
$22.81
|
PP = $21.72
|
|
MB = $22.81
|
Most Recent Note - 5/25/2010 5:56:43 PM
G - Gapped down today and violated its 50 DMA line, however its recovery to close in the upper third of its intra-day range was an indication of support. Recent chart lows define important support to watch.
>>> The latest Featured Stock Update with an annotated graph appeared on 5/20/2010. Click here.
View all notes |
Alert me of new notes |
CANSLIM.net Company Profile |
SEC |
Zacks Reports |
StockTalk |
News |
Chart |
Request a new note
C
A N
S L
I M
|
Symbol/Exchange
Company Name
Industry Group |
PRICE |
CHANGE
(%Change) |
Day High |
Volume
(% DAV)
(% 50 day avg vol) |
52 Wk Hi
% From Hi |
Featured
Date |
Price
Featured |
Pivot Featured |
|
Max Buy |
|
|
|
THESE ARE NOT BUY RECOMMENDATIONS!
Comments contained in the body of this report are technical
opinions only. The material herein has been obtained
from sources believed to be reliable and accurate, however,
its accuracy and completeness cannot be guaranteed.
This site is not an investment advisor, hence it does
not endorse or recommend any securities or other investments.
Any recommendation contained in this report may not
be suitable for all investors and it is not to be deemed
an offer or solicitation on our part with respect to
the purchase or sale of any securities. All trademarks,
service marks and trade names appearing in this report
are the property of their respective owners, and are
likewise used for identification purposes only.
This report is a service available
only to active Paid Premium Members.
You may opt-out of receiving report notifications
at any time. Questions or comments may be submitted
by writing to Premium Membership Services 665 S.E. 10 Street, Suite 201 Deerfield Beach, FL 33441-5634 or by calling 1-800-965-8307
or 954-785-1121.
|
|
|


