You are not logged in.
This means you
CAN ONLY VIEW reports that were published prior to Tuesday, July 9, 2024.
You
MUST UPGRADE YOUR MEMBERSHIP if you want to see any current reports.
AFTER MARKET UPDATE - FRIDAY, MAY 24TH, 2024
Previous After Market Report Next After Market Report >>>
|
|
|
|
DOW |
+4.33 |
39,069.59 |
+0.01% |
|
Volume |
747,160,433 |
-17% |
|
Volume |
5,924,873,400 |
-24% |
|
NASDAQ |
+184.76 |
16,920.79 |
+1.10% |
|
Advancers |
2,010 |
73% |
|
Advancers |
2,753 |
66% |
|
S&P 500 |
+36.88 |
5,304.72 |
+0.70% |
|
Decliners |
732 |
27% |
|
Decliners |
1,440 |
34% |
|
Russell 2000 |
+21.26 |
2,069.67 |
+1.04% |
|
52 Wk Highs |
95 |
|
|
52 Wk Highs |
93 |
|
|
S&P 600 |
+11.85 |
1,320.59 |
+0.91% |
|
52 Wk Lows |
42 |
|
|
52 Wk Lows |
116 |
|
|
 |
Nasdaq Composite Index Led Major Indices as Dow Industrials Lagged
Kenneth J. Gruneisen - Passed the CAN SLIM® Master's Exam
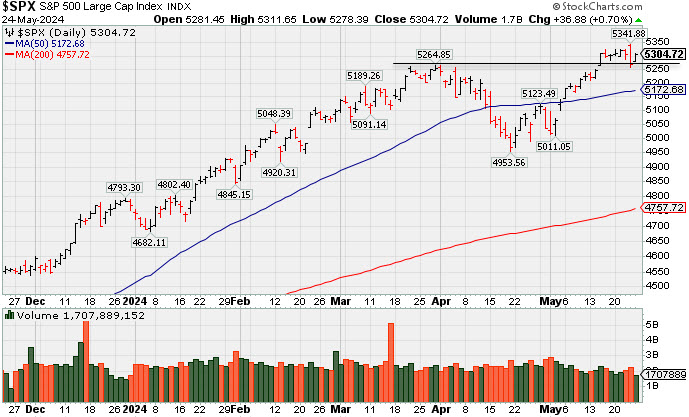
The S&P 500 Index (+0.7%) and Nasdaq Composite Index (+1.1%), which hit a new record high, closed at or near their intra-day highs. The Dow Jones Industrial Average underperformed, closing little changed and near the session low. Volume was lighter on both major exchanges, reflecting a lack of participation in front of the three-day weekend. Markets will closed on Monday for Memorial Day. Breadth was clearly positive as advancers led decliners by almost a 3-1 margin on the NYSE and near a 2-1 margin on the Nasdaq exchange. There were 67 high-ranked companies from the Leaders List that hit new 52-week highs and were listed on the BreakOuts Page matching the total of 64 on the prior session. New 52-week highs outnumbered new 52-week lows on the NYSE but new low outnumbered new highs on the Nasdaq exchange. The major indices are in a confirmed uptrend (M criteria).
PICTURED: The S&P 500 Index is consolidating following a "negative reversal" and loss with higher volume on Thursday after hitting a new all-time high.
Ten of the 11 S&P 500 sectors closed with gains. The communication services (+1.3%) and information technology (+1.1%) notched the largest gains while the health care sector (-0.3%) was alone in negative territory.
The 2-yr note yield settled two basis points higher at 4.95%. The 10-yr note yield settled one basis point lower at 4.46%. Treasuries initially saw an uptick in selling following a stronger-than-expected April Durable Orders report (+0.7%). Selling pressure eased following the final reading of the University of Michigan's Consumer Sentiment survey, which showed that year-ahead inflation expectations slowed to 3.3% from 3.5% in the preliminary reading.
|
 Kenneth J. Gruneisen started out as a licensed stockbroker in August 1987, a couple of months prior to the historic stock market crash that took the Dow Jones Industrial Average down -22.6% in a single day. He has published daily fact-based fundamental and technical analysis on high-ranked stocks online for two decades. Through FACTBASEDINVESTING.COM, Kenneth provides educational articles, news, market commentary, and other information regarding proven investment systems that work in good times and bad.
Comments contained in the body of this report are technical opinions only and are not necessarily those of Gruneisen Growth Corp. The material herein has been obtained from sources believed to be reliable and accurate, however, its accuracy and completeness cannot be guaranteed. Our firm, employees, and customers may effect transactions, including transactions contrary to any recommendation herein, or have positions in the securities mentioned herein or options with respect thereto. Any recommendation contained in this report may not be suitable for all investors and it is not to be deemed an offer or solicitation on our part with respect to the purchase or sale of any securities. |
|
 |
Financial, Semiconductor, and Gold & Silver Indexes Led Gainers
Kenneth J. Gruneisen - Passed the CAN SLIM® Master's Exam
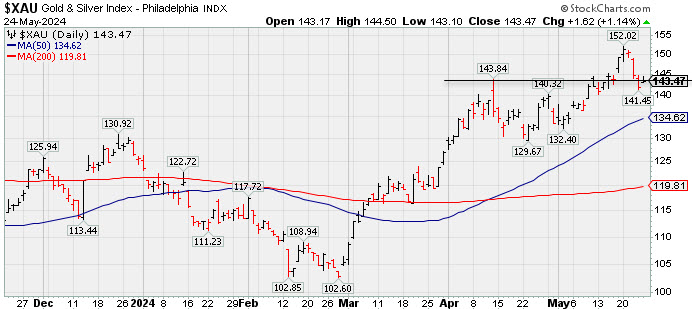
The Bank Index ($BKX +0.87%) and the Broker/Dealer Index ($XBD +1.79%) both posted solid gains while the Retail Index ($RLX +0.08%) finished flat on Friday's session.TheNetworking Index ($NWX +1.14%) and the Semiconductor Index ($SOX +1.85%) both posted gains while the Biotech Index ($BTK -0.48%) lost ground. Commodity-linked groups had a positive bias as the Gold & Silver Index ($XAU +1.14%) posted a solid gain and the Oil Services ($OSX +0.13%) and theIntegrated Oil Index ($XOI +0.38%) both inched higher.
![]() PICTURED: The Gold & Silver Index ($XAU +1.14%) is consolidating near prior highs and well above its 50-day moving average (DMA) line.
| Oil Services |
$OSX |
84.63 |
+0.11 |
+0.13% |
+0.90% |
| Integrated Oil |
$XOI |
2,064.90 |
+7.92 |
+0.38% |
+10.87% |
| Semiconductor |
$SOX |
5,220.91 |
+94.93 |
+1.85% |
+25.04% |
| Networking |
$NWX |
790.66 |
+8.94 |
+1.14% |
-5.06% |
| Broker/Dealer |
$XBD |
633.92 |
+11.17 |
+1.79% |
+13.75% |
| Retail |
$RLX |
4,325.70 |
+3.54 |
+0.08% |
+11.24% |
| Gold & Silver |
$XAU |
143.47 |
+1.62 |
+1.14% |
+14.14% |
| Bank |
$BKX |
104.88 |
+0.90 |
+0.87% |
+9.22% |
| Biotech |
$BTK |
5,211.14 |
-25.00 |
-0.48% |
-3.83% |
|
|
|
 |
Big "Breakaway Gap" for Deckers Outdoor
Kenneth J. Gruneisen - Passed the CAN SLIM® Master's Exam
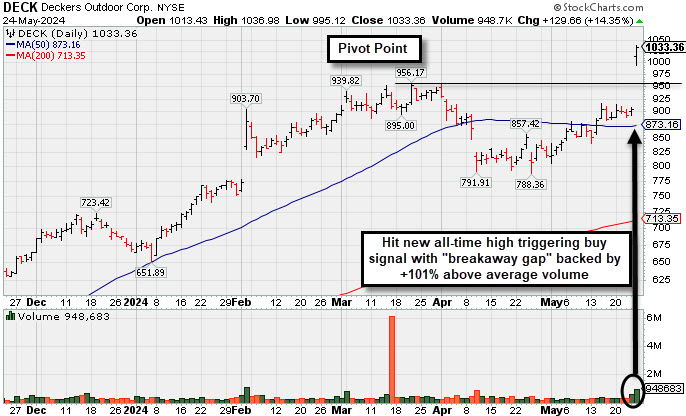
Deckers Outdoor Corp (DECK +$128.25 or +14.18% to $1,032.90) finished strong after was highlighted in yellow with pivot point cited based on its 3/21/24 high plus 10 cents in the earlier mid-day report (read here). Its "breakaway gap" was backed by +101% above average volume as it hit a new all-time high today triggering a technical buy signal. The prior high ($956) defines initial support to watch on pullbacks.
DECK has a 99 Earnings Per Share Rating. Bullish action came after it reported very strong Mar '24 quarterly earnings +43% on +21% sales revenues versus the year ago period. Prior quarterly earnings comparisons were also well above the +25% minimum guideline (C criteria). Annual earnings growth has been strong and steady.
The number of top-rated funds owning its shares rose from 1,411 in Jun '23 to 1,865 in Mar '24, a reassuring sign concerning the investment system's I criteria. Its current Up/Down Volume Ratio of 0.7 is an unbiased indication its shares have been under distributional pressure over the past 50 days.
It has a small supply of only 25.7 million shares outstanding (S criteria), which makes it prone to be a volatile stock in the event of institutional accumulation or distribution. The small supply is favorable, provided proper discipline is used.
|
|
|
Color Codes Explained :
Y - Better candidates highlighted by our
staff of experts.
G - Previously featured
in past reports as yellow but may no longer be buyable under the
guidelines.
***Last / Change / Volume data in this table is the closing quote data***
Symbol/Exchange
Company Name
Industry Group |
PRICE |
CHANGE
(%Change) |
Day High |
Volume
(% DAV)
(% 50 day avg vol) |
52 Wk Hi
% From Hi |
Featured
Date |
Price
Featured |
Pivot Featured |
|
Max Buy |
 TDG
-
NYSE
TDG
-
NYSE
TransDigm Group
Aerospace/Defense
|
$1,350.31
|
+19.59
1.47% |
$1,350.31
|
136,045
67.68% of 50 DAV
50 DAV is 201,000
|
$1,340.97
0.70%
|
4/12/2024
|
$1,224.21
|
PP = $1,246.32
|
|
MB = $1,308.64
|
 Most Recent Note - 5/24/2024 5:49:50 PM
G - Posted a gain today with below-average volume hitting another new all-time high. It is extended from any sound base and its 50 DMA line ($1,251) defines near-term support to watch on pullbacks. Fundamentals remain strong.
>>> FEATURED STOCK ARTICLE : Aerospace/Defense Firm Hitting Another All-Time High - 5/21/2024 |
View all notes |
Set NEW NOTE alert |
Company Profile |
SEC
News |
Chart |
Request a new note
C
A
S
I |
USLM
-
NASDAQ
U.S. Lime & Minerals
Bldg-Cement/Concrt/Ag
|
$350.19
|
-1.63
-0.46% |
$358.29
|
14,382
53.27% of 50 DAV
50 DAV is 27,000
|
$378.78
-7.55%
|
2/9/2024
|
$254.68
|
PP = $265.09
|
|
MB = $278.34
|
Most Recent Note - 5/24/2024 5:50:53 PM
G - Pulled back today for an 8th consecutive small loss without heavy volume. Stubbornly holding its ground following noted volume-driven gains into new all-time high territory. Its 50 DMA line ($320) defines important near-term support to watch on pullbacks. Fundamentals remain strong.
>>> FEATURED STOCK ARTICLE : Stubbornly Held Ground and Posted Quiet Gain for Best-Ever Close - 5/14/2024 |
View all notes |
Set NEW NOTE alert |
Company Profile |
SEC
News |
Chart |
Request a new note
C
A
S
I |
CLS
-
NYSE
Celestica
Elec-Contract Mfg
|
$58.80
|
+3.43
6.19% |
$58.99
|
2,510,747
110.46% of 50 DAV
50 DAV is 2,273,000
|
$57.13
2.92%
|
5/15/2024
|
$51.52
|
PP = $51.22
|
|
MB = $53.78
|
Most Recent Note - 5/24/2024 5:43:12 PM
G - Hit yet another new all-time high with today's 3rd consecutive volume-driven gain, getting more extended from any sound base. Prior highs in the $51 area define initial support to watch above its 50 DMA line ($47).
>>> FEATURED STOCK ARTICLE : Strong Breakout After 6-Week Flat Base - 5/15/2024 |
View all notes |
Set NEW NOTE alert |
Company Profile |
SEC
News |
Chart |
Request a new note
C
A
S
I |
AROC
-
NYSE
Archrock
OilandGas-Machinery/Equip
|
$19.79
|
+0.26
1.33% |
$19.82
|
1,125,220
75.77% of 50 DAV
50 DAV is 1,485,000
|
$21.61
-8.42%
|
5/20/2024
|
$21.23
|
PP = $21.50
|
|
MB = $22.58
|
Most Recent Note - 5/24/2024 5:42:00 PM
G - Color code is changed to green after slumping below its 50 DMA line ($19.94) raising concerns. Only a prompt rebound above the 50 DMA line would help its outlook improve. There was a "negative reversal" and it closed near the session low on 5/21/24 after hitting new multi-year highs.
>>> FEATURED STOCK ARTICLE : Strong Finish for Archrock After Highlighted in Mid-Day Report - 5/20/2024 |
View all notes |
Set NEW NOTE alert |
Company Profile |
SEC
News |
Chart |
Request a new note
C
A
S
I |
DECK
-
NYSE
Deckers Outdoor
Apparel-Shoes and Rel Mfg
|
$1,032.90
|
+128.25
14.18% |
$1,036.98
|
949,335
200.71% of 50 DAV
50 DAV is 473,000
|
$956.17
8.02%
|
5/24/2024
|
$1,010.60
|
PP = $956.27
|
|
MB = $1,004.08
|
Most Recent Note - 5/24/2024 5:45:27 PM
Y - Finished strong today after highlighted in yellow with new pivot point cited based on its 3/21/24 high plus 10 cents. Hit a new all-time high with a "breakaway gap" backed by +101% above average volume triggering a technical buy signal. The 6 latest quarterly comparisons through Mar '24 were above the +25% minimum earnings guideline (C criteria). Annual earnings (A criteria) growth has been strong and steady. See the latest FSU analysis for more details and a new annotated graph.
>>> FEATURED STOCK ARTICLE : Big "Breakaway Gap" for Deckers Outdoor - 5/24/2024 |
View all notes |
Set NEW NOTE alert |
Company Profile |
SEC
News |
Chart |
Request a new note
C
A
S
I |
Symbol/Exchange
Company Name
Industry Group |
PRICE |
CHANGE
(%Change) |
Day High |
Volume
(% DAV)
(% 50 day avg vol) |
52 Wk Hi
% From Hi |
Featured
Date |
Price
Featured |
Pivot Featured |
|
Max Buy |
ELF
-
NYSE
e.l.f. Beauty
Cosmetics/Personal Care
|
$191.42
|
+6.65
3.60% |
$197.85
|
2,544,240
153.54% of 50 DAV
50 DAV is 1,657,000
|
$221.83
-13.71%
|
5/24/2024
|
$193.79
|
PP = $182.73
|
|
MB = $191.87
|
Most Recent Note - 5/24/2024 5:46:41 PM
Y - Color code was changed to yellow in the earlier mid-day report with pivot point cited based on its 4/29/24 high after breaking out a "double-bottom" base. Rallied further after gapping up and rebounding above its 50 DMA line ($173.55) with a volume-driven gain on the prior session helping its technical stance and outlook improve. Found support above its 200 DMA line since dropped from the Featured Stocks list on 4/03/24. Reported Mar '24 quarterly earnings +26% on +71% sales revenues versus the year-ago period and fundamentals remain strong.
>>> FEATURED STOCK ARTICLE : ELF Consolidating Above 50-Day Moving Average Line - 3/28/2024 |
View all notes |
Set NEW NOTE alert |
Company Profile |
SEC
News |
Chart |
Request a new note
C
A
S
I |
PDD
-
NASDAQ
PDD Holdings ADR
Retail-Internet
|
$157.57
|
+3.94
2.56% |
$164.69
|
19,092,287
188.75% of 50 DAV
50 DAV is 10,115,000
|
$160.00
-1.52%
|
5/24/2024
|
$161.85
|
PP = $153.09
|
|
MB = $160.74
|
Most Recent Note - 5/24/2024 5:48:57 PM
Y - Color code was changed to yellow in the earlier mid-day report with pivot point cited based on its 1/11/24 high plus 10 cents. Rallied to new 52-week highs with 3 consecutive volume-driven gains clearing a 20-week base during which it found prompt support at its 200 DMA line. Quarterly comparisons through Mar '24 showed encouraging sales revenues and greatly improved earnings versus the year-ago periods with growth rate acceleration. After years of losses, it had a profitable FY '21-23 helping it better match the fundamental annual earnings (A criteria) guidelines of the fact-based investment system.
There are no Featured Stock Updates™ available for this stock at this time. You may request one by clicking the Request a New Note link below |
View all notes |
Set NEW NOTE alert |
Company Profile |
SEC
News |
Chart |
Request a new note
C
A
S
I |
|
|
|
THESE ARE NOT BUY RECOMMENDATIONS!
Comments contained in the body of this report are technical
opinions only. The material herein has been obtained
from sources believed to be reliable and accurate, however,
its accuracy and completeness cannot be guaranteed.
This site is not an investment advisor, hence it does
not endorse or recommend any securities or other investments.
Any recommendation contained in this report may not
be suitable for all investors and it is not to be deemed
an offer or solicitation on our part with respect to
the purchase or sale of any securities. All trademarks,
service marks and trade names appearing in this report
are the property of their respective owners, and are
likewise used for identification purposes only.
This report is a service available
only to active Paid Premium Members.
You may opt-out of receiving report notifications
at any time. Questions or comments may be submitted
by writing to Premium Membership Services 665 S.E. 10 Street, Suite 201 Deerfield Beach, FL 33441-5634 or by calling 1-800-965-8307
or 954-785-1121.
|
|
|