You are not logged in.
This means you
CAN ONLY VIEW reports that were published prior to Tuesday, July 9, 2024.
You
MUST UPGRADE YOUR MEMBERSHIP if you want to see any current reports.
AFTER MARKET UPDATE - THURSDAY, MAY 23RD, 2024
Previous After Market Report Next After Market Report >>>
|
|
|
|
DOW |
-605.78 |
39,065.26 |
-1.53% |
|
Volume |
903,154,763 |
+3% |
|
Volume |
7,819,710,400 |
+1% |
|
NASDAQ |
-65.51 |
16,736.03 |
-0.39% |
|
Advancers |
442 |
16% |
|
Advancers |
950 |
22% |
|
S&P 500 |
-39.17 |
5,267.84 |
-0.74% |
|
Decliners |
2,337 |
84% |
|
Decliners |
3,296 |
78% |
|
Russell 2000 |
-33.30 |
2,048.41 |
-1.60% |
|
52 Wk Highs |
74 |
|
|
52 Wk Highs |
141 |
|
|
S&P 600 |
-18.67 |
1,308.74 |
-1.41% |
|
52 Wk Lows |
73 |
|
|
52 Wk Lows |
162 |
|
|
 |
Major Indices Encounter Mild Distributional Pressure
Kenneth J. Gruneisen - Passed the CAN SLIM® Master's Exam
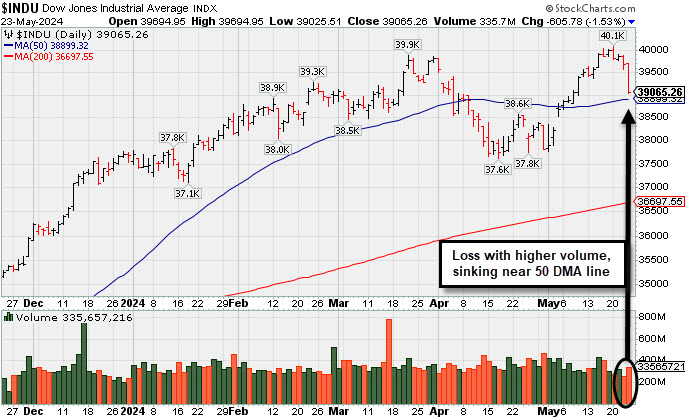
Selling in the afternoon led all of the major indices to finish near their lows of the day with losses ranging from -0.4% to -1.5%. Volume reported was higher than the prior session totals on the NYSE and on the Nasdaq exchange, action again noted as indicative of distributional pressure. Breadth was clearly negative as decliners led advancers by more than a 5-1 margin on the NYSE and by more than a 3-1 margin on the Nasdaq exchange. There were 64 high-ranked companies from the Leaders List that hit new 52-week highs and were listed on the BreakOuts Page matching the total of 64 on the prior session. New 52-week highs and new 52-week lows totals were evenly matched on the NYSE but new low lows outnumbered new highs on the Nasdaq exchange. The major indices are in a confirmed uptrend (M criteria).
PICTURED: The Dow Jones Industrial Average pulled back from its all-time high with a big loss on Thursday backed with higher volume.
The S&P Global U.S. Manufacturing PMI increased to 50.9 from 50.0 while the S&P Global U.S. Services PMI jumped to 54.8 from 51.3. The New Home Sales Report for April was weaker than expected. The 10-yr note yield settled four basis points higher at 4.48% and the 2-yr note yield was five basis points higher at 4.93%.
Ten of the 11 S&P 500 sectors settled lower. The information technology sector was the lone standout in positive territory at the close, gaining 0.6%, benefitting from activity in NVDA. Meanwhile, the rate-sensitive real estate (-2.2%) and utilities (-1.7%) sectors logged the largest declines, clipped by rising rates.
|
 Kenneth J. Gruneisen started out as a licensed stockbroker in August 1987, a couple of months prior to the historic stock market crash that took the Dow Jones Industrial Average down -22.6% in a single day. He has published daily fact-based fundamental and technical analysis on high-ranked stocks online for two decades. Through FACTBASEDINVESTING.COM, Kenneth provides educational articles, news, market commentary, and other information regarding proven investment systems that work in good times and bad.
Comments contained in the body of this report are technical opinions only and are not necessarily those of Gruneisen Growth Corp. The material herein has been obtained from sources believed to be reliable and accurate, however, its accuracy and completeness cannot be guaranteed. Our firm, employees, and customers may effect transactions, including transactions contrary to any recommendation herein, or have positions in the securities mentioned herein or options with respect thereto. Any recommendation contained in this report may not be suitable for all investors and it is not to be deemed an offer or solicitation on our part with respect to the purchase or sale of any securities. |
|
 |
Retail, Financial, Commodity, and Tech Indices Fell
Kenneth J. Gruneisen - Passed the CAN SLIM® Master's Exam
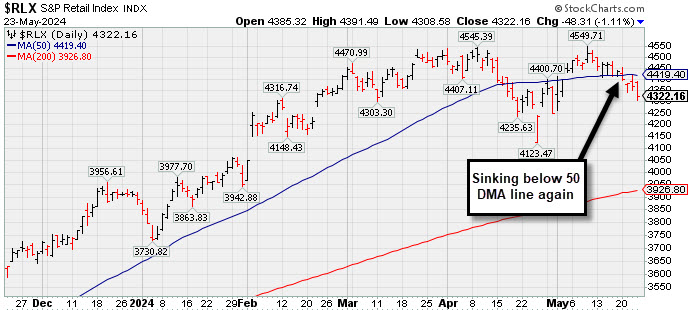
The Retail Index ($RLX -1.11%), Bank Index ($BKX -1.81%), and the Broker/Dealer Index ($XBD -0.70%) each suffered a small loss on Thursday's session. The Networking Index ($NWX -2.35%) and the Biotech Index ($BTK -1.69%) both lost ground while the Semiconductor Index ($SOX -0.02%) finished flat. Commodity-linked groups had a clearly negative bias, led lower by the Gold & Silver Index ($XAU -1.97%), with the Oil Services ($OSX -0.95%) and the Integrated Oil Index ($XOI -0.45%) also losing ground.
![]() PICTURED: The Retail Index ($RLX -1.11%) ended lower for a 4th consecutive session. It has been slumping below its 50-day moving average (DMA) line again after recently recovering and reaching a new all-time high.
| Oil Services |
$OSX |
84.52 |
-0.81 |
-0.95% |
+0.77% |
| Integrated Oil |
$XOI |
2,056.98 |
-9.40 |
-0.45% |
+10.44% |
| Semiconductor |
$SOX |
5,125.98 |
-0.83 |
-0.02% |
+22.76% |
| Networking |
$NWX |
781.72 |
-18.79 |
-2.35% |
-6.13% |
| Broker/Dealer |
$XBD |
622.75 |
-4.39 |
-0.70% |
+11.75% |
| Retail |
$RLX |
4,322.16 |
-48.31 |
-1.11% |
+11.14% |
| Gold & Silver |
$XAU |
141.84 |
-2.86 |
-1.97% |
+12.85% |
| Bank |
$BKX |
103.97 |
-1.92 |
-1.81% |
+8.28% |
| Biotech |
$BTK |
5,236.14 |
-90.27 |
-1.69% |
-3.37% |
|
|
|
 |
Featured Stocks
Kenneth J. Gruneisen - Passed the CAN SLIM® Master's Exam
|
|
|
Color Codes Explained :
Y - Better candidates highlighted by our
staff of experts.
G - Previously featured
in past reports as yellow but may no longer be buyable under the
guidelines.
***Last / Change / Volume data in this table is the closing quote data***
Symbol/Exchange
Company Name
Industry Group |
PRICE |
CHANGE
(%Change) |
Day High |
Volume
(% DAV)
(% 50 day avg vol) |
52 Wk Hi
% From Hi |
Featured
Date |
Price
Featured |
Pivot Featured |
|
Max Buy |
 TDG
-
NYSE
TDG
-
NYSE
TransDigm Group
Aerospace/Defense
|
$1,330.72
|
+4.53
0.34% |
$1,335.00
|
172,494
85.82% of 50 DAV
50 DAV is 201,000
|
$1,340.97
-0.76%
|
4/12/2024
|
$1,224.21
|
PP = $1,246.32
|
|
MB = $1,308.64
|
Most Recent Note - 5/21/2024 6:10:58 PM
G - Posted a 3rd consecutive gain today with average volume while hitting another new all-time high. It is extended from any sound base and its 50 DMA line ($1,242) defines near-term support to watch on pullbacks. Reported Mar '24 quarterly earnings +34% on +21% sales revenues versus the year-ago period. See the latest FSU analysis for more details and a new annotated graph.
>>> FEATURED STOCK ARTICLE : Aerospace/Defense Firm Hitting Another All-Time High - 5/21/2024 |
View all notes |
Set NEW NOTE alert |
Company Profile |
SEC
News |
Chart |
Request a new note
C
A
S
I |
USLM
-
NASDAQ
U.S. Lime & Minerals
Bldg-Cement/Concrt/Ag
|
$351.82
|
-6.53
-1.82% |
$362.16
|
17,295
64.06% of 50 DAV
50 DAV is 27,000
|
$378.78
-7.12%
|
2/9/2024
|
$254.68
|
PP = $265.09
|
|
MB = $278.34
|
Most Recent Note - 5/21/2024 12:24:25 PM
G - Pulling back today for a 5th consecutive small loss without heavy volume. Stubbornly holding its ground following noted volume-driven gains into new all-time high territory. Its 50 DMA line ($316.67) defines important near-term support to watch on pullbacks. Fundamentals remain strong.
>>> FEATURED STOCK ARTICLE : Stubbornly Held Ground and Posted Quiet Gain for Best-Ever Close - 5/14/2024 |
View all notes |
Set NEW NOTE alert |
Company Profile |
SEC
News |
Chart |
Request a new note
C
A
S
I |
CLS
-
NYSE
Celestica
Elec-Contract Mfg
|
$55.37
|
+1.49
2.77% |
$57.13
|
3,289,788
147.26% of 50 DAV
50 DAV is 2,234,000
|
$54.28
2.01%
|
5/15/2024
|
$51.52
|
PP = $51.22
|
|
MB = $53.78
|
 Most Recent Note - 5/23/2024 12:59:33 PM
G - Gapped up again today for yet another new all-time high, getting extended from any sound base. Color code was changed to green after rising above its "max buy" level. On pullbacks prior highs in the $51 area define initial support to watch above its 50 DMA line ($46.69).
>>> FEATURED STOCK ARTICLE : Strong Breakout After 6-Week Flat Base - 5/15/2024 |
View all notes |
Set NEW NOTE alert |
Company Profile |
SEC
News |
Chart |
Request a new note
C
A
S
I |
AROC
-
NYSE
Archrock
OilandGas-Machinery/Equip
|
$19.53
|
-0.20
-1.01% |
$20.00
|
1,318,337
87.60% of 50 DAV
50 DAV is 1,505,000
|
$21.61
-9.63%
|
5/20/2024
|
$21.23
|
PP = $21.50
|
|
MB = $22.58
|
Most Recent Note - 5/22/2024 12:00:39 PM
Y - Slumping near its 50 DMA line ($19.92) with today's big loss. There was a "negative reversal" and it closed near the session low on the prior session after hitting new multi-year highs. Color code was changed to yellow with pivot point cited based on its 4/04/24 high plus 10 cents in the 5/20/24 mid-day report - "Found support above its 50 DMA line during an orderly 6-week flat base. Subsequent gains above the pivot point backed by at least +40% above average volume may trigger a technical buy signal. Earnings increases have been above the +25% mninimum guideline in quarterly comparisons through Mar '24 versus the year-ago periods. Annual earnings (A criteria) growth has been strong after a loss in FY '20."
>>> FEATURED STOCK ARTICLE : Strong Finish for Archrock After Highlighted in Mid-Day Report - 5/20/2024 |
View all notes |
Set NEW NOTE alert |
Company Profile |
SEC
News |
Chart |
Request a new note
C
A
S
I |
|
|
|
THESE ARE NOT BUY RECOMMENDATIONS!
Comments contained in the body of this report are technical
opinions only. The material herein has been obtained
from sources believed to be reliable and accurate, however,
its accuracy and completeness cannot be guaranteed.
This site is not an investment advisor, hence it does
not endorse or recommend any securities or other investments.
Any recommendation contained in this report may not
be suitable for all investors and it is not to be deemed
an offer or solicitation on our part with respect to
the purchase or sale of any securities. All trademarks,
service marks and trade names appearing in this report
are the property of their respective owners, and are
likewise used for identification purposes only.
This report is a service available
only to active Paid Premium Members.
You may opt-out of receiving report notifications
at any time. Questions or comments may be submitted
by writing to Premium Membership Services 665 S.E. 10 Street, Suite 201 Deerfield Beach, FL 33441-5634 or by calling 1-800-965-8307
or 954-785-1121.
|
|
|