You are not logged in.
This means you
CAN ONLY VIEW reports that were published prior to Monday, April 14, 2025.
You
MUST UPGRADE YOUR MEMBERSHIP if you want to see any current reports.
AFTER MARKET UPDATE - FRIDAY, MAY 23RD, 2014
Previous After Market Report Next After Market Report >>>
|
|
|
|
DOW |
+63.19 |
16,606.27 |
+0.38% |
|
Volume |
543,122,040 |
-4% |
|
Volume |
1,439,502,900 |
-16% |
|
NASDAQ |
+31.47 |
4,185.81 |
+0.76% |
|
Advancers |
2,097 |
66% |
|
Advancers |
1,989 |
72% |
|
S&P 500 |
+8.04 |
1,900.53 |
+0.42% |
|
Decliners |
943 |
30% |
|
Decliners |
666 |
24% |
|
Russell 2000 |
+12.32 |
1,126.19 |
+1.11% |
|
52 Wk Highs |
118 |
|
|
52 Wk Highs |
54 |
|
|
S&P 600 |
+6.56 |
650.03 |
+1.02% |
|
52 Wk Lows |
10 |
|
|
52 Wk Lows |
35 |
|
|
 |
Benchmark S&P 500 Index's Gain Leads to Best-Ever Close
Kenneth J. Gruneisen - Passed the CAN SLIM® Master's Exam
With Friday's gains, the major averages finished higher on the week. The Dow rose +0.7%, the S&P 500 increased +1.2% and the NASDAQ climbed +2.3%. The volume was reported lighter than the prior session totals on the NYSE and on the Nasdaq exchange, still hinting that institutional buying demand was tame. Breadth was positive as advancers led decliners by a 2-1 margin on the NYSE and 3-1 on the Nasdaq exchange. Leadership improved as there were 41 high-ranked companies from the CANSLIM.net Leaders List that made new 52-week highs and appeared on the CANSLIM.net BreakOuts Page, up from the total of 39 stocks on the prior session. New 52-week highs outnumbered new 52-week lows on the NYSE and on the Nasdaq exchange. There were gains for 4 of the 8 high-ranked companies currently included on the Featured Stocks Page. Technically, the S&P 500 Index's new high close makes it difficult to argue that the market direction (M criteria) is not in a "confirmed uptrend". Any new buying efforts should be selective and focused in stocks meeting all key criteria of the fact-based investment system.
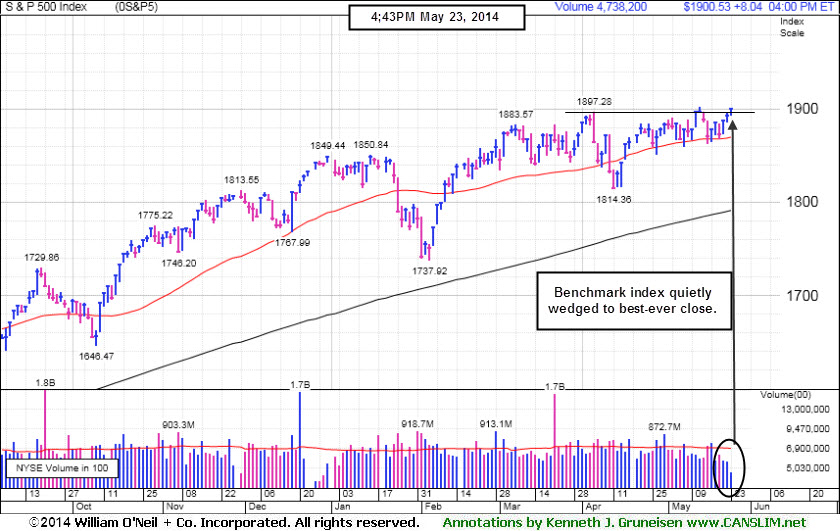
Stocks rose heading into the Memorial Day holiday. The Dow was up 63 points to 16606. The S&P 500 gained 8 points to reach an all-time closing high of 1900. The NASDAQ climbed 31 points to finish at 4,185.
The major averages ended the week on a positive note following an encouraging update on the housing market. Shortly after the open, a report showed new home sales increased +6.4% in April after posting declines in the prior two months. Homebuilders moved higher on the news with Lennar (LEN +4%) and D.R. Horton (DHI +4.1%) advancing.
On the earnings front, GameStop (GME +4.2%) rose after posting results above consensus estimates. Gap (GPS +0.7%) edged higher even after reporting a -22% decline in quarterly profits.
Eight of 10 sectors in the S&P 500 were up on the session. Technology was the best performing group. Hewlett-Packard (HPQ +6.1%) rose after announcing plans to further reduce its headcount by as many as 16,000 workers. Utilities were down as Dominion Resources (D -0.7%) edged lower.
Treasuries advanced with the 10-year note up 5/32 to yield 2.53%.
Keep in mind that any sustained and meaningful market advance requires leadership - a healthy crop of stocks hitting new 52-week highs. The CANSLIM.net Featured Stocks Page shows the most action-worthy candidates and their latest notes and a Headline Link directs members to the latest detailed analysis with data-packed graphs annotated by a Certified expert along with links to additional resources. The Premium Member Homepage includes "dynamic archives" to all prior pay reports published. Watch for an announcement via email concerning the next WEBCAST.
PICTURED: The S&P 500 Index's gain of 8 points on Friday helped it finish at a best-ever close. Subsequent deterioration below its 50-day moving average (DMA) line would raise concerns and prompt investors to aim toward reducing exposure in equities.
|
 Kenneth J. Gruneisen started out as a licensed stockbroker in August 1987, a couple of months prior to the historic stock market crash that took the Dow Jones Industrial Average down -22.6% in a single day. He has published daily fact-based fundamental and technical analysis on high-ranked stocks online for two decades. Through FACTBASEDINVESTING.COM, Kenneth provides educational articles, news, market commentary, and other information regarding proven investment systems that work in good times and bad.
Comments contained in the body of this report are technical opinions only and are not necessarily those of Gruneisen Growth Corp. The material herein has been obtained from sources believed to be reliable and accurate, however, its accuracy and completeness cannot be guaranteed. Our firm, employees, and customers may effect transactions, including transactions contrary to any recommendation herein, or have positions in the securities mentioned herein or options with respect thereto. Any recommendation contained in this report may not be suitable for all investors and it is not to be deemed an offer or solicitation on our part with respect to the purchase or sale of any securities. |
|
 |
Retail and Financial Indexes Gave Market a Boost
Kenneth J. Gruneisen - Passed the CAN SLIM® Master's Exam
The Retail Index ($RLX +0.89%) posted a modest gain and the financial indexes had a slightly positive bias on Friday as the Bank Index ($BKX +0.28%) and the Broker/Dealer Index ($XBD +0.36%) edged higher. The Semiconductor Index ($SOX +0.96%) led the tech sector while the Networking Index ($NWX +0.14%) posted a smaller gain and the Biotechnology Index ($BTK -0.42%) slumped. Commodity linked groups had a slightly negative bias as the Gold & Silver Index ($XAU -0.62%) outpaced the Integrated Oil Index ($XOI -0.21%) and the Oil Services Index ($OSX -0.16%) to the downside.
Charts courtesy www.stockcharts.com
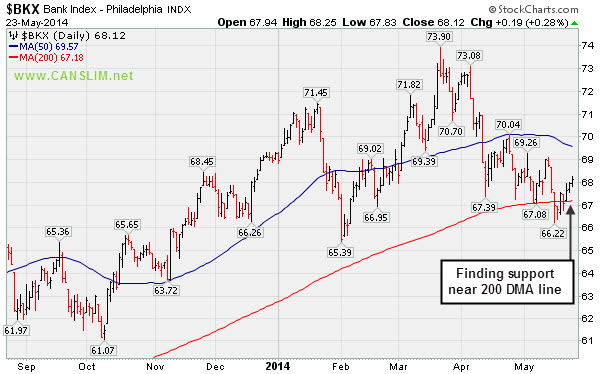
PICTURED 1: The Bank Index ($BKX +0.28%) recently found support near its 200-day moving average line. Since financials are reliable "leading indicators" any further deterioration from financial stocks would not bode well for the broader market outlook.
Charts courtesy www.stockcharts.com
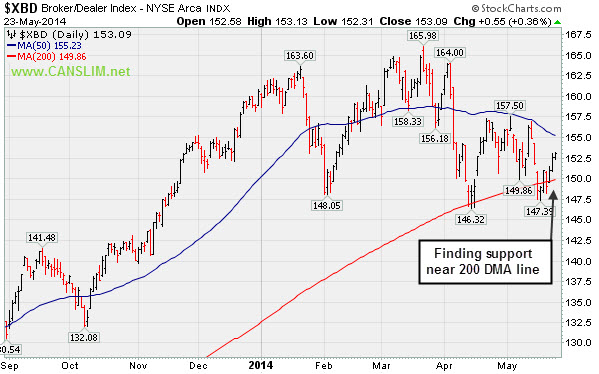
PICTURED 2: The Broker/Dealer Index ($XBD +0.36%) recently found support near its 200-day moving average line. Since financials are reliable "leading indicators" any further deterioration from financial stocks would not bode well for the broader market outlook.
| Oil Services |
$OSX |
286.90 |
-0.46 |
-0.16% |
+2.09% |
| Integrated Oil |
$XOI |
1,616.25 |
-3.44 |
-0.21% |
+7.52% |
| Semiconductor |
$SOX |
589.91 |
+5.61 |
+0.96% |
+10.26% |
| Networking |
$NWX |
333.61 |
+0.47 |
+0.14% |
+2.99% |
| Broker/Dealer |
$XBD |
153.09 |
+0.55 |
+0.36% |
-4.65% |
| Retail |
$RLX |
866.96 |
+7.62 |
+0.89% |
-7.75% |
| Gold & Silver |
$XAU |
88.22 |
-0.55 |
-0.62% |
+4.84% |
| Bank |
$BKX |
68.12 |
+0.19 |
+0.28% |
-1.65% |
| Biotech |
$BTK |
2,548.52 |
-10.68 |
-0.42% |
+9.36% |
|
|
|
 |
Submit Your Request for a Featured Stock Update
Kenneth J. Gruneisen - Passed the CAN SLIM® Master's Exam
Market conditions (the M criteria) are challenging at times. There are few stocks included on the Featured Stocks list and none of the companies need additional review in detail with annotated graphs. At times like these we have an opportunity to look back and review previously featured stocks which were dropped. This can serve as an educational review of the investment system's tactics. It is also a reminder that high-ranked leaders eventually fall out of favor. If you wish to request for a specific stock to receive more detailed coverage in this section please use the inquiry form to submit your request. Thank you! |
|
|
Color Codes Explained :
Y - Better candidates highlighted by our
staff of experts.
G - Previously featured
in past reports as yellow but may no longer be buyable under the
guidelines.
***Last / Change / Volume data in this table is the closing quote data***
Symbol/Exchange
Company Name
Industry Group |
PRICE |
CHANGE
(%Change) |
Day High |
Volume
(% DAV)
(% 50 day avg vol) |
52 Wk Hi
% From Hi |
Featured
Date |
Price
Featured |
Pivot Featured |
|
Max Buy |
AFSI
-
NASDAQ
Amtrust Financial Svcs
INSURANCE - Property and; Casualty Insurance
|
$45.19
|
-1.02
-2.21% |
$46.49
|
1,006,579
181.37% of 50 DAV
50 DAV is 555,000
|
$47.10
-4.06%
|
5/21/2014
|
$44.85
|
PP = $44.85
|
|
MB = $47.09
|
 Most Recent Note - 5/23/2014 12:01:48 PM
Y - Pulling back from its 52-week high today after 5 consecutive gains. Rose from an advanced "3-weeks tight" base with volume-driven gains triggering a technical buy signal. Keep in mind 3 out of 4 stocks move in the direction of the major averages (M criteria). See the latest FSU analysis for more details and annotated graphs.
>>> FEATURED STOCK ARTICLE : Finished Strong With Gain From Advanced Base Pattern - 5/21/2014
View all notes |
Set NEW NOTE alert |
CANSLIM.net Company Profile |
SEC
News |
Chart |
Request a new note
C
A N
S L
I M


|
AL
-
NYSE
Air Lease Corp Cl A
DIVERSIFIED SERVICES - Rental and Leasing Services
|
$38.71
|
+0.03
0.08% |
$38.98
|
937,032
132.16% of 50 DAV
50 DAV is 709,000
|
$40.36
-4.09%
|
5/9/2014
|
$38.27
|
PP = $38.25
|
|
MB = $40.16
|
Most Recent Note - 5/20/2014 6:37:00 PM
Y - Small loss today with higher volume, slumping near its pivot point and prior highs near $38 defining near-term support to watch on pullbacks.
>>> FEATURED STOCK ARTICLE : Volume Heavy Following Gap Up Gain for New 52-Week High - 5/9/2014
View all notes |
Set NEW NOTE alert |
CANSLIM.net Company Profile |
SEC
News |
Chart |
Request a new note
C
A N
S L
I M
|
EQM
-
NYSE
E Q T Midstream Partners
ENERGY - Oil and Gas Pipelines
|
$79.23
|
-0.71
-0.89% |
$80.05
|
141,800
60.86% of 50 DAV
50 DAV is 233,000
|
$80.20
-1.21%
|
12/12/2013
|
$53.17
|
PP = $56.51
|
|
MB = $59.34
|
Most Recent Note - 5/22/2014 9:21:53 PM
G - Higher again today for a new 52-week high with a gain on light volume. Completed a new Public Offering of 10.75 Million common units on 5/01/14. Fundamental concerns remain after 2 consecutive sub par quarters below the +25% minimum earnings guideline. Its 50 DMA line defines near-term support where a violation may trigger a technical sell signal.
>>> FEATURED STOCK ARTICLE : Best Ever Close With Light Volume Gain - 5/16/2014
View all notes |
Set NEW NOTE alert |
CANSLIM.net Company Profile |
SEC
News |
Chart |
Request a new note
C
A N
S L
I M
|
GRFS
-
NASDAQ
Grifols Sa Ads
Medical-Ethical Drugs
|
$41.16
|
-0.43
-1.03% |
$41.82
|
299,326
48.12% of 50 DAV
50 DAV is 622,000
|
$43.50
-5.38%
|
5/15/2014
|
$41.14
|
PP = $43.55
|
|
MB = $45.73
|
Most Recent Note - 5/22/2014 9:23:39 PM
Y - Pulled back again today with lighter. Encountered resistance at prior highs. This Spanish firm from the Medical- Ethical Drugs industry needs subsequent volume-driven gains for new highs to trigger a technical buy signal.
>>> FEATURED STOCK ARTICLE : Perched Within Close Striking Distance of New Highs - 5/15/2014
View all notes |
Set NEW NOTE alert |
CANSLIM.net Company Profile |
SEC
News |
Chart |
Request a new note
C
A N
S L
I M
|
ICON
-
NASDAQ
Iconix Brand Group Inc
CONSUMER NON-DURABLES - Textile - Apparel Footwear
|
$42.46
|
+0.39
0.93% |
$42.60
|
380,227
67.90% of 50 DAV
50 DAV is 560,000
|
$43.34
-2.03%
|
4/30/2014
|
$42.50
|
PP = $42.57
|
|
MB = $44.70
|
Most Recent Note - 5/20/2014 6:41:05 PM
Y - Consolidating above its 50 DMA line. A violation of that short-term average would raise concerns and trigger a technical sell signal. Confirming gains above the pivot point with above average volume could trigger a new (or add-on) technical buy signal. See the latest FSU analysis for more details and new annotated graphs.
>>> FEATURED STOCK ARTICLE : Consolidating Above 50 DMA Line Still Perched Near 52-Week High - 5/20/2014
View all notes |
Set NEW NOTE alert |
CANSLIM.net Company Profile |
SEC
News |
Chart |
Request a new note
C
A N
S L
I M
|
Symbol/Exchange
Company Name
Industry Group |
PRICE |
CHANGE
(%Change) |
Day High |
Volume
(% DAV)
(% 50 day avg vol) |
52 Wk Hi
% From Hi |
Featured
Date |
Price
Featured |
Pivot Featured |
|
Max Buy |
SN
-
NYSE
Sanchez Energy Corp
ENERGY - Independent Oil and Gas
|
$31.37
|
-0.04
-0.13% |
$32.97
|
2,651,998
267.88% of 50 DAV
50 DAV is 990,000
|
$34.50
-9.07%
|
5/22/2014
|
$33.00
|
PP = $31.59
|
|
MB = $33.17
|
Most Recent Note - 5/23/2014 12:23:26 PM
Y - Gapped up today, trading above its pivot point again with volume running at an above average pace. Hit a new 52-week high on the prior session, but encountered distributional pressure and finished near the session low. Highlighted in yellow with pivot point cited based on its 4/22/14 high in the 5/22/14 mid-day report (read here). Reported earnings +46% on +334% sales revenues for the Mar '14 quarter. Quarterly comparisons show strong sales revenues and earnings increases well above the +25% minimum guideline (C criteria). See the latest FSU analysis for more details and annotated graphs.
>>> FEATURED STOCK ARTICLE : Finish Near Low a Sign of Distributional Pressure Following Gap Up and New High - 5/22/2014
View all notes |
Set NEW NOTE alert |
CANSLIM.net Company Profile |
SEC
News |
Chart |
Request a new note
C
A N
S L
I M
|
TRN
-
NYSE
Trinity Industries Inc
TRANSPORTATION - Railroads
|
$85.04
|
+1.64
1.97% |
$85.30
|
1,281,833
99.21% of 50 DAV
50 DAV is 1,292,000
|
$83.84
1.43%
|
4/30/2014
|
$75.57
|
PP = $76.05
|
|
MB = $79.85
|
Most Recent Note - 5/21/2014 12:27:50 PM
G - Holding its ground stubbornly, extended from any sound base. Prior highs in the $75-76 area define near-term support to watch on pullbacks.
>>> FEATURED STOCK ARTICLE : Rose Beyond "Max Buy" Level With 7th Consecutive Gain - 5/12/2014
View all notes |
Set NEW NOTE alert |
CANSLIM.net Company Profile |
SEC
News |
Chart |
Request a new note
C
A N
S L
I M
|
WLK
-
NYSE
Westlake Chemical Corp
CHEMICALS - Specialty Chemicals
|
$77.00
|
+0.42
0.55% |
$77.18
|
430,448
62.47% of 50 DAV
50 DAV is 689,000
|
$77.69
-0.89%
|
4/29/2014
|
$72.79
|
PP = $69.31
|
|
MB = $72.78
|
Most Recent Note - 5/20/2014 6:39:28 PM
G - Hovering near its 52-week high after 3 consecutive gains. Prior highs in the $69 area define near-term support to watch.
>>> FEATURED STOCK ARTICLE : Extended From Base Following Volume Driven Gains - 5/8/2014
View all notes |
Set NEW NOTE alert |
CANSLIM.net Company Profile |
SEC
News |
Chart |
Request a new note
C
A N
S L
I M
|
|
|
|
THESE ARE NOT BUY RECOMMENDATIONS!
Comments contained in the body of this report are technical
opinions only. The material herein has been obtained
from sources believed to be reliable and accurate, however,
its accuracy and completeness cannot be guaranteed.
This site is not an investment advisor, hence it does
not endorse or recommend any securities or other investments.
Any recommendation contained in this report may not
be suitable for all investors and it is not to be deemed
an offer or solicitation on our part with respect to
the purchase or sale of any securities. All trademarks,
service marks and trade names appearing in this report
are the property of their respective owners, and are
likewise used for identification purposes only.
This report is a service available
only to active Paid Premium Members.
You may opt-out of receiving report notifications
at any time. Questions or comments may be submitted
by writing to Premium Membership Services 665 S.E. 10 Street, Suite 201 Deerfield Beach, FL 33441-5634 or by calling 1-800-965-8307
or 954-785-1121.
|
|
|

