You are not logged in.
This means you
CAN ONLY VIEW reports that were published prior to Tuesday, April 15, 2025.
You
MUST UPGRADE YOUR MEMBERSHIP if you want to see any current reports.
AFTER MARKET UPDATE - THURSDAY, MAY 22ND, 2014
Previous After Market Report Next After Market Report >>>
|
|
|
|
DOW |
+10.02 |
16,543.08 |
+0.06% |
|
Volume |
564,796,240 |
-2% |
|
Volume |
1,712,376,480 |
+8% |
|
NASDAQ |
+22.80 |
4,154.34 |
+0.55% |
|
Advancers |
1,983 |
63% |
|
Advancers |
1,838 |
66% |
|
S&P 500 |
+4.46 |
1,892.49 |
+0.24% |
|
Decliners |
1,073 |
34% |
|
Decliners |
848 |
30% |
|
Russell 2000 |
+10.24 |
1,113.87 |
+0.93% |
|
52 Wk Highs |
118 |
|
|
52 Wk Highs |
60 |
|
|
S&P 600 |
+5.31 |
643.47 |
+0.83% |
|
52 Wk Lows |
16 |
|
|
52 Wk Lows |
42 |
|
|
 |
Nasdaq Composite Index Rebounded Above 50-Day Moving Average Line
Kenneth J. Gruneisen - Passed the CAN SLIM® Master's Exam
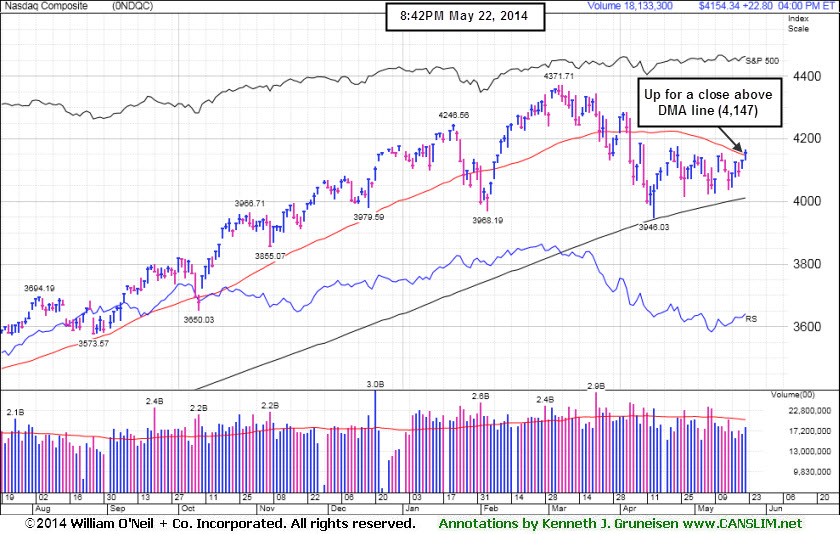
On Thursday the major averages ended modestly higher. The volume was reported mixed, lighter than the prior session total on the NYSE and higher on the Nasdaq exchange. Breadth was positive as advancers led decliners by nearly a 2-1 margin on the NYSE and more than 2-1 on the Nasdaq exchange. Leadership improved as there were 39 high-ranked companies from the CANSLIM.net Leaders List that made new 52-week highs and appeared on the CANSLIM.net BreakOuts Page, up from the total of 25 stocks on the prior session. New 52-week highs outnumbered new 52-week lows on the NYSE and on the Nasdaq exchange. There were gains for 6 of the 8 high-ranked companies currently included on the Featured Stocks Page. It was recently noted that the Dow Jones Industrial Average and S&P 500 Index both tallied gains into new high territory. Technically that is favorable, however, uncertain market action overall has led the newspaper to still hold off from officially shifting its view that the market direction (M criteria) is back in a "confirmed uptrend". While awaiting a more definitive read on the market any new buying efforts should be very selective and only focused in stocks meeting all key criteria of the fact-based investment system. Keep in mind that any sustained and meaningful market advance requires leadership - a healthy crop of stocks hitting new 52-week highs.
The major averages were up for a second day as investors received generally positive economic readings. Stocks advanced as preliminary reports suggested manufacturing activity improved in both the U.S. and China. A separate release showed sales of existing U.S. homes increased +1.3%, suggesting the real estate market is improving with the weather. Weekly jobless claims were a modest disappointment. First time filings for unemployment benefits climbed to 326,000, above the consensus estimate of 310,000.
Investors also spent the session weighing earnings releases by retailers. Williams-Sonoma (WSM +8.16%) and Dollar Tree (DLTR +6.62%) jumped as their quarterly profits topped analyst projections. Sears Holdings (SHLD +4.21%) rose despite posting a wider-than-expected loss. Over in tech, Hewlett-Packard (HPQ -2.28%) fell after its quarterly results were unexpectedly released before the close.
Eight of 10 sectors in the S&P 500 were up and utilities were the best performing group as Dominion Resources (D +1.25%) rose. Energy was down the most with Exxon (XOM -0.52%) slipping.
Treasuries were down on the session. The 10-year note fell 4/32 to yield 2.55%.
The CANSLIM.net Featured Stocks Page shows the most action-worthy candidates and their latest notes and a Headline Link directs members to the latest detailed analysis with data-packed graphs annotated by a Certified expert along with links to additional resources. The Premium Member Homepage includes "dynamic archives" to all prior pay reports published. Watch for an announcement via email concerning the next WEBCAST.
PICTURED: The Nasdaq Composite Index's gain of 22 points on Thursday helped it rebound and close above its 50-day moving average (DMA) line (4,147) for the first time since April 3, 2014. Subsequent deterioration below the 200 DMA line or prior lows would be an ominous sign which would not bode well for the market outlook.
|
 Kenneth J. Gruneisen started out as a licensed stockbroker in August 1987, a couple of months prior to the historic stock market crash that took the Dow Jones Industrial Average down -22.6% in a single day. He has published daily fact-based fundamental and technical analysis on high-ranked stocks online for two decades. Through FACTBASEDINVESTING.COM, Kenneth provides educational articles, news, market commentary, and other information regarding proven investment systems that work in good times and bad.
Comments contained in the body of this report are technical opinions only and are not necessarily those of Gruneisen Growth Corp. The material herein has been obtained from sources believed to be reliable and accurate, however, its accuracy and completeness cannot be guaranteed. Our firm, employees, and customers may effect transactions, including transactions contrary to any recommendation herein, or have positions in the securities mentioned herein or options with respect thereto. Any recommendation contained in this report may not be suitable for all investors and it is not to be deemed an offer or solicitation on our part with respect to the purchase or sale of any securities. |
|
 |
Financial, Retail, Tech and Energy Groups Rose
Kenneth J. Gruneisen - Passed the CAN SLIM® Master's Exam
Financial shares were a positive influence on the major averages on Thursday as the Broker/Dealer Index ($XBD +1.04%) outpaced the Bank Index ($BKX +0.41%). The Retail Index ($RLX +0.52%) and tech sector gains also helped as the Biotechnology Index ($BTK +1.49%), Semiconductor Index ($SOX +0.43%), and the Networking Index ($NWX +0.57%) posted unanimous gains. Energy-related shares also drifted higher as the Integrated Oil Index ($XOI +0.19%) and Oil Services Index ($OSX +0.39%) posted small gains while the Gold & Silver Index ($XAU +0.08%) finished flat.
Charts courtesy www.stockcharts.com
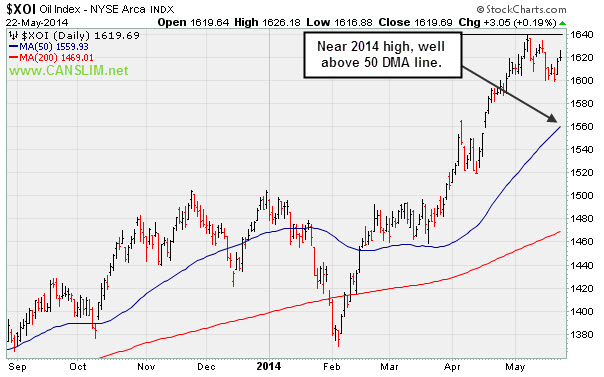
PICTURED: The Integrated Oil Index ($XOI +0.19%) is perched hear its 2014 high, consolidating well above its 50-day moving average (DMA) line.
| Oil Services |
$OSX |
287.36 |
+1.11 |
+0.39% |
+2.25% |
| Integrated Oil |
$XOI |
1,619.69 |
+3.05 |
+0.19% |
+7.75% |
| Semiconductor |
$SOX |
584.30 |
+2.49 |
+0.43% |
+9.21% |
| Networking |
$NWX |
333.14 |
+1.87 |
+0.57% |
+2.84% |
| Broker/Dealer |
$XBD |
152.54 |
+1.57 |
+1.04% |
-4.99% |
| Retail |
$RLX |
859.34 |
+4.45 |
+0.52% |
-8.56% |
| Gold & Silver |
$XAU |
88.77 |
+0.07 |
+0.08% |
+5.49% |
| Bank |
$BKX |
67.93 |
+0.28 |
+0.41% |
-1.92% |
| Biotech |
$BTK |
2,559.20 |
+37.62 |
+1.49% |
+9.82% |
|
|
|
 |
Finish Near Low a Sign of Distributional Pressure Following Gap Up and New High
Kenneth J. Gruneisen - Passed the CAN SLIM® Master's Exam
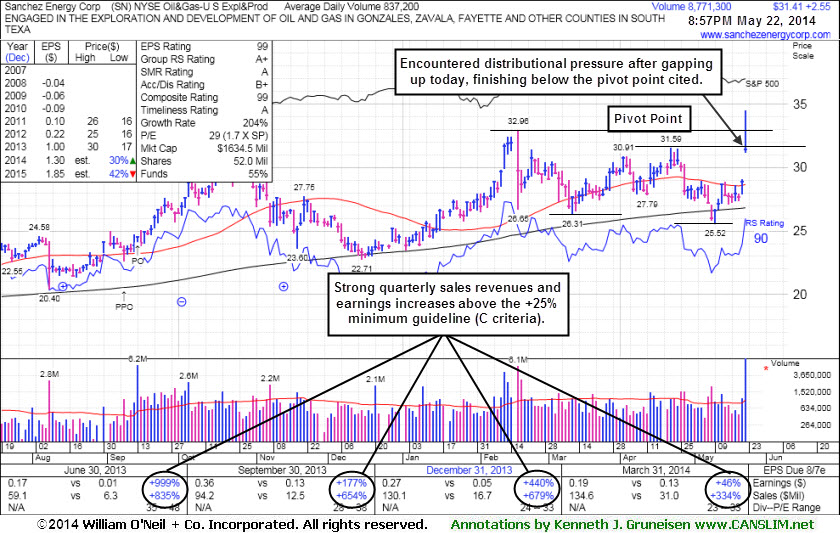
Sanchez Energy Corp (SN +$2.55 or +8.84% to $31.41) was highlighted in yellow with pivot point cited based on its 4/22/14 high in the earlier mid-day report (read here). It gapped up today and hit a new 52-week high, but it encountered distributional pressure near prior highs and finished near the session low, rather than convincingly rallying from a "double bottom" base. Confirming volume-driven gains into new high territory would be a welcome reassurance to watch for, as disciplined investors may watch for it to clinch a proper technical buy signal. Keep in mind 3 out of 4 stocks move in the direction of the major averages (M criteria). Confirming gains from the broader market averages coupled with an expansion in leadership (stocks hitting new 52-week highs) would be a welcome reassurance that the market has established a meaningful rally.
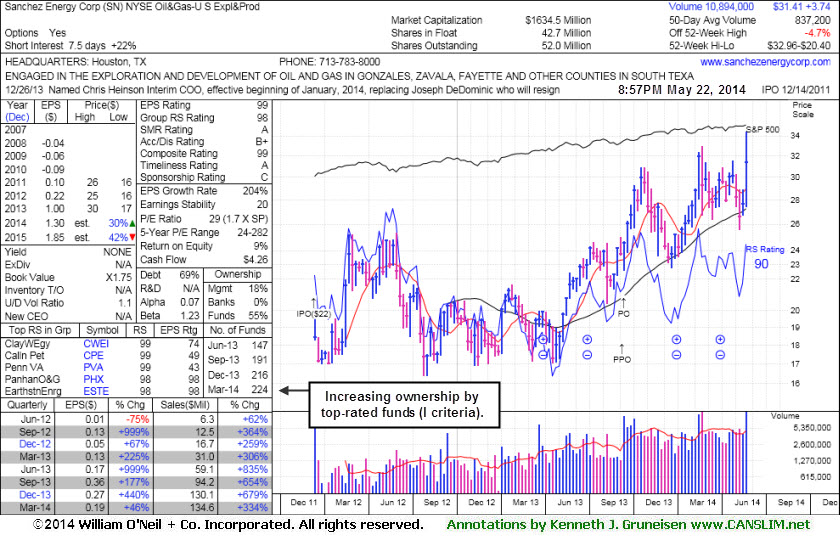
It reported earnings +46% on +334% sales revenues for the Mar '14 quarter. Quarterly comparisons show strong sales revenues and earnings increases well above the +25% minimum guideline (C criteria). Annual earnings (A criteria) history showed losses in the years prior to its IPO in Dec '11, yet it has done well in the earnings department since and earned the highest possible Earnings Per Share Rating of 99. The number of top-rated funds owning its shares rose from 147 in Jun '13 to 224 in Mar '14, a reassuring sign concerning the I criteria.
|
|
|
Color Codes Explained :
Y - Better candidates highlighted by our
staff of experts.
G - Previously featured
in past reports as yellow but may no longer be buyable under the
guidelines.
***Last / Change / Volume data in this table is the closing quote data***
Symbol/Exchange
Company Name
Industry Group |
PRICE |
CHANGE
(%Change) |
Day High |
Volume
(% DAV)
(% 50 day avg vol) |
52 Wk Hi
% From Hi |
Featured
Date |
Price
Featured |
Pivot Featured |
|
Max Buy |
AFSI
-
NASDAQ
Amtrust Financial Svcs
INSURANCE - Property and; Casualty Insurance
|
$46.21
|
+0.51
1.12% |
$47.10
|
1,499,641
280.83% of 50 DAV
50 DAV is 534,000
|
$45.83
0.83%
|
5/21/2014
|
$44.85
|
PP = $44.85
|
|
MB = $47.09
|
 Most Recent Note - 5/22/2014 12:07:49 PM
Y - Hitting another new 52-week high with above average volume behind today's 5th consecutive gain. Rose from an advanced "3-weeks tight" base with +112% above average volume on the prior session triggering a technical buy signal. Keep in mind 3 out of 4 stocks move in the direction of the major averages (M criteria). See the latest FSU analysis for more details and annotated graphs.
>>> FEATURED STOCK ARTICLE : Finished Strong With Gain From Advanced Base Pattern - 5/21/2014
View all notes |
Set NEW NOTE alert |
CANSLIM.net Company Profile |
SEC
News |
Chart |
Request a new note
C
A N
S L
I M


|
AL
-
NYSE
Air Lease Corp Cl A
DIVERSIFIED SERVICES - Rental and Leasing Services
|
$38.68
|
+0.41
1.07% |
$38.92
|
719,634
102.08% of 50 DAV
50 DAV is 705,000
|
$40.36
-4.16%
|
5/9/2014
|
$38.27
|
PP = $38.25
|
|
MB = $40.16
|
Most Recent Note - 5/20/2014 6:37:00 PM
Y - Small loss today with higher volume, slumping near its pivot point and prior highs near $38 defining near-term support to watch on pullbacks.
>>> FEATURED STOCK ARTICLE : Volume Heavy Following Gap Up Gain for New 52-Week High - 5/9/2014
View all notes |
Set NEW NOTE alert |
CANSLIM.net Company Profile |
SEC
News |
Chart |
Request a new note
C
A N
S L
I M
|
EQM
-
NYSE
E Q T Midstream Partners
ENERGY - Oil and Gas Pipelines
|
$79.94
|
+1.14
1.45% |
$80.20
|
116,174
50.08% of 50 DAV
50 DAV is 232,000
|
$79.28
0.83%
|
12/12/2013
|
$53.17
|
PP = $56.51
|
|
MB = $59.34
|
Most Recent Note - 5/22/2014 9:21:53 PM
G - Higher again today for a new 52-week high with a gain on light volume. Completed a new Public Offering of 10.75 Million common units on 5/01/14. Fundamental concerns remain after 2 consecutive sub par quarters below the +25% minimum earnings guideline. Its 50 DMA line defines near-term support where a violation may trigger a technical sell signal.
>>> FEATURED STOCK ARTICLE : Best Ever Close With Light Volume Gain - 5/16/2014
View all notes |
Set NEW NOTE alert |
CANSLIM.net Company Profile |
SEC
News |
Chart |
Request a new note
C
A N
S L
I M
|
GRFS
-
NASDAQ
Grifols Sa Ads
Medical-Ethical Drugs
|
$41.57
|
-0.71
-1.68% |
$42.11
|
250,993
40.48% of 50 DAV
50 DAV is 620,000
|
$43.50
-4.44%
|
5/15/2014
|
$41.14
|
PP = $43.55
|
|
MB = $45.73
|
Most Recent Note - 5/22/2014 9:23:39 PM
Y - Pulled back again today with lighter. Encountered resistance at prior highs. This Spanish firm from the Medical- Ethical Drugs industry needs subsequent volume-driven gains for new highs to trigger a technical buy signal.
>>> FEATURED STOCK ARTICLE : Perched Within Close Striking Distance of New Highs - 5/15/2014
View all notes |
Set NEW NOTE alert |
CANSLIM.net Company Profile |
SEC
News |
Chart |
Request a new note
C
A N
S L
I M
|
ICON
-
NASDAQ
Iconix Brand Group Inc
CONSUMER NON-DURABLES - Textile - Apparel Footwear
|
$42.06
|
+0.53
1.28% |
$42.24
|
334,747
59.78% of 50 DAV
50 DAV is 560,000
|
$43.34
-2.95%
|
4/30/2014
|
$42.50
|
PP = $42.57
|
|
MB = $44.70
|
Most Recent Note - 5/20/2014 6:41:05 PM
Y - Consolidating above its 50 DMA line. A violation of that short-term average would raise concerns and trigger a technical sell signal. Confirming gains above the pivot point with above average volume could trigger a new (or add-on) technical buy signal. See the latest FSU analysis for more details and new annotated graphs.
>>> FEATURED STOCK ARTICLE : Consolidating Above 50 DMA Line Still Perched Near 52-Week High - 5/20/2014
View all notes |
Set NEW NOTE alert |
CANSLIM.net Company Profile |
SEC
News |
Chart |
Request a new note
C
A N
S L
I M
|
Symbol/Exchange
Company Name
Industry Group |
PRICE |
CHANGE
(%Change) |
Day High |
Volume
(% DAV)
(% 50 day avg vol) |
52 Wk Hi
% From Hi |
Featured
Date |
Price
Featured |
Pivot Featured |
|
Max Buy |
SN
-
NYSE
Sanchez Energy Corp
ENERGY - Independent Oil and Gas
|
$31.41
|
+2.55
8.84% |
$34.50
|
8,771,261
1,047.94% of 50 DAV
50 DAV is 837,000
|
$32.96
-4.70%
|
5/22/2014
|
$33.00
|
PP = $31.59
|
|
MB = $33.17
|
Most Recent Note - 5/22/2014 9:20:03 PM
Y - Gapped up and hit a new 52-week high, but encountered distributional pressure and finished near session low after highlighted in yellow with pivot point cited based on its 4/22/14 high in the earlier mid-day report (read here). Reported earnings +46% on +334% sales revenues for the Mar '14 quarter. Quarterly comparisons show strong sales revenues and earnings increases well above the +25% minimum guideline (C criteria). See the latest FSU analysis for more details and new annotated graphs.
>>> FEATURED STOCK ARTICLE : Finish Near Low a Sign of Distributional Pressure Following Gap Up and New High - 5/22/2014
View all notes |
Set NEW NOTE alert |
CANSLIM.net Company Profile |
SEC
News |
Chart |
Request a new note
C
A N
S L
I M
|
TRN
-
NYSE
Trinity Industries Inc
TRANSPORTATION - Railroads
|
$83.40
|
+1.20
1.46% |
$83.84
|
1,197,731
92.92% of 50 DAV
50 DAV is 1,289,000
|
$82.85
0.66%
|
4/30/2014
|
$75.57
|
PP = $76.05
|
|
MB = $79.85
|
Most Recent Note - 5/21/2014 12:27:50 PM
G - Holding its ground stubbornly, extended from any sound base. Prior highs in the $75-76 area define near-term support to watch on pullbacks.
>>> FEATURED STOCK ARTICLE : Rose Beyond "Max Buy" Level With 7th Consecutive Gain - 5/12/2014
View all notes |
Set NEW NOTE alert |
CANSLIM.net Company Profile |
SEC
News |
Chart |
Request a new note
C
A N
S L
I M
|
WLK
-
NYSE
Westlake Chemical Corp
CHEMICALS - Specialty Chemicals
|
$76.58
|
-0.32
-0.42% |
$77.33
|
496,127
71.59% of 50 DAV
50 DAV is 693,000
|
$77.69
-1.43%
|
4/29/2014
|
$72.79
|
PP = $69.31
|
|
MB = $72.78
|
Most Recent Note - 5/20/2014 6:39:28 PM
G - Hovering near its 52-week high after 3 consecutive gains. Prior highs in the $69 area define near-term support to watch.
>>> FEATURED STOCK ARTICLE : Extended From Base Following Volume Driven Gains - 5/8/2014
View all notes |
Set NEW NOTE alert |
CANSLIM.net Company Profile |
SEC
News |
Chart |
Request a new note
C
A N
S L
I M
|
|
|
|
THESE ARE NOT BUY RECOMMENDATIONS!
Comments contained in the body of this report are technical
opinions only. The material herein has been obtained
from sources believed to be reliable and accurate, however,
its accuracy and completeness cannot be guaranteed.
This site is not an investment advisor, hence it does
not endorse or recommend any securities or other investments.
Any recommendation contained in this report may not
be suitable for all investors and it is not to be deemed
an offer or solicitation on our part with respect to
the purchase or sale of any securities. All trademarks,
service marks and trade names appearing in this report
are the property of their respective owners, and are
likewise used for identification purposes only.
This report is a service available
only to active Paid Premium Members.
You may opt-out of receiving report notifications
at any time. Questions or comments may be submitted
by writing to Premium Membership Services 665 S.E. 10 Street, Suite 201 Deerfield Beach, FL 33441-5634 or by calling 1-800-965-8307
or 954-785-1121.
|
|
|

