You are not logged in.
This means you
CAN ONLY VIEW reports that were published prior to Monday, April 14, 2025.
You
MUST UPGRADE YOUR MEMBERSHIP if you want to see any current reports.
AFTER MARKET UPDATE - THURSDAY, MAY 23RD, 2013
Previous After Market Report Next After Market Report >>>
|
|
|
|
DOW |
-12.67 |
15,294.50 |
-0.08% |
|
Volume |
848,439,230 |
-1% |
|
Volume |
1,741,109,710 |
-18% |
|
NASDAQ |
-3.88 |
3,459.42 |
-0.11% |
|
Advancers |
1,251 |
40% |
|
Advancers |
1,294 |
50% |
|
S&P 500 |
-4.84 |
1,650.51 |
-0.29% |
|
Decliners |
1,753 |
56% |
|
Decliners |
1,200 |
46% |
|
Russell 2000 |
+2.03 |
984.28 |
+0.21% |
|
52 Wk Highs |
41 |
|
|
52 Wk Highs |
44 |
|
|
S&P 600 |
-0.45 |
553.17 |
-0.08% |
|
52 Wk Lows |
33 |
|
|
52 Wk Lows |
26 |
|
|
 |
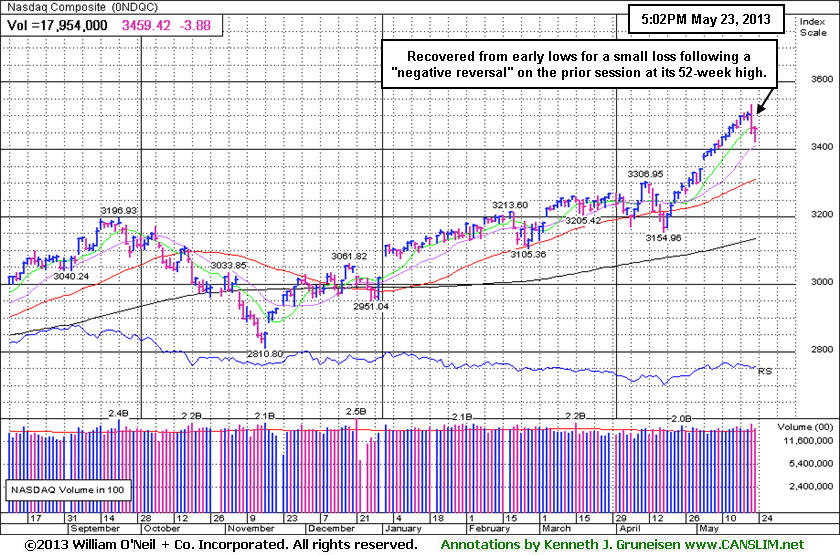
Major Averages Recovered Off Lows to Quietly End With Small Losses
Kenneth J. Gruneisen - Passed the CAN SLIM® Master's Exam
On Thursday the major averages recovered from deeper early losses to finish with small losses while finishing the day near the best levels of the session. The volume totals were reported lighter than the prior session totals on the Nasdaq exchange and on the NYSE, indicating less selling coming from the institutional crowd. Breadth was negative as decliners led advancers by about a 3-2 margin on the NYSE, however advancers narrowly led decliners on the Nasdaq exchange. There were only 10 high-ranked companies from the CANSLIM.net Leaders List making new 52-week highs and appearing on the CANSLIM.net BreakOuts Page, down abruptly from the prior session total of 85 stocks. The new 52-week highs totals abruptly contracted yet new highs still outnumbered new 52-week lows on both the NYSE and the Nasdaq exchange. There were gains for 8 of the 14 high-ranked companies currently included on the Featured Stocks Page.
Positive economic reports helped investors overlook concerns that the Federal Reserve could be considering reducing the current level of bond purchases. Looking at the data, weekly jobless claims, May manufacturing data and April new home sales came in ahead of expectations.
On the earnings front, Hewlett-Packard Co (HPQ +17.10%) rallied after the company topped analysts' estimates in the quarter and boosted their full year guidance. On the downside, L Brands Inc (LTD -0.54%) and Hormel Foods Corp (HRL -2.69%) fell following their profit tallies.
Turning to fixed income markets, Treasuries were higher along the curve. The benchmark 10-year note was up 1/4 of a point to yield 2.02% and the 30-year bond advanced 5/8 to yield 3.19%.
The market (M criteria) uptrend has lifted the Dow Jones Industrial Average and the S&P 500 Index to new record highs. The indices' rally to new highs confirmed the market's uptrend which means odds are favorable for new buying efforts in stocks meeting all of the fact-based investment system's key criteria. Action-worthy leaders best matching the winning models are covered on an ongoing basis on the Featured Stocks Page - including our Certified experts' latest notes and links to additional resources including detailed analysis with annotated graphs.
The Premium Member Homepage - includes "dynamic archives" to all prior pay reports published. Watch for an announcement via email concerning the next WEBCAST.
PICTURED: The Nasdaq Composite Index recovered from early lows for a small loss following a "negative reversal" with higher volume on the prior session at its 52-week high.
|
 Kenneth J. Gruneisen started out as a licensed stockbroker in August 1987, a couple of months prior to the historic stock market crash that took the Dow Jones Industrial Average down -22.6% in a single day. He has published daily fact-based fundamental and technical analysis on high-ranked stocks online for two decades. Through FACTBASEDINVESTING.COM, Kenneth provides educational articles, news, market commentary, and other information regarding proven investment systems that work in good times and bad.
Comments contained in the body of this report are technical opinions only and are not necessarily those of Gruneisen Growth Corp. The material herein has been obtained from sources believed to be reliable and accurate, however, its accuracy and completeness cannot be guaranteed. Our firm, employees, and customers may effect transactions, including transactions contrary to any recommendation herein, or have positions in the securities mentioned herein or options with respect thereto. Any recommendation contained in this report may not be suitable for all investors and it is not to be deemed an offer or solicitation on our part with respect to the purchase or sale of any securities. |
|
 |
Medical-Related and Defensive Group Gains Offset by Other Weakness
Kenneth J. Gruneisen - Passed the CAN SLIM® Master's Exam
The Biotechnology Index ($BTK +0.46%) and the Healthcare Index ($HMO +0.83%) posted healthy gains and the Gold & Silver Index ($XAU +0.54%) also edged higher. Meanwhile, financial shares' weakness weighed on the major averages as the Broker/Dealer Index ($XBD -1.11%) and the Bank Index ($BKX -0.39%) finished lower on Thursday. The Retail Index ($RLX -0.08%) and the Semiconductor Index ($SOX +0.03%) ended the session virtually unchanged while the Networking Index ($NWX -0.58%) and the Internet Index ($IIX -0.19%) edged lower. Energy-related shares were slightly down as the Oil Services Index ($OSX -0.32%) edged lower and the Integrated Oil Index ($XOI -0.04%) finished flat.
Charts courtesy www.stockcharts.com
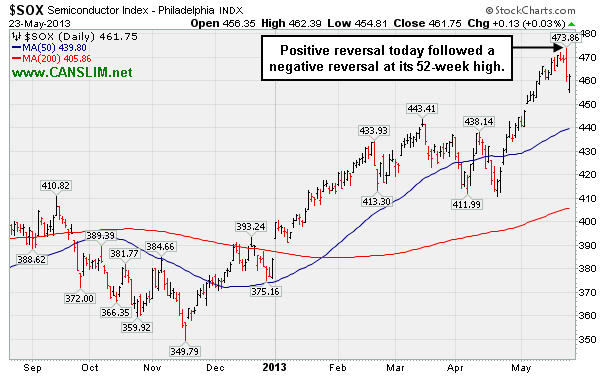
PICTURED: The Semiconductor Index ($SOX +0.03%) managed a positive reversal on Thursday following a negative reversal on the prior session after touching a new 52-week high.
| Oil Services |
$OSX |
259.77 |
-0.84 |
-0.32% |
+17.99% |
| Healthcare |
$HMO |
3,110.55 |
+25.71 |
+0.83% |
+23.72% |
| Integrated Oil |
$XOI |
1,400.02 |
-0.53 |
-0.04% |
+12.74% |
| Semiconductor |
$SOX |
461.75 |
+0.13 |
+0.03% |
+20.23% |
| Networking |
$NWX |
237.39 |
-1.39 |
-0.58% |
+4.78% |
| Internet |
$IIX |
380.29 |
-0.74 |
-0.19% |
+16.30% |
| Broker/Dealer |
$XBD |
121.80 |
-1.36 |
-1.11% |
+29.12% |
| Retail |
$RLX |
789.78 |
-0.61 |
-0.08% |
+20.94% |
| Gold & Silver |
$XAU |
101.85 |
+0.55 |
+0.54% |
-38.50% |
| Bank |
$BKX |
60.68 |
-0.24 |
-0.39% |
+18.33% |
| Biotech |
$BTK |
1,993.06 |
+9.20 |
+0.46% |
+28.83% |
|
|
|
 |
Shares Did Not Flash Signs of Sufficient Buying Demand for Action Before Latest Slump
Kenneth J. Gruneisen - Passed the CAN SLIM® Master's Exam
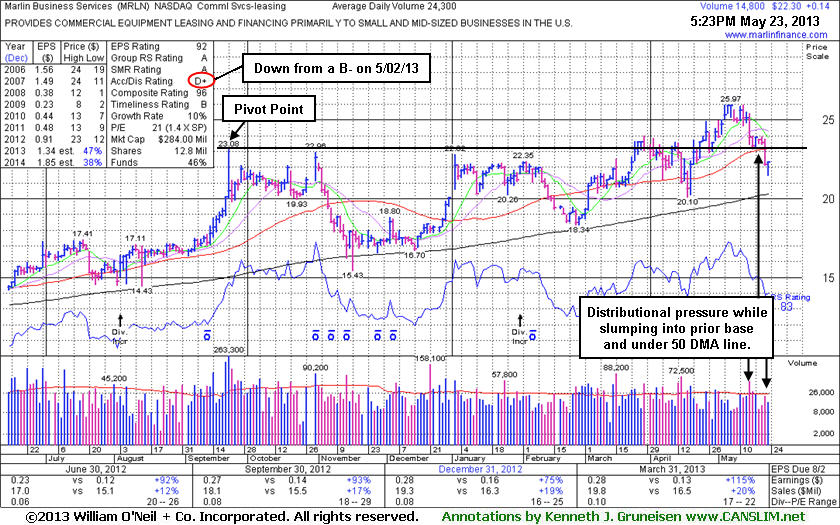
Marlin Business Services (MRLN +$0.14 or +0.63% to $22.30) posted a gain today on light volume. It recently slumped below prior highs in the $23 area and fell back into its prior base raising concerns with losses on higher volume indicating distributional pressure. Its current Up/Down Volume Ratio of 0.8 is also an unbiased bullish indication that its shares have been under distributional pressure over the past 50 days. On the prior session it also violated its 50-day moving average (DMA) line, an important technical threshold for chart readers, triggering worrisome technical sell signals. Only a prompt rebound above its 50 DMA line would help its outlook improve.
Its Accumulation/Distribution Rating has slumped to a D+ from a B- when MRLN was last seen in this FSU section on 5/02/13 with an annotated graph under the headline, "Daily and Weekly Graphs Illustrate Wedging Action". Annotated daily and weekly graphs illustrated the "wedging" action as it advanced into new high territory. As it rallied for its best close of 2013 members were cautioned that it came with a gain - "Backed by very light volume of only 17,000 shares, only 64% of its average (26,600) daily volume total. Comparing the session's lighter-than-average total to the higher-than-average volume totals seen while it was enduring distributional pressure and briefly undercut its 50-day moving average (DMA) line in recent weeks, it remains clear that the price/volume action has not been indicative of especially great new institutional buying demand. One still questions its ability to fight for meaningful and sustained gains into new high territory when it is free to rally with no resistance remaining due to overhead supply and market conditions (the M criteria) are good."
Members were also previously reminded - "Disciplined investors know that there is no advantage to getting in "early" before a technical breakout proves that fresh institutional buying demand is lurking. Watch for for it to make a stand and produce subsequent volume-driven gains for new high (N criteria) above the pivot point to trigger a technical buy signal before action may be justified under the fact-based investment system."
Recent quarterly comparisons through Mar '13 show strong earnings increases above the +25% minimum guideline satisfying the C criteria. Annual earnings (A criteria) growth has improved following the downturn in FY '08 and '09. The Commercial Services - Leasing group has a high 84 Group Relative Strength Rating, a good sign concerning the L criteria. With only 9.18 million shares (S criteria) in the publicly traded float it may be particularly volatile in the event of any institutional buying or selling. The number of top-rated funds owning its shares rose from 111 in Mar '12 to 136 in Mar '13, a reassuring sign concerning the I criteria.
Regardless of any stock's favorable characteristics, disciplined investors always limit losses by selling if the stock falls more than -7% from their purchase price. In this case, taking a small loss might not be necessary if investors heeded the cautionary notes warning that a proper technical buy signal had not occurred in this ideal-looking leader.
|
|
|
Color Codes Explained :
Y - Better candidates highlighted by our
staff of experts.
G - Previously featured
in past reports as yellow but may no longer be buyable under the
guidelines.
***Last / Change / Volume data in this table is the closing quote data***
Symbol/Exchange
Company Name
Industry Group |
PRICE |
CHANGE
(%Change) |
Day High |
Volume
(% DAV)
(% 50 day avg vol) |
52 Wk Hi
% From Hi |
Featured
Date |
Price
Featured |
Pivot Featured |
|
Max Buy |
AL
-
NYSE
Air Lease Corp Cl A
DIVERSIFIED SERVICES - Rental and Leasing Services
|
$28.80
|
-0.64
-2.17% |
$29.02
|
651,034
140.34% of 50 DAV
50 DAV is 463,900
|
$31.00
-7.10%
|
5/9/2013
|
$30.95
|
PP = $29.38
|
|
MB = $30.85
|
 Most Recent Note - 5/23/2013 4:21:00 PM
Y - Gapped down today and tested support at its 50 DMA line with a loss on above average volume, slumping back below its pivot point.
>>> The latest Featured Stock Update with an annotated graph appeared on 5/9/2013. Click here.
View all notes |
Alert me of new notes |
CANSLIM.net Company Profile |
SEC |
Zacks Reports |
StockTalk |
News |
Chart |
Request a new note
C
A N
S L
I M


|
AMBA
-
NASDAQ
Ambarella Inc
ELECTRONICS - Semiconductor - Specialized
|
$16.19
|
+0.47
2.99% |
$16.68
|
1,526,199
216.79% of 50 DAV
50 DAV is 704,000
|
$17.90
-9.55%
|
5/6/2013
|
$15.31
|
PP = $16.10
|
|
MB = $16.91
|
Most Recent Note - 5/23/2013 3:28:37 PM
Y - Wider than usual intra-day price swings of late are signs of uncertainty that may not bode well, however, it has managed a "positive reversal" after gapping down today, finding prompt support after dipping back into its prior base. Subsequent losses leading to a close below its old high close ($15.66 on 3/28/13) would raise more serious concerns by completely negating its recent breakout.
>>> The latest Featured Stock Update with an annotated graph appeared on 5/6/2013. Click here.
View all notes |
Alert me of new notes |
CANSLIM.net Company Profile |
SEC |
Zacks Reports |
StockTalk |
News |
Chart |
Request a new note
C
A N
S L
I M
|
CELG
-
NASDAQ
Celgene Corp
DRUGS - Drug Manufacturers - Major
|
$123.64
|
+0.20
0.16% |
$124.97
|
2,364,974
75.81% of 50 DAV
50 DAV is 3,119,600
|
$131.82
-6.20%
|
3/27/2013
|
$113.24
|
PP = $115.54
|
|
MB = $121.32
|
Most Recent Note - 5/23/2013 3:33:59 PM
G - Holding its ground above its 50 DMA line after encountering distributional pressure. A violation of its 50 DMA line (now $119.60) would raise concerns and trigger a technical sell signal. It is extended from any sound base pattern, yet may go on to produce more climactic gains.
>>> The latest Featured Stock Update with an annotated graph appeared on 5/13/2013. Click here.
View all notes |
Alert me of new notes |
CANSLIM.net Company Profile |
SEC |
Zacks Reports |
StockTalk |
News |
Chart |
Request a new note
C
A N
S L
I M
|
EQM
-
NYSE
E Q T Midstream Partners
ENERGY - Oil and Gas Pipelines
|
$50.00
|
+0.24
0.48% |
$50.79
|
54,344
62.68% of 50 DAV
50 DAV is 86,700
|
$50.52
-1.03%
|
4/25/2013
|
$40.16
|
PP = $40.84
|
|
MB = $42.88
|
Most Recent Note - 5/20/2013 12:15:54 PM
G - Churning heavy volume today while still stubbornly holding its ground near its all-time high, extended from its latest base. Prior highs coincide with its 50 DMA line defining important near-term chart support to watch in the $41 area.
>>> The latest Featured Stock Update with an annotated graph appeared on 5/16/2013. Click here.
View all notes |
Alert me of new notes |
CANSLIM.net Company Profile |
SEC |
Zacks Reports |
StockTalk |
News |
Chart |
Request a new note
C
A N
S L
I M
|
FLT
-
NYSE
Fleetcor Technologies
DIVERSIFIED SERVICES - Business/Management Services
|
$82.06
|
+0.22
0.27% |
$82.97
|
541,570
59.66% of 50 DAV
50 DAV is 907,700
|
$85.56
-4.09%
|
3/21/2013
|
$71.14
|
PP = $73.00
|
|
MB = $76.65
|
Most Recent Note - 5/22/2013 1:55:11 PM
G - Still stubbornly holding its ground near its all-time high, extended from any sound base pattern. Its 50 DMA line and recent low ($70.09) define near-term support where violations would raise more serious concerns and trigger worrisome technical sell signals.
>>> The latest Featured Stock Update with an annotated graph appeared on 5/8/2013. Click here.
View all notes |
Alert me of new notes |
CANSLIM.net Company Profile |
SEC |
Zacks Reports |
StockTalk |
News |
Chart |
Request a new note
C
A N
S L
I M
|
Symbol/Exchange
Company Name
Industry Group |
PRICE |
CHANGE
(%Change) |
Day High |
Volume
(% DAV)
(% 50 day avg vol) |
52 Wk Hi
% From Hi |
Featured
Date |
Price
Featured |
Pivot Featured |
|
Max Buy |
LNKD
-
NYSE
Linkedin Corp Class A
INTERNET - Internet Information Providers
|
$176.33
|
-0.62
-0.35% |
$177.98
|
1,806,633
76.39% of 50 DAV
50 DAV is 2,364,900
|
$202.91
-13.10%
|
4/12/2013
|
$182.69
|
PP = $184.25
|
|
MB = $193.46
|
Most Recent Note - 5/22/2013 5:49:47 PM
G - Loss today with higher but near average volume led to a close just below its 50 DMA line raising concerns and its color code is changed to green. Recent lows in the $171 area define important near-term support above the 4/03/13 low ($165), levels where subsequent violations may raise greater concerns and trigger more worrisome technical sell signals.
>>> The latest Featured Stock Update with an annotated graph appeared on 5/21/2013. Click here.
View all notes |
Alert me of new notes |
CANSLIM.net Company Profile |
SEC |
Zacks Reports |
StockTalk |
News |
Chart |
Request a new note
C
A N
S L
I M
|
LOPE
-
NASDAQ
Grand Canyon Education
DIVERSIFIED SERVICES - Education and; Training Services
|
$32.67
|
-0.18
-0.55% |
$32.72
|
469,016
119.13% of 50 DAV
50 DAV is 393,700
|
$34.07
-4.11%
|
5/10/2013
|
$29.03
|
PP = $27.28
|
|
MB = $28.64
|
Most Recent Note - 5/22/2013 12:37:56 PM
G - Adding to its spurt of volume-driven gains with today's 7th consecutive gain, getting very extended from prior highs. Gains of greater than +20% in the first 2-3 weeks following its "breakaway gap" suggest holding for a minimum of 8 week under the fact-based investment system's rules. Prior highs in the $27 area define initial support to watch on pullbacks.
>>> The latest Featured Stock Update with an annotated graph appeared on 5/10/2013. Click here.
View all notes |
Alert me of new notes |
CANSLIM.net Company Profile |
SEC |
Zacks Reports |
StockTalk |
News |
Chart |
Request a new note
C
A N
S L
I M
|
MRLN
-
NASDAQ
Marlin Business Services
DIVERSIFIED SERVICES - Rental and Leasing Services
|
$22.30
|
+0.14
0.63% |
$22.31
|
14,801
60.91% of 50 DAV
50 DAV is 24,300
|
$25.97
-14.13%
|
3/15/2013
|
$22.29
|
PP = $23.18
|
|
MB = $24.34
|
Most Recent Note - 5/23/2013 5:54:33 PM
G - Managed a "positive reversal" for a gain today on lighter volume. Only a prompt rebound above its 50 DMA line (now $23.11) would help its outlook improve. See the latest FSU analysis for more details and a new annotated graph.
>>> The latest Featured Stock Update with an annotated graph appeared on 5/23/2013. Click here.
View all notes |
Alert me of new notes |
CANSLIM.net Company Profile |
SEC |
Zacks Reports |
StockTalk |
News |
Chart |
Request a new note
C
A N
S L
I M
|
N
-
NYSE
Netsuite Inc
DIVERSIFIED SERVICES - Business/Management Services
|
$89.69
|
+0.53
0.59% |
$90.31
|
361,187
100.58% of 50 DAV
50 DAV is 359,100
|
$95.76
-6.34%
|
12/12/2012
|
$64.75
|
PP = $67.12
|
|
MB = $70.48
|
Most Recent Note - 5/22/2013 1:50:33 PM
G - Pulling back for a 3rd consecutive small loss, still only -4.3% off its all-time high, extended from any sound base. Fundamentally, concerns were raised by 2 consecutive quarterly comparisons with earnings below the minimum guideline (C criteria).
>>> The latest Featured Stock Update with an annotated graph appeared on 5/15/2013. Click here.
View all notes |
Alert me of new notes |
CANSLIM.net Company Profile |
SEC |
Zacks Reports |
StockTalk |
News |
Chart |
Request a new note
C
A N
S L
I M
|
NSM
-
NYSE
Nationstar Mtg Hldgs Inc
FINANCIAL SERVICES - Credit Services
|
$42.33
|
-0.64
-1.49% |
$43.51
|
2,362,203
188.04% of 50 DAV
50 DAV is 1,256,200
|
$46.91
-9.76%
|
5/7/2013
|
$39.71
|
PP = $42.34
|
|
MB = $44.46
|
Most Recent Note - 5/23/2013 1:02:26 PM
Y - Color code is changed to yellow while it has shown resilience and rebounded into positive territory after gapping down today following a damaging loss with above average volume with a weak finish on the prior session. Prior highs in the $42 area define initial chart support to watch. Disciplined investors alway limit losses by selling any stock that falls more than -7% from their purchase price.
>>> The latest Featured Stock Update with an annotated graph appeared on 5/7/2013. Click here.
View all notes |
Alert me of new notes |
CANSLIM.net Company Profile |
SEC |
Zacks Reports |
StockTalk |
News |
Chart |
Request a new note
C
A N
S L
I M
|
Symbol/Exchange
Company Name
Industry Group |
PRICE |
CHANGE
(%Change) |
Day High |
Volume
(% DAV)
(% 50 day avg vol) |
52 Wk Hi
% From Hi |
Featured
Date |
Price
Featured |
Pivot Featured |
|
Max Buy |
PRAA
-
NASDAQ
Portfolio Recovery Assoc
DIVERSIFIED SERVICES - Business/Management Services
|
$146.49
|
-0.65
-0.44% |
$147.04
|
48,263
68.17% of 50 DAV
50 DAV is 70,800
|
$151.51
-3.31%
|
5/1/2013
|
$130.77
|
PP = $127.88
|
|
MB = $134.27
|
Most Recent Note - 5/22/2013 5:42:38 PM
G - Hovering near its 52-week high after an impressive streak of 13 consecutive gains into new high territory. It is very extended from prior highs in the $127 area and its 50 DMA line defining important chart support. See the latest FSU analysis for more details and a new annotated graph.
>>> The latest Featured Stock Update with an annotated graph appeared on 5/22/2013. Click here.
View all notes |
Alert me of new notes |
CANSLIM.net Company Profile |
SEC |
Zacks Reports |
StockTalk |
News |
Chart |
Request a new note
C
A N
S L
I M
|
PRLB
-
NYSE
Proto Labs Inc
MANUFACTURING - Small Tools and Accessories
|
$53.34
|
+0.84
1.60% |
$53.40
|
330,142
58.25% of 50 DAV
50 DAV is 566,800
|
$59.84
-10.86%
|
5/3/2013
|
$54.77
|
PP = $54.01
|
|
MB = $56.71
|
Most Recent Note - 5/22/2013 5:44:29 PM
Y - Damaging loss today with above average volume led to a retreat below its pivot point. Trading near prior highs defining chart support above its 50 DMA line (now $50.12).
>>> The latest Featured Stock Update with an annotated graph appeared on 5/3/2013. Click here.
View all notes |
Alert me of new notes |
CANSLIM.net Company Profile |
SEC |
Zacks Reports |
StockTalk |
News |
Chart |
Request a new note
C
A N
S L
I M
|
RRTS
-
NYSE
Roadrunner Trans Systems
TRANSPORTATION - Air Delivery and Freight Service
|
$27.19
|
+0.19
0.70% |
$27.22
|
58,836
27.92% of 50 DAV
50 DAV is 210,700
|
$28.00
-2.89%
|
4/3/2013
|
$22.77
|
PP = $23.75
|
|
MB = $24.94
|
Most Recent Note - 5/22/2013 1:41:27 PM
G - Hitting another new all-time high with light volume behind today's gain while getting more extended from its latest base. Prior highs in the $23 area define initial support to watch above its 50 DMA line. Fundamental concerns were raised by its sub par earnings increase in the Mar '13 quarter, below the +25% minimum guideline (C criteria).
>>> The latest Featured Stock Update with an annotated graph appeared on 5/14/2013. Click here.
View all notes |
Alert me of new notes |
CANSLIM.net Company Profile |
SEC |
Zacks Reports |
StockTalk |
News |
Chart |
Request a new note
C
A N
S L
I M
|
VRX
-
NYSE
Valeant Pharmaceuticals
DRUGS - Drug Manufacturers - Other
|
$74.67
|
-0.15
-0.20% |
$74.89
|
650,985
45.18% of 50 DAV
50 DAV is 1,440,900
|
$78.69
-5.11%
|
4/30/2013
|
$60.24
|
PP = $76.66
|
|
MB = $80.49
|
Most Recent Note - 5/23/2013 4:24:04 PM
Y- Volume totals have been cooling while consolidating just above its 50 DMA line, an encouraging sign that few investors have headed for the exit. Below that important short-term average its prior low ($69.87 on 4/04/13) defines important support. Subsequent violations may trigger technical sell signals. Prior reports cautioned - "Sub par earnings for the Mar '13 quarter below the +25% minimum guideline (C criteria) raised fundamental concerns."
>>> The latest Featured Stock Update with an annotated graph appeared on 5/17/2013. Click here.
View all notes |
Alert me of new notes |
CANSLIM.net Company Profile |
SEC |
Zacks Reports |
StockTalk |
News |
Chart |
Request a new note
C
A N
S L
I M
|
|
|
|
THESE ARE NOT BUY RECOMMENDATIONS!
Comments contained in the body of this report are technical
opinions only. The material herein has been obtained
from sources believed to be reliable and accurate, however,
its accuracy and completeness cannot be guaranteed.
This site is not an investment advisor, hence it does
not endorse or recommend any securities or other investments.
Any recommendation contained in this report may not
be suitable for all investors and it is not to be deemed
an offer or solicitation on our part with respect to
the purchase or sale of any securities. All trademarks,
service marks and trade names appearing in this report
are the property of their respective owners, and are
likewise used for identification purposes only.
This report is a service available
only to active Paid Premium Members.
You may opt-out of receiving report notifications
at any time. Questions or comments may be submitted
by writing to Premium Membership Services 665 S.E. 10 Street, Suite 201 Deerfield Beach, FL 33441-5634 or by calling 1-800-965-8307
or 954-785-1121.
|
|
|

