You are not logged in.
This means you
CAN ONLY VIEW reports that were published prior to Tuesday, April 8, 2025.
You
MUST UPGRADE YOUR MEMBERSHIP if you want to see any current reports.
AFTER MARKET UPDATE - WEDNESDAY, MAY 22ND, 2013
Previous After Market Report Next After Market Report >>>
|
|
|
|
DOW |
-80.41 |
15,307.17 |
-0.52% |
|
Volume |
854,696,840 |
+24% |
|
Volume |
2,112,780,630 |
+23% |
|
NASDAQ |
-38.82 |
3,463.30 |
-1.11% |
|
Advancers |
658 |
21% |
|
Advancers |
634 |
24% |
|
S&P 500 |
-13.81 |
1,655.35 |
-0.83% |
|
Decliners |
2,381 |
75% |
|
Decliners |
1,872 |
72% |
|
Russell 2000 |
-16.52 |
982.26 |
-1.65% |
|
52 Wk Highs |
486 |
|
|
52 Wk Highs |
267 |
|
|
S&P 600 |
-8.90 |
553.62 |
-1.58% |
|
52 Wk Lows |
18 |
|
|
52 Wk Lows |
17 |
|
|
 |
Indices Reversed Early Gains on Concerns of Fed Tapering Bond Buying Program
Kenneth J. Gruneisen - Passed the CAN SLIM® Master's Exam
On Wednesday the major averages reversed early gains for losses and finished near their worst levels of the session. The volume totals were reported higher than the prior session totals on the Nasdaq exchange and on the NYSE indicating distributional pressure coming from the institutional crowd. Breadth was negative as decliners led advancers by about 3-1 on the NYSE and on the Nasdaq exchange. There were 85 high-ranked companies from the CANSLIM.net Leaders List making new 52-week highs and appearing on the CANSLIM.net BreakOuts Page, up from the prior session total of 79 stocks. The new 52-week highs easily outnumbered new 52-week lows on both the NYSE and the Nasdaq exchange. There were gains for only 2 of the 14 high-ranked companies currently included on the Featured Stocks Page, a disconcertingly negative bias versus the broader market's negative breadth.

The Dow Jones Industrial Average The S&P 500 gave up nearly 14 points to 1,655 and the Nasdaq Composite shed more than 38 points, bringing the index to 3,463. The major averages rallied in earlier action as testimony from Fed Chairman Ben Bernanke supported views that the central bank would continue their current easing measures. Despite the early optimism, equities fell into the red as the FOMC minutes showed that several regional Presidents supported paring back bond purchases, but were still undecided on what would trigger that action.
All 10 sectors on the S&P finished lower with 7 giving up more than -1%. Shares of Merck & Co (MRK -1.31%) initially traded up but ended lower after announcing a $5 billion accelerated share repurchase program. In other news, luxury retailer Saks Inc (SKS +13.39) rallied on rumors that the company is investigating opportunities to sell itself. Corporate earnings were mixed in the session. Home improvement retailer Lowe's Companies Inc (LOW +1.22%) rose despite posting results that were short of analysts’ estimates. Shares of Target (TGT -4.01%) fell hard following its latest earnings release.
Turning to fixed income markets, Treasuries ended lower along the curve. The benchmark 10-year note was down 7/8 of a point to yield 2.03% and the 30-year bond gave up over a point and a half to yield 3.22%.
The market (M criteria) continues to show healthy leadership with many stocks hitting new 52-week highs reassuring investors a confirmed uptrend is currently at hand. Watch for new stocks featured in the CANSLIM.net Mid-Day BreakOuts Report. Action-worthy leaders are covered on an ongoing basis with the latest notes and additional resource links included on the Featured Stocks Page. Watch for an announcement via email concerning the next WEBCAST. The webcast will also be available via an updated link highlighted at the top of the Premium Member Homepage.
PICTURED: The Dow Jones Industrial Average hit new all-time highs but erased early gains after a "negative reversal" for loss on higher volume. The Blue Chip index fell 80 points to 15,307 after being up by as many as 154 points in early action. It is up +16.8% year-to-date. The indices' rally to new highs confirmed the market's uptrend which means odds are favorable for new buying efforts in stocks meeting all of the fact-based investment system's key criteria.
|
 Kenneth J. Gruneisen started out as a licensed stockbroker in August 1987, a couple of months prior to the historic stock market crash that took the Dow Jones Industrial Average down -22.6% in a single day. He has published daily fact-based fundamental and technical analysis on high-ranked stocks online for two decades. Through FACTBASEDINVESTING.COM, Kenneth provides educational articles, news, market commentary, and other information regarding proven investment systems that work in good times and bad.
Comments contained in the body of this report are technical opinions only and are not necessarily those of Gruneisen Growth Corp. The material herein has been obtained from sources believed to be reliable and accurate, however, its accuracy and completeness cannot be guaranteed. Our firm, employees, and customers may effect transactions, including transactions contrary to any recommendation herein, or have positions in the securities mentioned herein or options with respect thereto. Any recommendation contained in this report may not be suitable for all investors and it is not to be deemed an offer or solicitation on our part with respect to the purchase or sale of any securities. |
|
 |
Defensive Groups Led on Mostly Weak Session
Kenneth J. Gruneisen - Passed the CAN SLIM® Master's Exam
The influential Retail Index ($RLX -1.12%) and financial indexes fell with the Broker/Dealer Index ($XBD -1.21%) and the Bank Index ($BKX -0.99%) finished lower. The tech sector saw unanimous losses from the Networking Index ($NWX -2.17%), Internet Index ($IIX -1.81%), Semiconductor Index ($SOX -1.58%), and the Biotechnology Index ($BTK -1.09%). Energy-related shares were also weak as the Oil Services Index ($OSX -1.97%) and the Integrated Oil Index ($XOI -1.41%) fell. Meanwhile, defensive groups fared best as the Healthcare Index ($HMO -0.04%) finished virtually flat, and the Gold & Silver Index ($XAU +1.07%) posted a gain.
Charts courtesy www.stockcharts.com
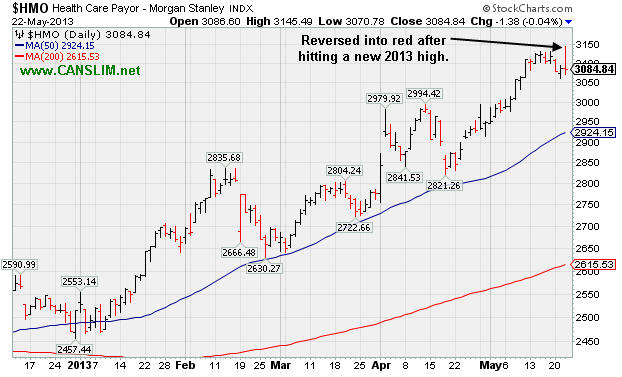
PICTURED: The Healthcare Index ($HMO -0.04%) reversed into the red after hitting a new 2013 high.
| Oil Services |
$OSX |
260.61 |
-5.23 |
-1.97% |
+18.37% |
| Healthcare |
$HMO |
3,084.84 |
-1.38 |
-0.04% |
+22.70% |
| Integrated Oil |
$XOI |
1,400.55 |
-19.96 |
-1.41% |
+12.78% |
| Semiconductor |
$SOX |
461.62 |
-7.41 |
-1.58% |
+20.19% |
| Networking |
$NWX |
238.78 |
-5.28 |
-2.17% |
+5.40% |
| Internet |
$IIX |
381.03 |
-7.01 |
-1.81% |
+16.52% |
| Broker/Dealer |
$XBD |
123.16 |
-1.51 |
-1.21% |
+30.56% |
| Retail |
$RLX |
790.39 |
-8.97 |
-1.12% |
+21.03% |
| Gold & Silver |
$XAU |
101.30 |
+1.07 |
+1.07% |
-38.83% |
| Bank |
$BKX |
60.92 |
-0.61 |
-0.99% |
+18.80% |
| Biotech |
$BTK |
1,983.86 |
-21.87 |
-1.09% |
+28.24% |
|
|
|
 |
Extended From Base After Streak of Gains for New Highs
Kenneth J. Gruneisen - Passed the CAN SLIM® Master's Exam
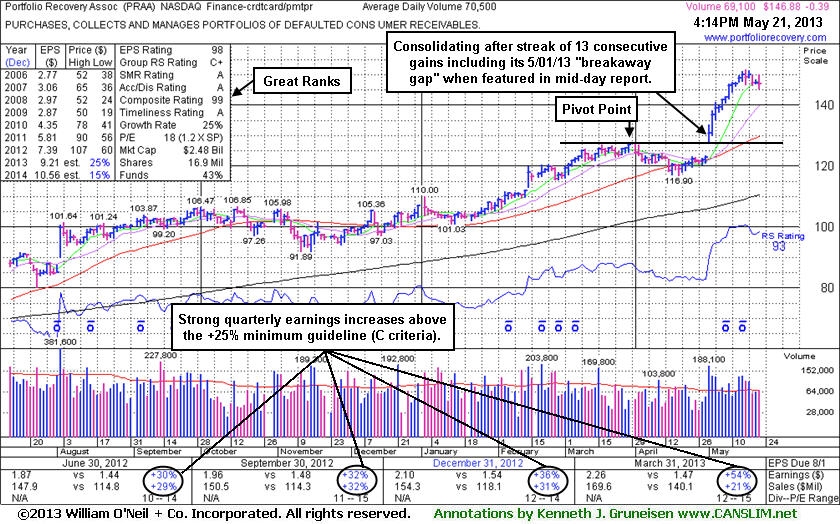
Portfolio Recovery Assoc (PRAA +$8.13 or +6.62% to $130.88) has been consolidating near its high after an impressive streak of 13 consecutive gains into new high territory. It is very extended from prior highs in the $127 area coinciding with its 50-day moving average (DMA) line defining important chart support. Patient investors may watch for a new base or secondary buy point to possibly develop and be noted in the weeks ahead. It recently reported earnings +54% on +21% sales revenues for the Mar '13 quarter, continuing its record of strong earnings increases above the +25% minimum guideline (C criteria). The number of top-rated funds owning its shares rose to 384 in Mar '13, providing additional reassurance concerning the I criteria (see earlier totals noted below). Its last appearance in this FSU section was on 5/01/13 with an annotated graph under the headline, "Volume-Driven Gap Up Gain Triggered Technical Buy Signal", after highlighted in yellow with new pivot point cited based on its 3/28/13 high plus 10 cents in the earlier mid-day report (read here). Its "breakaway gap" and considerable gain that day was backed by +127% above average volume clinching a technical buy signal.
The high-ranked leader from the Finance - Credit Card/Payment Processing industry group held its ground near its 50-day moving average (DMA) line during the consolidation from new highs hit since last noted with caution in the 2/20/13 mid-day report - "No overhead supply remains to act as resistance. Reported earnings +36% on +31% sales revenues for the Dec '12 quarter. The number of top-rated funds owning its shares rose from 302 in Mar '12 to 361 in Dec '12, a reassuring sign concerning the I criteria. Its Mar '12 results marked its only comparison with an earnings increase below the +25% minimum guideline in more than 2 years. Previously noted downturn in FY '08 and FY '09 earnings (A criteria) is a flaw in its annual earnings history." As of Mar '13 the number of top-rated funds owning its shares rose to 370, more reassuring news concerning the I criteria.
|
|
|
Color Codes Explained :
Y - Better candidates highlighted by our
staff of experts.
G - Previously featured
in past reports as yellow but may no longer be buyable under the
guidelines.
***Last / Change / Volume data in this table is the closing quote data***
Symbol/Exchange
Company Name
Industry Group |
PRICE |
CHANGE
(%Change) |
Day High |
Volume
(% DAV)
(% 50 day avg vol) |
52 Wk Hi
% From Hi |
Featured
Date |
Price
Featured |
Pivot Featured |
|
Max Buy |
AL
-
NYSE
Air Lease Corp Cl A
DIVERSIFIED SERVICES - Rental and Leasing Services
|
$29.44
|
-0.60
-2.00% |
$30.12
|
422,175
91.22% of 50 DAV
50 DAV is 462,800
|
$31.00
-5.03%
|
5/9/2013
|
$30.95
|
PP = $29.38
|
|
MB = $30.85
|
 Most Recent Note - 5/22/2013 1:53:55 PM
Y - Volume totals have been cooling this week while hovering near its 52-week high, a sign few investors have been headed for the exit. Rallied from support at its 50 DMA line and back above its pivot point with a considerable 5/15/13 gain backed by above average volume.
>>> The latest Featured Stock Update with an annotated graph appeared on 5/9/2013. Click here.
View all notes |
Alert me of new notes |
CANSLIM.net Company Profile |
SEC |
Zacks Reports |
StockTalk |
News |
Chart |
Request a new note
C
A N
S L
I M


|
AMBA
-
NASDAQ
Ambarella Inc
ELECTRONICS - Semiconductor - Specialized
|
$15.72
|
-1.18
-6.98% |
$17.56
|
1,939,855
286.92% of 50 DAV
50 DAV is 676,100
|
$17.90
-12.18%
|
5/6/2013
|
$15.31
|
PP = $16.10
|
|
MB = $16.91
|
Most Recent Note - 5/22/2013 5:46:47 PM
Y - Pulled back today and closed back below its pivot point with a big loss on above average volume raising concerns. Disciplined investors always limit losses if ever any stock falls more than -7% from their purchase price.
>>> The latest Featured Stock Update with an annotated graph appeared on 5/6/2013. Click here.
View all notes |
Alert me of new notes |
CANSLIM.net Company Profile |
SEC |
Zacks Reports |
StockTalk |
News |
Chart |
Request a new note
C
A N
S L
I M
|
CELG
-
NASDAQ
Celgene Corp
DRUGS - Drug Manufacturers - Major
|
$123.44
|
-0.06
-0.05% |
$128.35
|
4,196,230
135.00% of 50 DAV
50 DAV is 3,108,400
|
$131.82
-6.36%
|
3/27/2013
|
$113.24
|
PP = $115.54
|
|
MB = $121.32
|
Most Recent Note - 5/17/2013 12:04:08 PM
G - Pulling back for a 3rd consecutive session, retreating from all-time highs. It is extended from any sound base pattern, yet may go on to produce more climactic gains. Found support at its 50 DMA line during its recent consolidation and that short-term average defines important near-term support to watch.
>>> The latest Featured Stock Update with an annotated graph appeared on 5/13/2013. Click here.
View all notes |
Alert me of new notes |
CANSLIM.net Company Profile |
SEC |
Zacks Reports |
StockTalk |
News |
Chart |
Request a new note
C
A N
S L
I M
|
EQM
-
NYSE
E Q T Midstream Partners
ENERGY - Oil and Gas Pipelines
|
$49.76
|
+0.04
0.08% |
$50.52
|
93,628
107.87% of 50 DAV
50 DAV is 86,800
|
$49.97
-0.42%
|
4/25/2013
|
$40.16
|
PP = $40.84
|
|
MB = $42.88
|
Most Recent Note - 5/20/2013 12:15:54 PM
G - Churning heavy volume today while still stubbornly holding its ground near its all-time high, extended from its latest base. Prior highs coincide with its 50 DMA line defining important near-term chart support to watch in the $41 area.
>>> The latest Featured Stock Update with an annotated graph appeared on 5/16/2013. Click here.
View all notes |
Alert me of new notes |
CANSLIM.net Company Profile |
SEC |
Zacks Reports |
StockTalk |
News |
Chart |
Request a new note
C
A N
S L
I M
|
FLT
-
NYSE
Fleetcor Technologies
DIVERSIFIED SERVICES - Business/Management Services
|
$81.84
|
-2.17
-2.58% |
$84.44
|
626,704
69.57% of 50 DAV
50 DAV is 900,800
|
$85.56
-4.35%
|
3/21/2013
|
$71.14
|
PP = $73.00
|
|
MB = $76.65
|
Most Recent Note - 5/22/2013 1:55:11 PM
G - Still stubbornly holding its ground near its all-time high, extended from any sound base pattern. Its 50 DMA line and recent low ($70.09) define near-term support where violations would raise more serious concerns and trigger worrisome technical sell signals.
>>> The latest Featured Stock Update with an annotated graph appeared on 5/8/2013. Click here.
View all notes |
Alert me of new notes |
CANSLIM.net Company Profile |
SEC |
Zacks Reports |
StockTalk |
News |
Chart |
Request a new note
C
A N
S L
I M
|
Symbol/Exchange
Company Name
Industry Group |
PRICE |
CHANGE
(%Change) |
Day High |
Volume
(% DAV)
(% 50 day avg vol) |
52 Wk Hi
% From Hi |
Featured
Date |
Price
Featured |
Pivot Featured |
|
Max Buy |
LNKD
-
NYSE
Linkedin Corp Class A
INTERNET - Internet Information Providers
|
$176.95
|
-7.36
-3.99% |
$185.48
|
2,163,348
91.79% of 50 DAV
50 DAV is 2,356,900
|
$202.91
-12.79%
|
4/12/2013
|
$182.69
|
PP = $184.25
|
|
MB = $193.46
|
Most Recent Note - 5/22/2013 5:49:47 PM
G - Loss today with higher but near average volume led to a close just below its 50 DMA line raising concerns and its color code is changed to green. Recent lows in the $171 area define important near-term support above the 4/03/13 low ($165), levels where subsequent violations may raise greater concerns and trigger more worrisome technical sell signals.
>>> The latest Featured Stock Update with an annotated graph appeared on 5/21/2013. Click here.
View all notes |
Alert me of new notes |
CANSLIM.net Company Profile |
SEC |
Zacks Reports |
StockTalk |
News |
Chart |
Request a new note
C
A N
S L
I M
|
LOPE
-
NASDAQ
Grand Canyon Education
DIVERSIFIED SERVICES - Education and; Training Services
|
$32.85
|
+0.05
0.15% |
$34.07
|
907,919
238.36% of 50 DAV
50 DAV is 380,900
|
$33.03
-0.54%
|
5/10/2013
|
$29.03
|
PP = $27.28
|
|
MB = $28.64
|
Most Recent Note - 5/22/2013 12:37:56 PM
G - Adding to its spurt of volume-driven gains with today's 7th consecutive gain, getting very extended from prior highs. Gains of greater than +20% in the first 2-3 weeks following its "breakaway gap" suggest holding for a minimum of 8 week under the fact-based investment system's rules. Prior highs in the $27 area define initial support to watch on pullbacks.
>>> The latest Featured Stock Update with an annotated graph appeared on 5/10/2013. Click here.
View all notes |
Alert me of new notes |
CANSLIM.net Company Profile |
SEC |
Zacks Reports |
StockTalk |
News |
Chart |
Request a new note
C
A N
S L
I M
|
MRLN
-
NASDAQ
Marlin Business Services
DIVERSIFIED SERVICES - Rental and Leasing Services
|
$22.16
|
-1.39
-5.90% |
$23.76
|
21,219
87.68% of 50 DAV
50 DAV is 24,200
|
$25.97
-14.67%
|
3/15/2013
|
$22.29
|
PP = $23.18
|
|
MB = $24.34
|
Most Recent Note - 5/22/2013 1:47:03 PM
G - Color code is changed to green while down for a 3rd consecutive loss with with light volume, slumping below prior highs in the $23 area and raising concerns while also trading below its 50 DMA line (now $23.12) previously noted as important chart support to watch. Damaging violations may trigger worrisome technical sell signals, meanwhile, only a prompt rebound above its 50 DMA line would help its outlook improve.
>>> The latest Featured Stock Update with an annotated graph appeared on 5/2/2013. Click here.
View all notes |
Alert me of new notes |
CANSLIM.net Company Profile |
SEC |
Zacks Reports |
StockTalk |
News |
Chart |
Request a new note
C
A N
S L
I M
|
N
-
NYSE
Netsuite Inc
DIVERSIFIED SERVICES - Business/Management Services
|
$89.16
|
-4.62
-4.93% |
$94.69
|
707,845
200.24% of 50 DAV
50 DAV is 353,500
|
$95.76
-6.89%
|
12/12/2012
|
$64.75
|
PP = $67.12
|
|
MB = $70.48
|
Most Recent Note - 5/22/2013 1:50:33 PM
G - Pulling back for a 3rd consecutive small loss, still only -4.3% off its all-time high, extended from any sound base. Fundamentally, concerns were raised by 2 consecutive quarterly comparisons with earnings below the minimum guideline (C criteria).
>>> The latest Featured Stock Update with an annotated graph appeared on 5/15/2013. Click here.
View all notes |
Alert me of new notes |
CANSLIM.net Company Profile |
SEC |
Zacks Reports |
StockTalk |
News |
Chart |
Request a new note
C
A N
S L
I M
|
NSM
-
NYSE
Nationstar Mtg Hldgs Inc
FINANCIAL SERVICES - Credit Services
|
$42.97
|
-2.41
-5.31% |
$46.19
|
1,914,074
155.27% of 50 DAV
50 DAV is 1,232,700
|
$46.91
-8.40%
|
5/7/2013
|
$39.71
|
PP = $42.34
|
|
MB = $44.46
|
Most Recent Note - 5/22/2013 5:51:04 PM
G - Damaging loss today with above average volume while retreating toward prior highs in the $42 area defining initial chart support to watch on pullbacks.
>>> The latest Featured Stock Update with an annotated graph appeared on 5/7/2013. Click here.
View all notes |
Alert me of new notes |
CANSLIM.net Company Profile |
SEC |
Zacks Reports |
StockTalk |
News |
Chart |
Request a new note
C
A N
S L
I M
|
Symbol/Exchange
Company Name
Industry Group |
PRICE |
CHANGE
(%Change) |
Day High |
Volume
(% DAV)
(% 50 day avg vol) |
52 Wk Hi
% From Hi |
Featured
Date |
Price
Featured |
Pivot Featured |
|
Max Buy |
PRAA
-
NASDAQ
Portfolio Recovery Assoc
DIVERSIFIED SERVICES - Business/Management Services
|
$147.14
|
-0.13
-0.09% |
$149.99
|
79,261
112.43% of 50 DAV
50 DAV is 70,500
|
$151.51
-2.88%
|
5/1/2013
|
$130.77
|
PP = $127.88
|
|
MB = $134.27
|
Most Recent Note - 5/22/2013 5:42:38 PM
G - Hovering near its 52-week high after an impressive streak of 13 consecutive gains into new high territory. It is very extended from prior highs in the $127 area and its 50 DMA line defining important chart support. See the latest FSU analysis for more details and a new annotated graph.
>>> The latest Featured Stock Update with an annotated graph appeared on 5/22/2013. Click here.
View all notes |
Alert me of new notes |
CANSLIM.net Company Profile |
SEC |
Zacks Reports |
StockTalk |
News |
Chart |
Request a new note
C
A N
S L
I M
|
PRLB
-
NYSE
Proto Labs Inc
MANUFACTURING - Small Tools and Accessories
|
$52.50
|
-3.49
-6.23% |
$56.37
|
758,319
136.31% of 50 DAV
50 DAV is 556,300
|
$59.84
-12.27%
|
5/3/2013
|
$54.77
|
PP = $54.01
|
|
MB = $56.71
|
Most Recent Note - 5/22/2013 5:44:29 PM
Y - Damaging loss today with above average volume led to a retreat below its pivot point. Trading near prior highs defining chart support above its 50 DMA line (now $50.12).
>>> The latest Featured Stock Update with an annotated graph appeared on 5/3/2013. Click here.
View all notes |
Alert me of new notes |
CANSLIM.net Company Profile |
SEC |
Zacks Reports |
StockTalk |
News |
Chart |
Request a new note
C
A N
S L
I M
|
RRTS
-
NYSE
Roadrunner Trans Systems
TRANSPORTATION - Air Delivery and Freight Service
|
$27.00
|
+0.00
0.00% |
$28.00
|
158,471
75.79% of 50 DAV
50 DAV is 209,100
|
$27.49
-1.78%
|
4/3/2013
|
$22.77
|
PP = $23.75
|
|
MB = $24.94
|
Most Recent Note - 5/22/2013 1:41:27 PM
G - Hitting another new all-time high with light volume behind today's gain while getting more extended from its latest base. Prior highs in the $23 area define initial support to watch above its 50 DMA line. Fundamental concerns were raised by its sub par earnings increase in the Mar '13 quarter, below the +25% minimum guideline (C criteria).
>>> The latest Featured Stock Update with an annotated graph appeared on 5/14/2013. Click here.
View all notes |
Alert me of new notes |
CANSLIM.net Company Profile |
SEC |
Zacks Reports |
StockTalk |
News |
Chart |
Request a new note
C
A N
S L
I M
|
VRX
-
NYSE
Valeant Pharmaceuticals
DRUGS - Drug Manufacturers - Other
|
$74.82
|
-0.71
-0.94% |
$77.01
|
871,148
60.35% of 50 DAV
50 DAV is 1,443,400
|
$78.69
-4.92%
|
4/30/2013
|
$60.24
|
PP = $76.66
|
|
MB = $80.49
|
Most Recent Note - 5/20/2013 5:46:20 PM
Y- Erased the prior session's gain and more with a big loss today on lighter volume. The 50 DMA line and recent low ($69.87 on 4/04/13) define important support where subsequent violations may trigger technical sell signals. Prior reports cautioned - "Sub par earnings for the Mar '13 quarter below the +25% minimum guideline (C criteria) raised fundamental concerns."
>>> The latest Featured Stock Update with an annotated graph appeared on 5/17/2013. Click here.
View all notes |
Alert me of new notes |
CANSLIM.net Company Profile |
SEC |
Zacks Reports |
StockTalk |
News |
Chart |
Request a new note
C
A N
S L
I M
|
|
|
|
THESE ARE NOT BUY RECOMMENDATIONS!
Comments contained in the body of this report are technical
opinions only. The material herein has been obtained
from sources believed to be reliable and accurate, however,
its accuracy and completeness cannot be guaranteed.
This site is not an investment advisor, hence it does
not endorse or recommend any securities or other investments.
Any recommendation contained in this report may not
be suitable for all investors and it is not to be deemed
an offer or solicitation on our part with respect to
the purchase or sale of any securities. All trademarks,
service marks and trade names appearing in this report
are the property of their respective owners, and are
likewise used for identification purposes only.
This report is a service available
only to active Paid Premium Members.
You may opt-out of receiving report notifications
at any time. Questions or comments may be submitted
by writing to Premium Membership Services 665 S.E. 10 Street, Suite 201 Deerfield Beach, FL 33441-5634 or by calling 1-800-965-8307
or 954-785-1121.
|
|
|

