You are not logged in.
This means you
CAN ONLY VIEW reports that were published prior to Monday, April 14, 2025.
You
MUST UPGRADE YOUR MEMBERSHIP if you want to see any current reports.
AFTER MARKET UPDATE - WEDNESDAY, MAY 21ST, 2014
Previous After Market Report Next After Market Report >>>
|
|
|
|
DOW |
+158.75 |
16,533.06 |
+0.97% |
|
Volume |
574,769,240 |
-10% |
|
Volume |
1,584,814,510 |
-4% |
|
NASDAQ |
+34.65 |
4,131.54 |
+0.85% |
|
Advancers |
1,976 |
63% |
|
Advancers |
1,609 |
59% |
|
S&P 500 |
+15.20 |
1,888.03 |
+0.81% |
|
Decliners |
1,040 |
33% |
|
Decliners |
1,030 |
37% |
|
Russell 2000 |
+5.73 |
1,103.63 |
+0.52% |
|
52 Wk Highs |
95 |
|
|
52 Wk Highs |
31 |
|
|
S&P 600 |
+2.79 |
638.16 |
+0.44% |
|
52 Wk Lows |
34 |
|
|
52 Wk Lows |
56 |
|
|
 |
Major Averages Rose With Less Volume Conviction Again
Kenneth J. Gruneisen - Passed the CAN SLIM® Master's Exam
On Wednesday the major averages gained ground while the volume was reported lighter than the prior session totals on the NYSE and on the Nasdaq exchange, a sign of lackluster buying efforts coming from the institutional crowd. Breadth was positive as advancers led decliners by nearly a 2-1 margin on the NYSE and 3-2 on the Nasdaq exchange. Leadership improved slightly as there were 25 high-ranked companies from the CANSLIM.net Leaders List that made new 52-week highs and appeared on the CANSLIM.net BreakOuts Page, up from the total of 20 stocks on the prior session. New 52-week highs outnumbered new 52-week lows on the NYSE while new lows outnumbered new highs on the Nasdaq exchange. There were gains for 6 of the 7 high-ranked companies currently included on the Featured Stocks Page. It was recently noted that the Dow Jones Industrial Average and S&P 500 Index both tallied gains into new high territory. Technically that is favorable, however, uncertain market action overall has led the newspaper to still hold off from officially shifting its view that the market direction (M criteria) is back in a "confirmed uptrend". While awaiting a more definitive read on the market any new buying efforts should be very selective and only focused in stocks meeting all key criteria of the fact-based investment system. Keep in mind that any sustained and meaningful market advance requires leadership - a healthy crop of stocks hitting new 52-week highs.
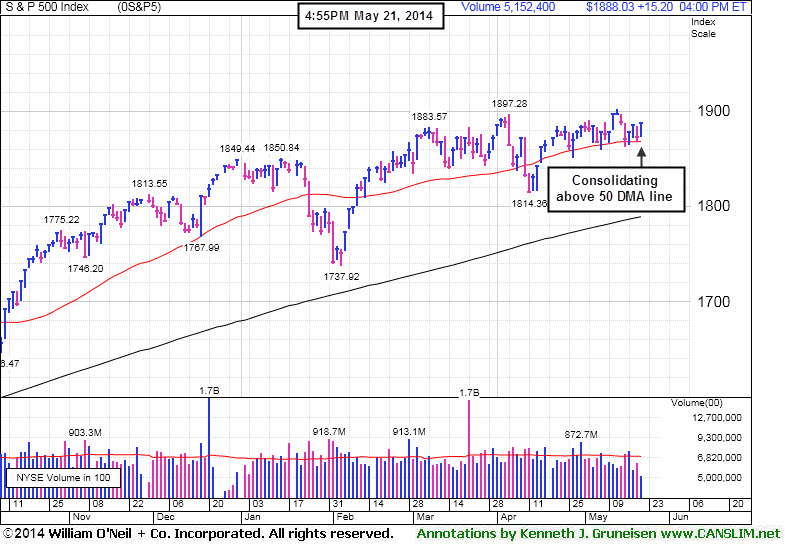
Stocks finished firmly in positive territory on Wednesday's session. The Dow rose 159 points to 16,533. The S&P 500 gained 15 points to 1,888. The NASDAQ closed 35 points higher at 4,131. The major averages rebounded from Tuesday's decline prompted by commentary from the Fed. The release of minutes from the April meeting showed the central bank discussed how it should communicate its guidance on interest rates. Policy makers also concluded that the current pace of stimulus is unlikely to cause a pickup in inflation.
On the earnings front, the market digested another round of quarterly results by retailers. Shares of Tiffany's (TIF +9.2%) after its profits topped consensus estimates. Target (TGT +1%) despite reporting an earnings shortfall and trimming its forecasts. PetSmart (PETM -8.3%) fell following its reduced full-year outlook.
All 10 sectors in the S&P 500 were up on the session. Energy was the best performing group. Exxon (XOM +1.4%) rose as the price of crude oil advanced. Financials also helped lift the market higher as MasterCard (MA +2.7%) tallied a big gain.
Treasuries declined on the session in response to the Fed minutes. Benchmark 10-year notes fell 6/32 to yield 2.53%.
The CANSLIM.net Featured Stocks Page shows the most action-worthy candidates and their latest notes and a Headline Link directs members to the latest detailed analysis with data-packed graphs annotated by a Certified expert along with links to additional resources. The Premium Member Homepage includes "dynamic archives" to all prior pay reports published. Watch for an announcement via email concerning the next WEBCAST.
PICTURED: The S&P 500 Index is consolidating above its 50-day moving average line. Deterioration below that important short-term average would not bode well for the market outlook.
|
 Kenneth J. Gruneisen started out as a licensed stockbroker in August 1987, a couple of months prior to the historic stock market crash that took the Dow Jones Industrial Average down -22.6% in a single day. He has published daily fact-based fundamental and technical analysis on high-ranked stocks online for two decades. Through FACTBASEDINVESTING.COM, Kenneth provides educational articles, news, market commentary, and other information regarding proven investment systems that work in good times and bad.
Comments contained in the body of this report are technical opinions only and are not necessarily those of Gruneisen Growth Corp. The material herein has been obtained from sources believed to be reliable and accurate, however, its accuracy and completeness cannot be guaranteed. Our firm, employees, and customers may effect transactions, including transactions contrary to any recommendation herein, or have positions in the securities mentioned herein or options with respect thereto. Any recommendation contained in this report may not be suitable for all investors and it is not to be deemed an offer or solicitation on our part with respect to the purchase or sale of any securities. |
|
 |
Retail, Financial, Tech, and Energy-Related Groups Rose
Kenneth J. Gruneisen - Passed the CAN SLIM® Master's Exam
Influential gains from the Retail Index ($RLX +1.19%) and positive action from financial shares helped the major averages rise on Wednesday as the Broker/Dealer Index ($XBD +1.27%) outpaced the Bank Index ($BKX +0.86%). The tech sector had a positive bias as the Semiconductor Index ($SOX +0.56%), Biotechnology Index ($BTK +0.63%), and the Networking Index ($NWX +0.64%) posted unanimous gains. Energy-related shares also drifted higher as the Oil Services Index ($OSX +0.70%) and the Integrated Oil Index ($XOI +0.98%) both rose. Meanwhile, the Gold & Silver Index ($XAU +0.02%) finished flat.
Charts courtesy www.stockcharts.com
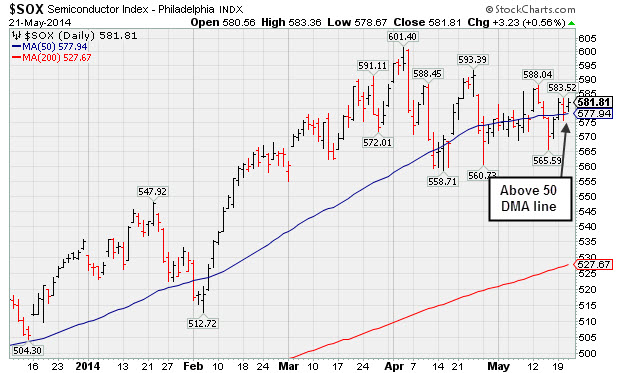
PICTURED: The Semiconductor Index ($SOX +0.56%) is consolidating above its 50-day moving average (DMA) line.
| Oil Services |
$OSX |
286.25 |
+1.98 |
+0.70% |
+1.86% |
| Integrated Oil |
$XOI |
1,616.64 |
+15.68 |
+0.98% |
+7.55% |
| Semiconductor |
$SOX |
581.81 |
+3.23 |
+0.56% |
+8.74% |
| Networking |
$NWX |
331.27 |
+2.11 |
+0.64% |
+2.26% |
| Broker/Dealer |
$XBD |
150.97 |
+1.89 |
+1.27% |
-5.97% |
| Retail |
$RLX |
854.89 |
+10.07 |
+1.19% |
-9.03% |
| Gold & Silver |
$XAU |
88.70 |
+0.02 |
+0.02% |
+5.41% |
| Bank |
$BKX |
67.65 |
+0.58 |
+0.86% |
-2.32% |
| Biotech |
$BTK |
2,521.58 |
+15.86 |
+0.63% |
+8.20% |
|
|
|
 |
Finished Strong With Gain From Advanced Base Pattern
Kenneth J. Gruneisen - Passed the CAN SLIM® Master's Exam
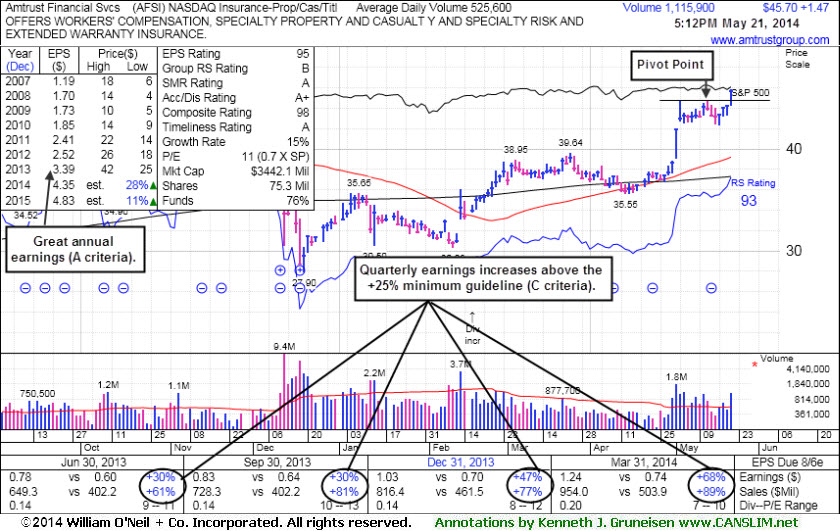
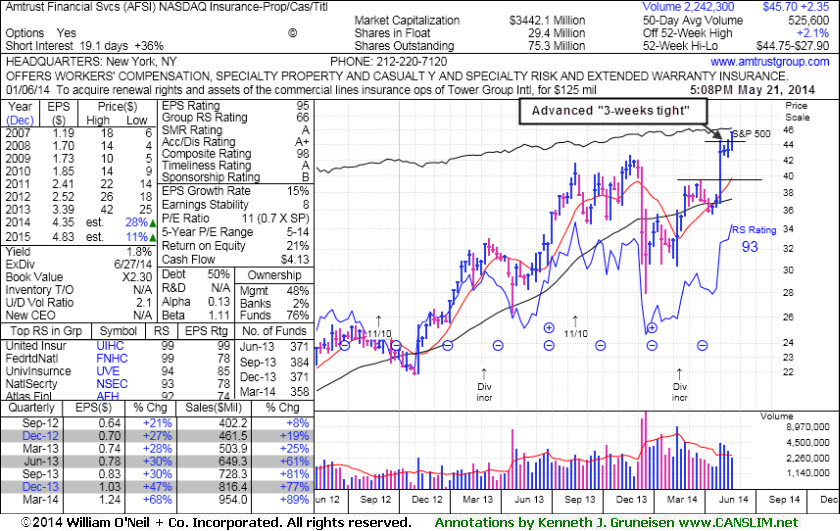
Amtrust Financial Svcs (AFSI +$1.47 or +3.32% to $45.70) hit a new 52-week high and finished strong with +112% above average volume behind today's solid gain while rising from an advanced "3-weeks tight" base. The high-ranked Insurance - Property/Casualty/Title firm was highlighted in yellow in the earlier mid-day report (read here). It held its ground stubbornly while consolidating following a technical breakout on 5/01/14 from a 5-week flat base. The new pivot point cited was based on its 5/13/14 high plus 10 cents. Prior mid-day reports noted - "Reported earnings +68% on +89% sales revenues for the quarter ended Mar '14 quarter versus the year ago period, its 7th consecutive comparison above the +25% minimum earnings guideline (C criteria). Patient investors may watch for a secondary buy point or new base to develop and be noted in the weeks ahead."
Keep in mind 3 out of 4 stocks move in the direction of the major averages (M criteria). Confirming gains from the broader market averages coupled with an expansion in leadership (stocks hitting new 52-week highs) would be a welcome reassurance that the market has established a meaningful rally. It has a great annual earnings (A criteria) history and it has earned an impressive 95 Earnings Per Share rating, well above the 80+ minimum rating for buy candidates.. One concern is that the number of top-rated funds owning an interest was recently reported lower, however, its current Up/Down Volume Ratio of 2.1 is an unbiased indication that its shares have been under accumulation over the past 50 days.
|
|
|
Color Codes Explained :
Y - Better candidates highlighted by our
staff of experts.
G - Previously featured
in past reports as yellow but may no longer be buyable under the
guidelines.
***Last / Change / Volume data in this table is the closing quote data***
Symbol/Exchange
Company Name
Industry Group |
PRICE |
CHANGE
(%Change) |
Day High |
Volume
(% DAV)
(% 50 day avg vol) |
52 Wk Hi
% From Hi |
Featured
Date |
Price
Featured |
Pivot Featured |
|
Max Buy |
AFSI
-
NASDAQ
Amtrust Financial Svcs
INSURANCE - Property and; Casualty Insurance
|
$45.70
|
+1.47
3.32% |
$45.83
|
1,113,200
212.04% of 50 DAV
50 DAV is 525,000
|
$44.75
2.12%
|
5/21/2014
|
$44.85
|
PP = $44.85
|
|
MB = $47.09
|
 Most Recent Note - 5/21/2014 5:50:53 PM
Y - Finished strong while hitting a new 52-week high today, rising from an advanced "3-weeks tight" base with +112% above average volume, triggering a technical buy signal. Keep in mind 3 out of 4 stocks move in the direction of the major averages (M criteria). See the latest FSU analysis for more details and new annotated graphs.
>>> FEATURED STOCK ARTICLE : Finished Strong With Gain From Advanced Base Pattern - 5/21/2014
View all notes |
Set NEW NOTE alert |
CANSLIM.net Company Profile |
SEC
News |
Chart |
Request a new note
C
A N
S L
I M


|
AL
-
NYSE
Air Lease Corp Cl A
DIVERSIFIED SERVICES - Rental and Leasing Services
|
$38.27
|
-0.12
-0.31% |
$38.54
|
838,225
120.09% of 50 DAV
50 DAV is 698,000
|
$40.36
-5.18%
|
5/9/2014
|
$38.27
|
PP = $38.25
|
|
MB = $40.16
|
Most Recent Note - 5/20/2014 6:37:00 PM
Y - Small loss today with higher volume, slumping near its pivot point and prior highs near $38 defining near-term support to watch on pullbacks.
>>> FEATURED STOCK ARTICLE : Volume Heavy Following Gap Up Gain for New 52-Week High - 5/9/2014
View all notes |
Set NEW NOTE alert |
CANSLIM.net Company Profile |
SEC
News |
Chart |
Request a new note
C
A N
S L
I M
|
EQM
-
NYSE
E Q T Midstream Partners
ENERGY - Oil and Gas Pipelines
|
$78.80
|
+0.73
0.94% |
$79.28
|
109,350
47.34% of 50 DAV
50 DAV is 231,000
|
$78.67
0.17%
|
12/12/2013
|
$53.17
|
PP = $56.51
|
|
MB = $59.34
|
Most Recent Note - 5/16/2014 6:15:21 PM
G - Inched higher today for a best ever close with a gain on light volume. Completed a new Public Offering of 10.75 Million common units on 5/01/14. Fundamental concerns remain after 2 consecutive sub par quarters below the +25% minimum earnings guideline. Its 50 DMA line defines near-term support where a violation may trigger a technical sell signal. See the latest FSU analysis for more details and new annotated graphs.
>>> FEATURED STOCK ARTICLE : Best Ever Close With Light Volume Gain - 5/16/2014
View all notes |
Set NEW NOTE alert |
CANSLIM.net Company Profile |
SEC
News |
Chart |
Request a new note
C
A N
S L
I M
|
GRFS
-
NASDAQ
Grifols Sa Ads
Medical-Ethical Drugs
|
$42.28
|
+0.32
0.76% |
$42.54
|
309,826
49.89% of 50 DAV
50 DAV is 621,000
|
$43.50
-2.80%
|
5/15/2014
|
$41.14
|
PP = $43.55
|
|
MB = $45.73
|
Most Recent Note - 5/19/2014 6:28:14 PM
Y - Tallied a solid gain today with above average volume, approaching the pivot point. This Spanish firm from the Medical- Ethical Drugs industry has little resistance remaining due to overhead supply. Subsequent volume-driven gains for new highs are needed to trigger a technical buy signal.
>>> FEATURED STOCK ARTICLE : Perched Within Close Striking Distance of New Highs - 5/15/2014
View all notes |
Set NEW NOTE alert |
CANSLIM.net Company Profile |
SEC
News |
Chart |
Request a new note
C
A N
S L
I M
|
ICON
-
NASDAQ
Iconix Brand Group Inc
CONSUMER NON-DURABLES - Textile - Apparel Footwear
|
$41.53
|
+0.38
0.92% |
$41.63
|
536,168
96.09% of 50 DAV
50 DAV is 558,000
|
$43.34
-4.18%
|
4/30/2014
|
$42.50
|
PP = $42.57
|
|
MB = $44.70
|
Most Recent Note - 5/20/2014 6:41:05 PM
Y - Consolidating above its 50 DMA line. A violation of that short-term average would raise concerns and trigger a technical sell signal. Confirming gains above the pivot point with above average volume could trigger a new (or add-on) technical buy signal. See the latest FSU analysis for more details and new annotated graphs.
>>> FEATURED STOCK ARTICLE : Consolidating Above 50 DMA Line Still Perched Near 52-Week High - 5/20/2014
View all notes |
Set NEW NOTE alert |
CANSLIM.net Company Profile |
SEC
News |
Chart |
Request a new note
C
A N
S L
I M
|
Symbol/Exchange
Company Name
Industry Group |
PRICE |
CHANGE
(%Change) |
Day High |
Volume
(% DAV)
(% 50 day avg vol) |
52 Wk Hi
% From Hi |
Featured
Date |
Price
Featured |
Pivot Featured |
|
Max Buy |
TRN
-
NYSE
Trinity Industries Inc
TRANSPORTATION - Railroads
|
$82.20
|
+0.65
0.80% |
$82.80
|
1,646,699
128.55% of 50 DAV
50 DAV is 1,281,000
|
$82.85
-0.78%
|
4/30/2014
|
$75.57
|
PP = $76.05
|
|
MB = $79.85
|
Most Recent Note - 5/21/2014 12:27:50 PM
G - Holding its ground stubbornly, extended from any sound base. Prior highs in the $75-76 area define near-term support to watch on pullbacks.
>>> FEATURED STOCK ARTICLE : Rose Beyond "Max Buy" Level With 7th Consecutive Gain - 5/12/2014
View all notes |
Set NEW NOTE alert |
CANSLIM.net Company Profile |
SEC
News |
Chart |
Request a new note
C
A N
S L
I M
|
WLK
-
NYSE
Westlake Chemical Corp
CHEMICALS - Specialty Chemicals
|
$76.90
|
+0.19
0.25% |
$77.69
|
653,881
94.77% of 50 DAV
50 DAV is 690,000
|
$77.64
-0.95%
|
4/29/2014
|
$72.79
|
PP = $69.31
|
|
MB = $72.78
|
Most Recent Note - 5/20/2014 6:39:28 PM
G - Hovering near its 52-week high after 3 consecutive gains. Prior highs in the $69 area define near-term support to watch.
>>> FEATURED STOCK ARTICLE : Extended From Base Following Volume Driven Gains - 5/8/2014
View all notes |
Set NEW NOTE alert |
CANSLIM.net Company Profile |
SEC
News |
Chart |
Request a new note
C
A N
S L
I M
|
|
|
|
THESE ARE NOT BUY RECOMMENDATIONS!
Comments contained in the body of this report are technical
opinions only. The material herein has been obtained
from sources believed to be reliable and accurate, however,
its accuracy and completeness cannot be guaranteed.
This site is not an investment advisor, hence it does
not endorse or recommend any securities or other investments.
Any recommendation contained in this report may not
be suitable for all investors and it is not to be deemed
an offer or solicitation on our part with respect to
the purchase or sale of any securities. All trademarks,
service marks and trade names appearing in this report
are the property of their respective owners, and are
likewise used for identification purposes only.
This report is a service available
only to active Paid Premium Members.
You may opt-out of receiving report notifications
at any time. Questions or comments may be submitted
by writing to Premium Membership Services 665 S.E. 10 Street, Suite 201 Deerfield Beach, FL 33441-5634 or by calling 1-800-965-8307
or 954-785-1121.
|
|
|

