You are not logged in.
This means you
CAN ONLY VIEW reports that were published prior to Monday, April 14, 2025.
You
MUST UPGRADE YOUR MEMBERSHIP if you want to see any current reports.
AFTER MARKET UPDATE - TUESDAY, MAY 21ST, 2013
Previous After Market Report Next After Market Report >>>
|
|
|
|
DOW |
+52.30 |
15,387.58 |
+0.34% |
|
Volume |
687,196,030 |
+5% |
|
Volume |
1,715,273,550 |
+2% |
|
NASDAQ |
+5.69 |
3,502.12 |
+0.16% |
|
Advancers |
1,633 |
52% |
|
Advancers |
1,297 |
50% |
|
S&P 500 |
+2.87 |
1,669.16 |
+0.17% |
|
Decliners |
1,377 |
44% |
|
Decliners |
1,155 |
45% |
|
Russell 2000 |
+0.80 |
998.78 |
+0.08% |
|
52 Wk Highs |
412 |
|
|
52 Wk Highs |
231 |
|
|
S&P 600 |
+0.76 |
562.52 |
+0.14% |
|
52 Wk Lows |
20 |
|
|
52 Wk Lows |
6 |
|
|
 |
Major Averages Posted Small Gains With Slightly Higher Volume
Kenneth J. Gruneisen - Passed the CAN SLIM® Master's Exam
The major averages posted moderate gains on Tuesday. The volume totals were reported slightly higher than the prior session totals on the Nasdaq exchange and on the NYSE. Breadth was slightly positive as advancers led decliners by 8-7 on the NYSE and by 7-6 on the Nasdaq exchange. There were 79 high-ranked companies from the CANSLIM.net Leaders List making new 52-week highs and appearing on the CANSLIM.net BreakOuts Page, down from the prior session total of 122 stocks. The new 52-week highs easily outnumbered new 52-week lows on both the NYSE and the Nasdaq exchange, and the new lows total was in the single digits on the Nasdaq exchange. There were gains for 9 of the 14 high-ranked companies currently included on the Featured Stocks Page.
Stocks managed to hold onto their early gains. Dovish comments from regional Presidents Bullard and Dudley eased concerns that the central bank could be planning on paring back its current easing measures. Focus will now be on Chairman Bernanke's congressional testimony Wednesday at 10AM.
Nine of the 10 sectors on the S&P ended higher, led by gains in health care stocks. Drug maker Merck & Co (MRK +4.69%) was the top performer. On the earnings front, The Home Depot Inc (HD +2.5%) rose after the company topped analysts' expectations in the quarter and raised their full-year guidance. Also among earnings, Medtronic Inc (MDT +5%) rose and Best Buy Co Inc (BBY -4.4%) fell following their quarterly profit tallies.
Turning to fixed income markets, Treasuries are higher along the curve with the benchmark 10-year note up 1/4 of a point to yield 1.93% and the 30-year bond gained 23/32 to yield 3.13%.
The market (M criteria) continues to show healthy leadership with many stocks hitting new 52-week highs reassuring investors a confirmed uptrend is currently at hand. Watch for new stocks featured in the CANSLIM.net Mid-Day BreakOuts Report. Action-worthy leaders are covered on an ongoing basis with the latest notes and additional resource links included on the Featured Stocks Page. Watch for an announcement via email concerning the next WEBCAST. The webcast will also be available via an updated link highlighted at the top of the Premium Member Homepage.
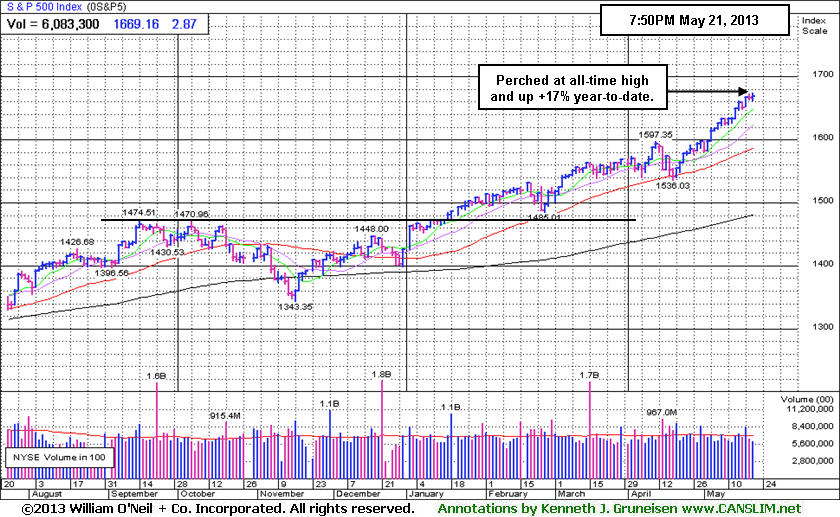
PICTURED: The S&P 500 Index is perched at an all-time high and up +17% year-to-date. The indices' rally to new highs confirmed the market's uptrend which means odds are favorable for new buying efforts in stocks meeting all of the fact-based investment system's key criteria.
|
 Kenneth J. Gruneisen started out as a licensed stockbroker in August 1987, a couple of months prior to the historic stock market crash that took the Dow Jones Industrial Average down -22.6% in a single day. He has published daily fact-based fundamental and technical analysis on high-ranked stocks online for two decades. Through FACTBASEDINVESTING.COM, Kenneth provides educational articles, news, market commentary, and other information regarding proven investment systems that work in good times and bad.
Comments contained in the body of this report are technical opinions only and are not necessarily those of Gruneisen Growth Corp. The material herein has been obtained from sources believed to be reliable and accurate, however, its accuracy and completeness cannot be guaranteed. Our firm, employees, and customers may effect transactions, including transactions contrary to any recommendation herein, or have positions in the securities mentioned herein or options with respect thereto. Any recommendation contained in this report may not be suitable for all investors and it is not to be deemed an offer or solicitation on our part with respect to the purchase or sale of any securities. |
|
 |
Retail and Medical Groups Led Gainers
Kenneth J. Gruneisen - Passed the CAN SLIM® Master's Exam
The Retail Index ($RLX +0.80%) posted an influential gain which helped underpin the major averages' advance. Medical-related shares had a positive bias as the Healthcare Index ($HMO +0.21%) and the Biotechnology Index ($BTK +0.40%) tallied modest gains. The Broker/Dealer Index ($XBD -0.70%) created a drag on the major averages and yet the Bank Index ($BKX +0.16%) eked out a tiny gain. The Networking Index ($NWX -0.48%) and Internet Index ($IIX -0.37%) finished with small losses and the Semiconductor Index ($SOX -0.02%) finished flat. The Oil Services Index ($OSX -0.32%) edged lower and the Integrated Oil Index ($XOI +0.06%) ended virtually unchanged. The Gold & Silver Index ($XAU -2.75%) slumped and was a standout decliner.
Charts courtesy www.stockcharts.com
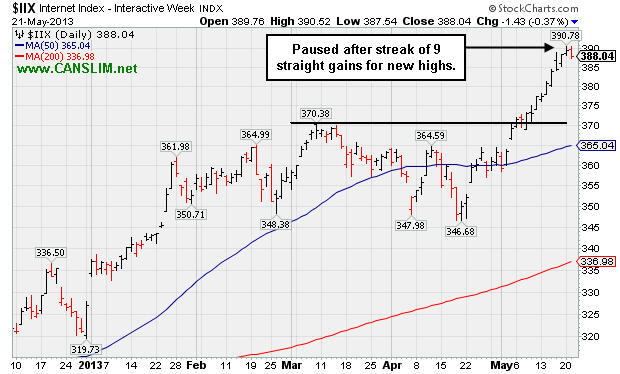
PICTURED: The Internet Index ($IIX -0.37%) paused after a streak of 9 consecutive gains for new highs.
| Oil Services |
$OSX |
265.84 |
-0.85 |
-0.32% |
+20.75% |
| Healthcare |
$HMO |
3,086.23 |
+6.54 |
+0.21% |
+22.75% |
| Integrated Oil |
$XOI |
1,420.51 |
+0.91 |
+0.06% |
+14.39% |
| Semiconductor |
$SOX |
469.03 |
-0.09 |
-0.02% |
+22.12% |
| Networking |
$NWX |
244.07 |
-1.18 |
-0.48% |
+7.73% |
| Internet |
$IIX |
388.04 |
-1.43 |
-0.37% |
+18.67% |
| Broker/Dealer |
$XBD |
124.67 |
-0.87 |
-0.70% |
+32.16% |
| Retail |
$RLX |
799.36 |
+6.33 |
+0.80% |
+22.40% |
| Gold & Silver |
$XAU |
100.23 |
-2.83 |
-2.75% |
-39.47% |
| Bank |
$BKX |
61.53 |
+0.10 |
+0.16% |
+19.99% |
| Biotech |
$BTK |
2,005.74 |
+7.94 |
+0.40% |
+29.65% |
|
|
|
 |
Found Encouraging Support at 50-Day Moving Average With Volume-Driven Gains
Kenneth J. Gruneisen - Passed the CAN SLIM® Master's Exam
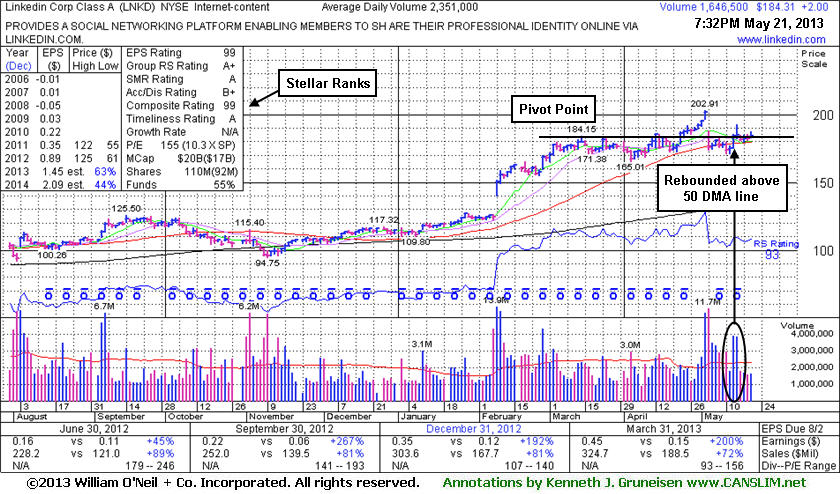
Linkedin Corp (LNKD +$2.00 or +1.10% to $184.31) is holding its ground after finding prompt support at its 50-day moving average (DMA) line and tallying volume-driven gains, a sign of institutional support. Recent lows in the $171 area define important near-term support above the 4/03/13 low ($165), levels where subsequent violations may raise greater concerns and trigger more worrisome technical sell signals. Its last appearance in this FSU section was on 4/29/13 with an annotated graph under the headline, "Found Support At 50 Day Average But Gains for New 52-Week Highs Lacked Volume". By the time it finally tallied a solid gain on heavy volume, on 5/02/13, it was getting too extended from its latest base. Then, it immediately encountered heavy distributional pressure which may have prompted disciplined investors, and especially anyone who chased the stock more than +5% above its pivot point, to have to sell upon a pullback more than -7% below their purchase price.
The company's fundamentals (C and A criteria) remain strong, and it reported a solid +200% earnings increase for the Mar '13 quarter versus the year ago period. The high-ranked leader from the Internet - Content group's Return On Equity of 13% is still below the 17% guideline, which is a minor concern. Ownership by top-rated funds has been on the rise, increasing from 601 in Jun '12 to 867 in Mar '13, a very reassuring sign concerning the I criteria. Its current Up/Down Volume Ratio of 1.4 is an unbiased indication that its shares have been under accumulation over the past 50 days. More time is needed for it to possibly form a new base and for a new pivot point to be noted.
|
|
|
Color Codes Explained :
Y - Better candidates highlighted by our
staff of experts.
G - Previously featured
in past reports as yellow but may no longer be buyable under the
guidelines.
***Last / Change / Volume data in this table is the closing quote data***
Symbol/Exchange
Company Name
Industry Group |
PRICE |
CHANGE
(%Change) |
Day High |
Volume
(% DAV)
(% 50 day avg vol) |
52 Wk Hi
% From Hi |
Featured
Date |
Price
Featured |
Pivot Featured |
|
Max Buy |
AL
-
NYSE
Air Lease Corp Cl A
DIVERSIFIED SERVICES - Rental and Leasing Services
|
$30.04
|
+0.01
0.03% |
$30.31
|
314,044
67.83% of 50 DAV
50 DAV is 463,000
|
$31.00
-3.10%
|
5/9/2013
|
$30.95
|
PP = $29.38
|
|
MB = $30.85
|
Most Recent Note - 5/15/2013 1:51:39 PM
Y - Rallying from support at its 50 DMA line and back above its pivot point with today's considerable gain backed by above average volume. Recently reported earnings +38% on +45% sales revenues for the Mar '13 quarter after highlighted in yellow in the 5/09/13 mid-day report (read here) with a pivot point cited based on its 4/09/13 high while rallying from a "double bottom" base.
>>> The latest Featured Stock Update with an annotated graph appeared on 5/9/2013. Click here.
View all notes |
Alert me of new notes |
CANSLIM.net Company Profile |
SEC |
Zacks Reports |
StockTalk |
News |
Chart |
Request a new note
C
A N
S L
I M


|
AMBA
-
NASDAQ
Ambarella Inc
ELECTRONICS - Semiconductor - Specialized
|
$16.90
|
+0.11
0.66% |
$17.90
|
2,062,866
319.73% of 50 DAV
50 DAV is 645,200
|
$17.39
-2.82%
|
5/6/2013
|
$15.31
|
PP = $16.10
|
|
MB = $16.91
|
 Most Recent Note - 5/21/2013 11:57:30 AM
Y - Reversed into the red after hitting new 52-week highs again today. Strong technical action triggered a technical buy signal on the prior session and it has been trading near and above its "max buy" level.
>>> The latest Featured Stock Update with an annotated graph appeared on 5/6/2013. Click here.
View all notes |
Alert me of new notes |
CANSLIM.net Company Profile |
SEC |
Zacks Reports |
StockTalk |
News |
Chart |
Request a new note
C
A N
S L
I M
|
CELG
-
NASDAQ
Celgene Corp
DRUGS - Drug Manufacturers - Major
|
$123.50
|
+0.38
0.31% |
$124.37
|
2,401,866
76.80% of 50 DAV
50 DAV is 3,127,600
|
$131.82
-6.31%
|
3/27/2013
|
$113.24
|
PP = $115.54
|
|
MB = $121.32
|
Most Recent Note - 5/17/2013 12:04:08 PM
G - Pulling back for a 3rd consecutive session, retreating from all-time highs. It is extended from any sound base pattern, yet may go on to produce more climactic gains. Found support at its 50 DMA line during its recent consolidation and that short-term average defines important near-term support to watch.
>>> The latest Featured Stock Update with an annotated graph appeared on 5/13/2013. Click here.
View all notes |
Alert me of new notes |
CANSLIM.net Company Profile |
SEC |
Zacks Reports |
StockTalk |
News |
Chart |
Request a new note
C
A N
S L
I M
|
EQM
-
NYSE
E Q T Midstream Partners
ENERGY - Oil and Gas Pipelines
|
$49.72
|
+0.61
1.24% |
$49.97
|
117,354
136.78% of 50 DAV
50 DAV is 85,800
|
$49.38
0.69%
|
4/25/2013
|
$40.16
|
PP = $40.84
|
|
MB = $42.88
|
Most Recent Note - 5/20/2013 12:15:54 PM
G - Churning heavy volume today while still stubbornly holding its ground near its all-time high, extended from its latest base. Prior highs coincide with its 50 DMA line defining important near-term chart support to watch in the $41 area.
>>> The latest Featured Stock Update with an annotated graph appeared on 5/16/2013. Click here.
View all notes |
Alert me of new notes |
CANSLIM.net Company Profile |
SEC |
Zacks Reports |
StockTalk |
News |
Chart |
Request a new note
C
A N
S L
I M
|
FLT
-
NYSE
Fleetcor Technologies
DIVERSIFIED SERVICES - Business/Management Services
|
$84.01
|
+0.58
0.70% |
$84.31
|
654,588
73.18% of 50 DAV
50 DAV is 894,500
|
$85.56
-1.81%
|
3/21/2013
|
$71.14
|
PP = $73.00
|
|
MB = $76.65
|
Most Recent Note - 5/16/2013 12:09:14 PM
G - Enduring mild distributional pressure near its all-time high, extended from any sound base pattern. Its 50 DMA line and recent low ($70.09) define near-term support where violations would raise more serious concerns and trigger worrisome technical sell signals.
>>> The latest Featured Stock Update with an annotated graph appeared on 5/8/2013. Click here.
View all notes |
Alert me of new notes |
CANSLIM.net Company Profile |
SEC |
Zacks Reports |
StockTalk |
News |
Chart |
Request a new note
C
A N
S L
I M
|
Symbol/Exchange
Company Name
Industry Group |
PRICE |
CHANGE
(%Change) |
Day High |
Volume
(% DAV)
(% 50 day avg vol) |
52 Wk Hi
% From Hi |
Featured
Date |
Price
Featured |
Pivot Featured |
|
Max Buy |
LNKD
-
NYSE
Linkedin Corp Class A
INTERNET - Internet Information Providers
|
$184.31
|
+2.00
1.10% |
$187.30
|
1,650,961
70.22% of 50 DAV
50 DAV is 2,351,000
|
$202.91
-9.17%
|
4/12/2013
|
$182.69
|
PP = $184.25
|
|
MB = $193.46
|
Most Recent Note - 5/21/2013 8:15:22 PM
Y - Consolidating after finding encouraging support at its 50 DMA line. Recent lows in the $171 area define important near-term support above the 4/03/13 low ($165), levels where subsequent violations may raise greater concerns and trigger more worrisome technical sell signals. See the latest FSU analysis for more details and a new annotated graph.
>>> The latest Featured Stock Update with an annotated graph appeared on 5/21/2013. Click here.
View all notes |
Alert me of new notes |
CANSLIM.net Company Profile |
SEC |
Zacks Reports |
StockTalk |
News |
Chart |
Request a new note
C
A N
S L
I M
|
LOPE
-
NASDAQ
Grand Canyon Education
DIVERSIFIED SERVICES - Education and; Training Services
|
$32.80
|
+0.04
0.12% |
$33.03
|
514,189
137.26% of 50 DAV
50 DAV is 374,600
|
$32.78
0.06%
|
5/10/2013
|
$29.03
|
PP = $27.28
|
|
MB = $28.64
|
Most Recent Note - 5/17/2013 4:50:31 PM
G - Added to its spurt of volume-driven gains with today's 4th consecutive gain, getting very extended from prior highs. Stubbornly held its ground since featured in the 5/10/13 mid-day report and in greater detail in the Featured Stock Update (FSU) section following a recent "breakaway gap". Prior highs in the $27 area define initial support to watch on pullbacks.
>>> The latest Featured Stock Update with an annotated graph appeared on 5/10/2013. Click here.
View all notes |
Alert me of new notes |
CANSLIM.net Company Profile |
SEC |
Zacks Reports |
StockTalk |
News |
Chart |
Request a new note
C
A N
S L
I M
|
MRLN
-
NASDAQ
Marlin Business Services
DIVERSIFIED SERVICES - Rental and Leasing Services
|
$23.55
|
-0.19
-0.80% |
$23.95
|
12,254
50.02% of 50 DAV
50 DAV is 24,500
|
$25.97
-9.32%
|
3/15/2013
|
$22.29
|
PP = $23.18
|
|
MB = $24.34
|
Most Recent Note - 5/16/2013 6:07:43 PM
Y - Down again today with lighter but still above average volume, slumping near prior highs in the $23 area and its 50 DMA line defining important chart support to watch. Subsequent violations may raise concerns and trigger technical sell signals.
>>> The latest Featured Stock Update with an annotated graph appeared on 5/2/2013. Click here.
View all notes |
Alert me of new notes |
CANSLIM.net Company Profile |
SEC |
Zacks Reports |
StockTalk |
News |
Chart |
Request a new note
C
A N
S L
I M
|
N
-
NYSE
Netsuite Inc
DIVERSIFIED SERVICES - Business/Management Services
|
$93.78
|
-0.71
-0.75% |
$94.80
|
425,499
121.19% of 50 DAV
50 DAV is 351,100
|
$95.76
-2.07%
|
12/12/2012
|
$64.75
|
PP = $67.12
|
|
MB = $70.48
|
Most Recent Note - 5/15/2013 6:16:26 PM
G - Perched at its all-time high, extended from any sound base while on track for its 6th straight weekly gain. Fundamentally, concerns were raised by 2 consecutive quarterly comparisons with earnings below the minimum guideline (C criteria). See the latest FSU analysis for more details and a new annotated weekly graph.
>>> The latest Featured Stock Update with an annotated graph appeared on 5/15/2013. Click here.
View all notes |
Alert me of new notes |
CANSLIM.net Company Profile |
SEC |
Zacks Reports |
StockTalk |
News |
Chart |
Request a new note
C
A N
S L
I M
|
NSM
-
NYSE
Nationstar Mtg Hldgs Inc
FINANCIAL SERVICES - Credit Services
|
$45.38
|
-0.23
-0.50% |
$46.24
|
907,473
74.26% of 50 DAV
50 DAV is 1,222,000
|
$46.91
-3.26%
|
5/7/2013
|
$39.71
|
PP = $42.34
|
|
MB = $44.46
|
Most Recent Note - 5/20/2013 5:48:59 PM
G - Edged higher with slightly above average volume behind another gain. Stubbornly holding its ground above prior highs in the $42 area defining initial chart support to watch on pullbacks.
>>> The latest Featured Stock Update with an annotated graph appeared on 5/7/2013. Click here.
View all notes |
Alert me of new notes |
CANSLIM.net Company Profile |
SEC |
Zacks Reports |
StockTalk |
News |
Chart |
Request a new note
C
A N
S L
I M
|
Symbol/Exchange
Company Name
Industry Group |
PRICE |
CHANGE
(%Change) |
Day High |
Volume
(% DAV)
(% 50 day avg vol) |
52 Wk Hi
% From Hi |
Featured
Date |
Price
Featured |
Pivot Featured |
|
Max Buy |
PRAA
-
NASDAQ
Portfolio Recovery Assoc
DIVERSIFIED SERVICES - Business/Management Services
|
$147.27
|
+0.04
0.03% |
$148.36
|
65,953
93.15% of 50 DAV
50 DAV is 70,800
|
$151.51
-2.80%
|
5/1/2013
|
$130.77
|
PP = $127.88
|
|
MB = $134.27
|
Most Recent Note - 5/17/2013 12:20:50 PM
G - Small loss on the prior session ended an impressive streak of 13 consecutive gains into new high territory. It is very extended from prior highs in the $127 area coinciding with its 50 DMA line defining important chart support.
>>> The latest Featured Stock Update with an annotated graph appeared on 5/1/2013. Click here.
View all notes |
Alert me of new notes |
CANSLIM.net Company Profile |
SEC |
Zacks Reports |
StockTalk |
News |
Chart |
Request a new note
C
A N
S L
I M
|
PRLB
-
NYSE
Proto Labs Inc
MANUFACTURING - Small Tools and Accessories
|
$55.99
|
-0.12
-0.21% |
$56.60
|
232,917
41.94% of 50 DAV
50 DAV is 555,300
|
$59.84
-6.43%
|
5/3/2013
|
$54.77
|
PP = $54.01
|
|
MB = $56.71
|
Most Recent Note - 5/15/2013 12:49:48 PM
Y - Gapped down today, retreating below its "max buy" level and its color code is changed to yellow. Prior highs in the $54-55 area define support to watch above its 50 DMA line.
>>> The latest Featured Stock Update with an annotated graph appeared on 5/3/2013. Click here.
View all notes |
Alert me of new notes |
CANSLIM.net Company Profile |
SEC |
Zacks Reports |
StockTalk |
News |
Chart |
Request a new note
C
A N
S L
I M
|
RRTS
-
NYSE
Roadrunner Trans Systems
TRANSPORTATION - Air Delivery and Freight Service
|
$27.00
|
-0.07
-0.26% |
$27.28
|
147,891
71.55% of 50 DAV
50 DAV is 206,700
|
$27.49
-1.78%
|
4/3/2013
|
$22.77
|
PP = $23.75
|
|
MB = $24.94
|
Most Recent Note - 5/20/2013 12:28:59 PM
G - Holding its ground perched at its all-time high, extended from the latest base. Prior highs in the $23 area define initial support to watch above its 50 DMA line. Fundamental concerns were raised by its sub par earnings increase in the Mar '13 quarter, below the +25% minimum guideline (C criteria).
>>> The latest Featured Stock Update with an annotated graph appeared on 5/14/2013. Click here.
View all notes |
Alert me of new notes |
CANSLIM.net Company Profile |
SEC |
Zacks Reports |
StockTalk |
News |
Chart |
Request a new note
C
A N
S L
I M
|
VRX
-
NYSE
Valeant Pharmaceuticals
DRUGS - Drug Manufacturers - Other
|
$75.53
|
+0.15
0.20% |
$76.43
|
1,035,670
71.89% of 50 DAV
50 DAV is 1,440,700
|
$78.69
-4.02%
|
4/30/2013
|
$60.24
|
PP = $76.66
|
|
MB = $80.49
|
Most Recent Note - 5/20/2013 5:46:20 PM
Y- Erased the prior session's gain and more with a big loss today on lighter volume. The 50 DMA line and recent low ($69.87 on 4/04/13) define important support where subsequent violations may trigger technical sell signals. Prior reports cautioned - "Sub par earnings for the Mar '13 quarter below the +25% minimum guideline (C criteria) raised fundamental concerns."
>>> The latest Featured Stock Update with an annotated graph appeared on 5/17/2013. Click here.
View all notes |
Alert me of new notes |
CANSLIM.net Company Profile |
SEC |
Zacks Reports |
StockTalk |
News |
Chart |
Request a new note
C
A N
S L
I M
|
|
|
|
THESE ARE NOT BUY RECOMMENDATIONS!
Comments contained in the body of this report are technical
opinions only. The material herein has been obtained
from sources believed to be reliable and accurate, however,
its accuracy and completeness cannot be guaranteed.
This site is not an investment advisor, hence it does
not endorse or recommend any securities or other investments.
Any recommendation contained in this report may not
be suitable for all investors and it is not to be deemed
an offer or solicitation on our part with respect to
the purchase or sale of any securities. All trademarks,
service marks and trade names appearing in this report
are the property of their respective owners, and are
likewise used for identification purposes only.
This report is a service available
only to active Paid Premium Members.
You may opt-out of receiving report notifications
at any time. Questions or comments may be submitted
by writing to Premium Membership Services 665 S.E. 10 Street, Suite 201 Deerfield Beach, FL 33441-5634 or by calling 1-800-965-8307
or 954-785-1121.
|
|
|

