You are not logged in.
This means you
CAN ONLY VIEW reports that were published prior to Saturday, March 29, 2025.
You
MUST UPGRADE YOUR MEMBERSHIP if you want to see any current reports.
AFTER MARKET UPDATE - TUESDAY, MAY 20TH, 2014
Previous After Market Report Next After Market Report >>>
|
|
|
|
DOW |
-137.55 |
16,374.31 |
-0.83% |
|
Volume |
635,242,440 |
+11% |
|
Volume |
1,655,998,510 |
+12% |
|
NASDAQ |
-28.46 |
4,097.36 |
-0.69% |
|
Advancers |
895 |
28% |
|
Advancers |
661 |
23% |
|
S&P 500 |
-12.25 |
1,872.83 |
-0.65% |
|
Decliners |
2,163 |
69% |
|
Decliners |
2,153 |
75% |
|
Russell 2000 |
-16.53 |
1,097.90 |
-1.48% |
|
52 Wk Highs |
79 |
|
|
52 Wk Highs |
31 |
|
|
S&P 600 |
-9.22 |
635.37 |
-1.43% |
|
52 Wk Lows |
39 |
|
|
52 Wk Lows |
69 |
|
|
 |
Major Averages Fell With Higher Volume
Kenneth J. Gruneisen - Passed the CAN SLIM® Master's Exam
On Tuesday the major averages lost ground while the volume was reported higher than the prior session totals on the NYSE and on the Nasdaq exchange, a sign of increased selling efforts coming from the institutional crowd. Breadth was negative as decliners led advancers by more than a 2-1 margin on the NYSE and more than 3-1 on the Nasdaq exchange. Leadership contracted as there were 20 high-ranked companies from the CANSLIM.net Leaders List that made new 52-week highs and appeared on the CANSLIM.net BreakOuts Page, down from the total of 30 stocks on the prior session. New 52-week highs outnumbered new 52-week lows on the NYSE while new lows outnumbered new highs on the Nasdaq exchange. There were gains for 2 of the 6 high-ranked companies currently included on the Featured Stocks Page. It was recently noted that the Dow Jones Industrial Average and S&P 500 Index both tallied gains into new high territory. Technically that is favorable, however, uncertain market action overall has led the newspaper to still hold off from officially shifting its view that the market direction (M criteria) is back in a "confirmed uptrend". While awaiting a more definitive read on the market any new buying efforts should be very selective and only focused in stocks meeting all key criteria of the fact-based investment system. Keep in mind that any sustained and meaningful market advance requires leadership - a healthy crop of stocks hitting new 52-week highs.
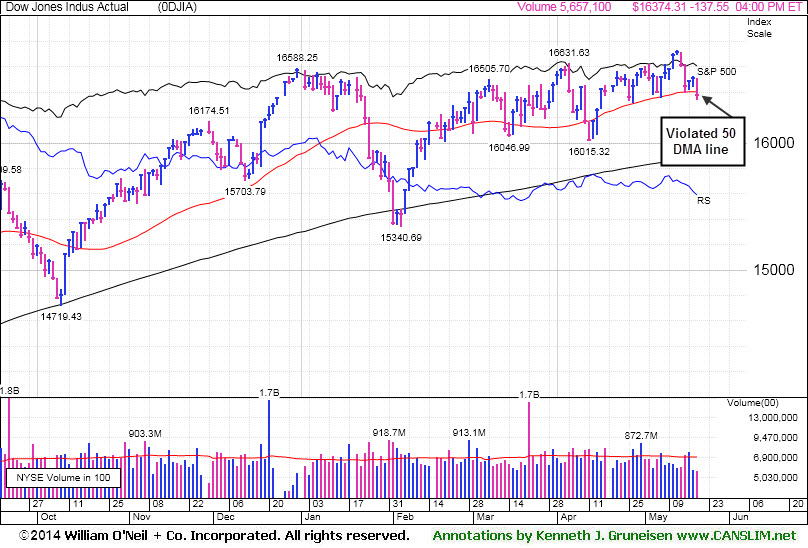
Stocks were lower on Tuesday’s session. The Dow fell 138 points to 16,374. The S&P 500 retreated 12 points to 1,872. The NASDAQ declined 29 points to 4,096.
The major averages finished in negative territory as disappointing earnings by retailers raised concerns over the health of the consumer. Staples (SPLS -12.55%) fell after posting quarterly results below consensus estimates. Dick’s Sporting Goods (DKS -18%) fell on its reduced outlook. TJX Companies (TJX -7.62%) fell following its weaker-than-expected profit release and guidance. Home Depot (HD +1.91%) bucked the downtrend after increasing its full-year forecast.
Stocks extended their pullback following comments by policy makers. During a speech this afternoon, Philadelphia Fed President Charles Plosser indicated the current pace of tapering may be too slow. At a separate event, New York's William Dudley suggested an eventual increase in interest rates will depend on how fast the economy improves.
Nine of 10 sectors were down on the session. Telecom and industrials were the worst performing groups as AT&T (T -2.42%) fell. Shares of Caterpillar (CAT -3.63%) fell after reporting a 13% decline in April sales. Utilities were the lone sector up led by NextEra Energy (NEE +1.72%).
Treasuries rose with the 10-year note up 10/32 to yield 2.51%.
The CANSLIM.net Featured Stocks Page shows the most action-worthy candidates and their latest notes and a Headline Link directs members to the latest detailed analysis with data-packed graphs annotated by a Certified expert along with links to additional resources. The Premium Member Homepage includes "dynamic archives" to all prior pay reports published. Watch for an announcement via email concerning the next WEBCAST.
PICTURED: The Dow Jones Industrial Average violated its 50-day moving average line with a loss on Tuesday.
|
 Kenneth J. Gruneisen started out as a licensed stockbroker in August 1987, a couple of months prior to the historic stock market crash that took the Dow Jones Industrial Average down -22.6% in a single day. He has published daily fact-based fundamental and technical analysis on high-ranked stocks online for two decades. Through FACTBASEDINVESTING.COM, Kenneth provides educational articles, news, market commentary, and other information regarding proven investment systems that work in good times and bad.
Comments contained in the body of this report are technical opinions only and are not necessarily those of Gruneisen Growth Corp. The material herein has been obtained from sources believed to be reliable and accurate, however, its accuracy and completeness cannot be guaranteed. Our firm, employees, and customers may effect transactions, including transactions contrary to any recommendation herein, or have positions in the securities mentioned herein or options with respect thereto. Any recommendation contained in this report may not be suitable for all investors and it is not to be deemed an offer or solicitation on our part with respect to the purchase or sale of any securities. |
|
 |
Retail, Financial, and Tech Groups Led Decliners
Kenneth J. Gruneisen - Passed the CAN SLIM® Master's Exam
The Retail Index ($RLX -0.99%) and financial shares were negative influences on the major averages as the Bank Index ($BKX -0.64%) and the Broker/Dealer Index ($XBD -1.25%) fell on Tuesday. The Biotechnology Index ($BTK -1.81%) led the tech sector lower while the Networking Index ($NWX -1.03%) and the Semiconductor Index ($SOX -0.60%) suffered smaller losses. Commodity-linked groups also had a negative bias as the Gold & Silver Index ($XAU -0.47%), Integrated Oil Index ($XOI -0.56%) and the Oil Services Index ($OSX -0.12%) ended lower.
Charts courtesy www.stockcharts.com
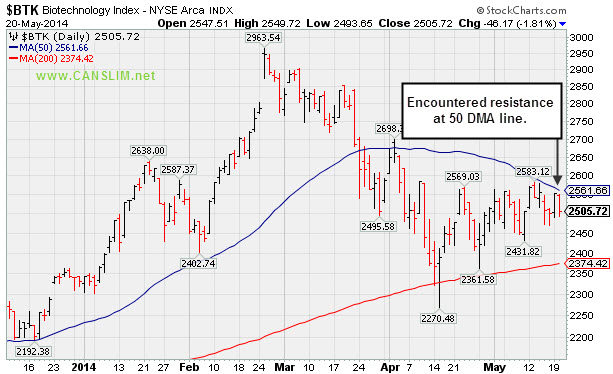
PICTURED: The Biotechnology Index ($BTK -1.81%) recently encountered resistance at its 50-day moving average (DMA) line.
| Oil Services |
$OSX |
284.27 |
-0.34 |
-0.12% |
+1.15% |
| Integrated Oil |
$XOI |
1,600.97 |
-9.03 |
-0.56% |
+6.51% |
| Semiconductor |
$SOX |
578.58 |
-3.47 |
-0.60% |
+8.14% |
| Networking |
$NWX |
329.16 |
-3.43 |
-1.03% |
+1.61% |
| Broker/Dealer |
$XBD |
149.08 |
-1.88 |
-1.25% |
-7.15% |
| Retail |
$RLX |
844.82 |
-8.47 |
-0.99% |
-10.11% |
| Gold & Silver |
$XAU |
88.68 |
-0.42 |
-0.47% |
+5.38% |
| Bank |
$BKX |
67.07 |
-0.43 |
-0.64% |
-3.16% |
| Biotech |
$BTK |
2,505.72 |
-46.17 |
-1.81% |
+7.52% |
|
|
|
 |
Consolidating Above 50 DMA Line Still Perched Near 52-Week High
Kenneth J. Gruneisen - Passed the CAN SLIM® Master's Exam
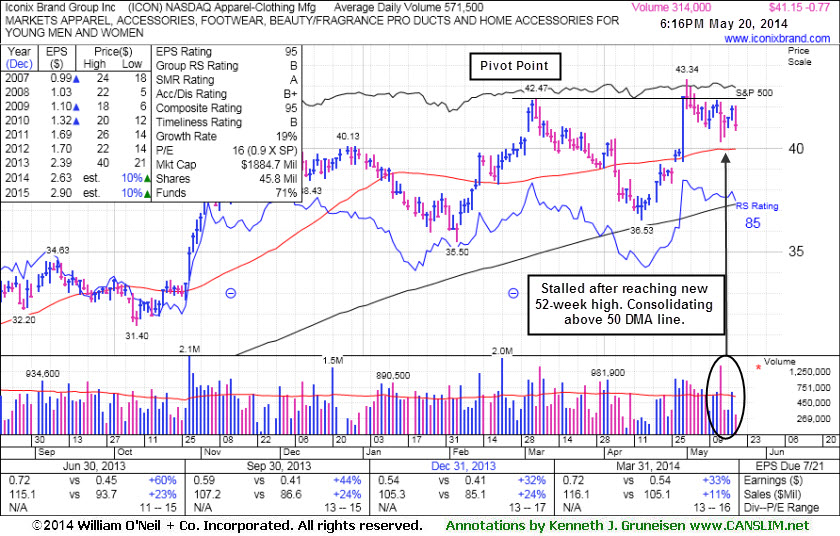
Iconix Brand Group Inc (ICON -$0.77 or -1.84% to $41.15) is consolidating above its 50-day moving average (DMA) line. A violation of that short-term average would raise concerns and trigger a technical sell signal. It reported earnings +33% on +11% sales revenues for the Mar '14 quarter, continuing its streak of earning increases above the +25% minimum guideline (C criteria). Confirming gains above the pivot point with above average volume still could trigger a new (or add-on) technical buy signal. The stock was last shown in this FSU section on 5/07/14 with annotated graphs under the headline, "Stalled After Hitting a New 52-Week High". Little resistance remains due to overhead supply
ICON stalled near its 52-week high following a considerable 4/30/14 volume-driven gain and finish near its pivot point. Confirming gains above the pivot point with at least +40% above average volume could trigger a new (or add-on) technical buy signal. Keep in mind that 3 out of 4 stocks tend to move in the same direction of the major averages (M criteria) and confirming gains from the major averages are still needed as reassurance the broader market is strong. Members are also reminded that disciplined investors always limit losses by selling any stock that falls more than -7% from their purchase price.
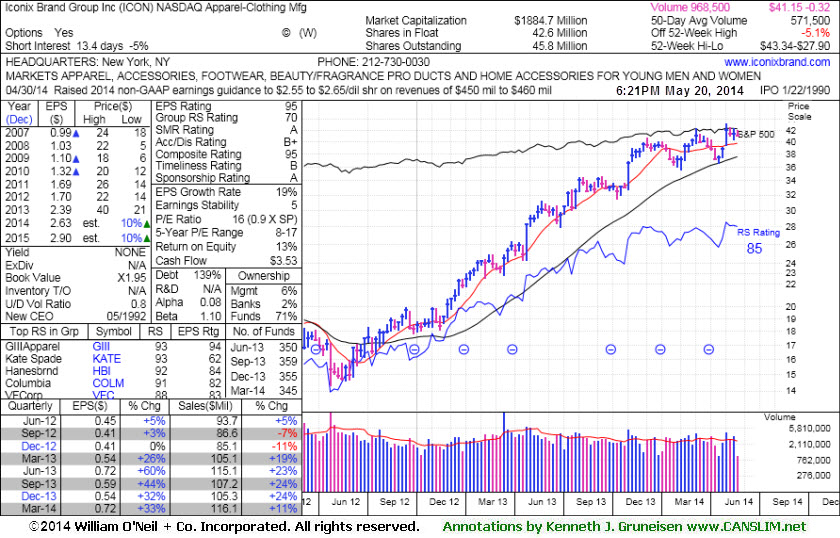
Fundamentals remain strong for the high-ranked Apparel - Clothing Manufacturing firm. Its annual earnings (A criteria) history has been steady. It has earned a 95 Earnings Per Share Rating (EPS) which suggests that its recent earnings growth history has been stellar. Its Relative Strength rating is 85, above the 80+ minimum rank for buy candidates under the fact-based system. The number of top-rated funds owning its shares fell from 359 in Sep '13 to 345 in Mar '14, not a reassuring sign concerning the I criteria.
|
|
|
Color Codes Explained :
Y - Better candidates highlighted by our
staff of experts.
G - Previously featured
in past reports as yellow but may no longer be buyable under the
guidelines.
***Last / Change / Volume data in this table is the closing quote data***
Symbol/Exchange
Company Name
Industry Group |
PRICE |
CHANGE
(%Change) |
Day High |
Volume
(% DAV)
(% 50 day avg vol) |
52 Wk Hi
% From Hi |
Featured
Date |
Price
Featured |
Pivot Featured |
|
Max Buy |
AL
-
NYSE
Air Lease Corp Cl A
DIVERSIFIED SERVICES - Rental and Leasing Services
|
$38.39
|
-0.34
-0.88% |
$38.80
|
784,565
112.72% of 50 DAV
50 DAV is 696,000
|
$40.36
-4.88%
|
5/9/2014
|
$38.27
|
PP = $38.25
|
|
MB = $40.16
|
 Most Recent Note - 5/20/2014 6:37:00 PM
Y - Small loss today with higher volume, slumping near its pivot point and prior highs near $38 defining near-term support to watch on pullbacks.
>>> FEATURED STOCK ARTICLE : Volume Heavy Following Gap Up Gain for New 52-Week High - 5/9/2014
View all notes |
Set NEW NOTE alert |
CANSLIM.net Company Profile |
SEC
News |
Chart |
Request a new note
C
A N
S L
I M


|
EQM
-
NYSE
E Q T Midstream Partners
ENERGY - Oil and Gas Pipelines
|
$78.07
|
+0.41
0.53% |
$78.11
|
48,656
20.53% of 50 DAV
50 DAV is 237,000
|
$78.67
-0.76%
|
12/12/2013
|
$53.17
|
PP = $56.51
|
|
MB = $59.34
|
Most Recent Note - 5/16/2014 6:15:21 PM
G - Inched higher today for a best ever close with a gain on light volume. Completed a new Public Offering of 10.75 Million common units on 5/01/14. Fundamental concerns remain after 2 consecutive sub par quarters below the +25% minimum earnings guideline. Its 50 DMA line defines near-term support where a violation may trigger a technical sell signal. See the latest FSU analysis for more details and new annotated graphs.
>>> FEATURED STOCK ARTICLE : Best Ever Close With Light Volume Gain - 5/16/2014
View all notes |
Set NEW NOTE alert |
CANSLIM.net Company Profile |
SEC
News |
Chart |
Request a new note
C
A N
S L
I M
|
GRFS
-
NASDAQ
Grifols Sa Ads
Medical-Ethical Drugs
|
$41.96
|
-0.16
-0.38% |
$43.50
|
533,347
86.02% of 50 DAV
50 DAV is 620,000
|
$43.45
-3.43%
|
5/15/2014
|
$41.14
|
PP = $43.55
|
|
MB = $45.73
|
Most Recent Note - 5/19/2014 6:28:14 PM
Y - Tallied a solid gain today with above average volume, approaching the pivot point. This Spanish firm from the Medical- Ethical Drugs industry has little resistance remaining due to overhead supply. Subsequent volume-driven gains for new highs are needed to trigger a technical buy signal.
>>> FEATURED STOCK ARTICLE : Perched Within Close Striking Distance of New Highs - 5/15/2014
View all notes |
Set NEW NOTE alert |
CANSLIM.net Company Profile |
SEC
News |
Chart |
Request a new note
C
A N
S L
I M
|
ICON
-
NASDAQ
Iconix Brand Group Inc
CONSUMER NON-DURABLES - Textile - Apparel Footwear
|
$41.15
|
-0.77
-1.84% |
$42.07
|
314,063
55.00% of 50 DAV
50 DAV is 571,000
|
$43.34
-5.05%
|
4/30/2014
|
$42.50
|
PP = $42.57
|
|
MB = $44.70
|
Most Recent Note - 5/20/2014 6:41:05 PM
Y - Consolidating above its 50 DMA line. A violation of that short-term average would raise concerns and trigger a technical sell signal. Confirming gains above the pivot point with above average volume could trigger a new (or add-on) technical buy signal. See the latest FSU analysis for more details and new annotated graphs.
>>> FEATURED STOCK ARTICLE : Consolidating Above 50 DMA Line Still Perched Near 52-Week High - 5/20/2014
View all notes |
Set NEW NOTE alert |
CANSLIM.net Company Profile |
SEC
News |
Chart |
Request a new note
C
A N
S L
I M
|
TRN
-
NYSE
Trinity Industries Inc
TRANSPORTATION - Railroads
|
$81.55
|
-0.88
-1.07% |
$82.75
|
1,138,293
88.93% of 50 DAV
50 DAV is 1,280,000
|
$82.85
-1.57%
|
4/30/2014
|
$75.57
|
PP = $76.05
|
|
MB = $79.85
|
Most Recent Note - 5/20/2014 6:38:11 PM
G - Extended from any sound base. Prior highs in the $75-76 area define near-term support to watch on pullbacks.
>>> FEATURED STOCK ARTICLE : Rose Beyond "Max Buy" Level With 7th Consecutive Gain - 5/12/2014
View all notes |
Set NEW NOTE alert |
CANSLIM.net Company Profile |
SEC
News |
Chart |
Request a new note
C
A N
S L
I M
|
Symbol/Exchange
Company Name
Industry Group |
PRICE |
CHANGE
(%Change) |
Day High |
Volume
(% DAV)
(% 50 day avg vol) |
52 Wk Hi
% From Hi |
Featured
Date |
Price
Featured |
Pivot Featured |
|
Max Buy |
WLK
-
NYSE
Westlake Chemical Corp
CHEMICALS - Specialty Chemicals
|
$76.71
|
+0.49
0.64% |
$77.35
|
877,560
128.30% of 50 DAV
50 DAV is 684,000
|
$77.64
-1.20%
|
4/29/2014
|
$72.79
|
PP = $69.31
|
|
MB = $72.78
|
Most Recent Note - 5/20/2014 6:39:28 PM
G - Hovering near its 52-week high after 3 consecutive gains. Prior highs in the $69 area define near-term support to watch.
>>> FEATURED STOCK ARTICLE : Extended From Base Following Volume Driven Gains - 5/8/2014
View all notes |
Set NEW NOTE alert |
CANSLIM.net Company Profile |
SEC
News |
Chart |
Request a new note
C
A N
S L
I M
|
|
|
|
THESE ARE NOT BUY RECOMMENDATIONS!
Comments contained in the body of this report are technical
opinions only. The material herein has been obtained
from sources believed to be reliable and accurate, however,
its accuracy and completeness cannot be guaranteed.
This site is not an investment advisor, hence it does
not endorse or recommend any securities or other investments.
Any recommendation contained in this report may not
be suitable for all investors and it is not to be deemed
an offer or solicitation on our part with respect to
the purchase or sale of any securities. All trademarks,
service marks and trade names appearing in this report
are the property of their respective owners, and are
likewise used for identification purposes only.
This report is a service available
only to active Paid Premium Members.
You may opt-out of receiving report notifications
at any time. Questions or comments may be submitted
by writing to Premium Membership Services 665 S.E. 10 Street, Suite 201 Deerfield Beach, FL 33441-5634 or by calling 1-800-965-8307
or 954-785-1121.
|
|
|

