You are not logged in.
This means you
CAN ONLY VIEW reports that were published prior to Monday, April 14, 2025.
You
MUST UPGRADE YOUR MEMBERSHIP if you want to see any current reports.
AFTER MARKET UPDATE - MONDAY, MAY 20TH, 2013
Previous After Market Report Next After Market Report >>>
|
|
|
|
DOW |
-19.12 |
15,335.28 |
-0.12% |
|
Volume |
653,188,690 |
-23% |
|
Volume |
1,683,780,420 |
-5% |
|
NASDAQ |
-2.54 |
3,496.43 |
-0.07% |
|
Advancers |
1,724 |
55% |
|
Advancers |
1,364 |
53% |
|
S&P 500 |
-1.18 |
1,666.29 |
-0.07% |
|
Decliners |
1,299 |
41% |
|
Decliners |
1,126 |
43% |
|
Russell 2000 |
+1.70 |
997.98 |
+0.17% |
|
52 Wk Highs |
486 |
|
|
52 Wk Highs |
282 |
|
|
S&P 600 |
+1.16 |
561.76 |
+0.21% |
|
52 Wk Lows |
24 |
|
|
52 Wk Lows |
12 |
|
|
 |
Major Averages Ended With Small Losses on Lighter Volume Totals
Kenneth J. Gruneisen - Passed the CAN SLIM® Master's Exam
The major averages finished modestly lower in a choppy session. Monday's volume totals were reported lighter than the prior session total on the Nasdaq exchange and on the NYSE. Breadth was positive as advancers led decliners by almost a 3-2 margin on the NYSE but advancers led decliners by a narrower 7-6 margin on the Nasdaq exchange. There were 122 high-ranked companies from the CANSLIM.net Leaders List making new 52-week highs and appearing on the CANSLIM.net BreakOuts Page, up from the prior session total of 109 stocks. The new 52-week highs totals expanded while new highs easily outnumbered new 52-week lows on both the NYSE and the Nasdaq exchange. There were gains for just 7 of the 15 high-ranked companies currently included on the Featured Stocks Page.
Sector action on the S&P was mixed with energy stocks leading to the upside. Shares of Apache Corp (APA +3.42%) rallied as crude oil prices advanced +0.7% to $96.72 per barrel. On the earnings front, shares of Campbell's Soup Co (CPB -3.88%) fell despite posting better than expected earnings and revenues in the quarter. Also among earnings, JA Solar Holdings Co Ltd (JASO +70.37%) spiked higher following their quarterly profit tally. In other news, smartphone display supplier Universal Display Corp (PANL +2.37%) rose on reports that Apple was testing displays for an iWatch device.
Turning to fixed income markets, Treasuries were lower along the curve. The benchmark 10-year note was down 5/32 to yield 1.97% and the 30-year bond gave up 3/16 of a point to yield 3.18%.
The market (M criteria) continues to show healthy leadership with many stocks hitting new 52-week highs reassuring investors a confirmed uptrend is currently at hand. Watch for new stocks featured in the CANSLIM.net Mid-Day BreakOuts Report. Action-worthy leaders are covered on an ongoing basis with the latest notes and additional resource links included on the Featured Stocks Page. Watch for an announcement via email concerning the next WEBCAST. The webcast will also be available via an updated link highlighted at the top of the Premium Member Homepage.
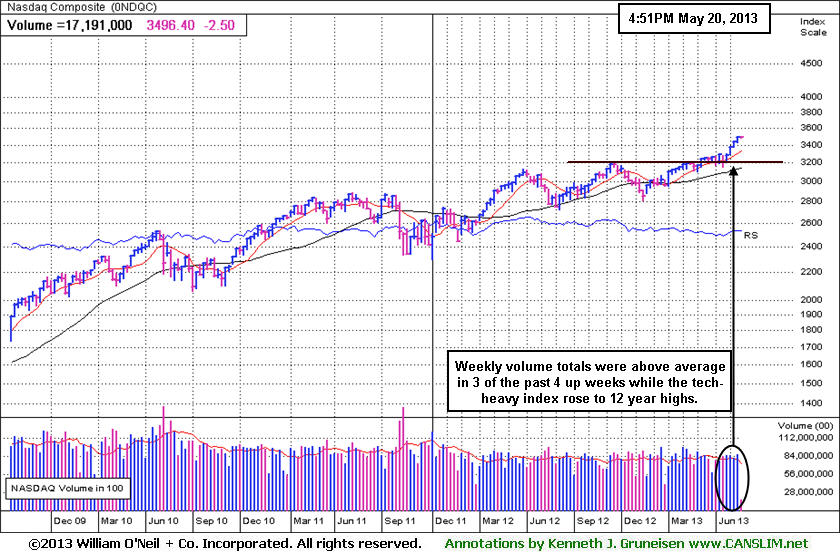
PICTURED: The Nasdaq Composite Index's weekly volume totals were above average in 3 of the past 4 consecutive up weeks while the tech-heavy index rallied to 12-year highs. It is up +15.8% year-to-date. The indices' rally to new highs confirmed the market's uptrend which means odds are favorable for new buying efforts in stocks meeting all of the fact-based investment system's key criteria.
|
 Kenneth J. Gruneisen started out as a licensed stockbroker in August 1987, a couple of months prior to the historic stock market crash that took the Dow Jones Industrial Average down -22.6% in a single day. He has published daily fact-based fundamental and technical analysis on high-ranked stocks online for two decades. Through FACTBASEDINVESTING.COM, Kenneth provides educational articles, news, market commentary, and other information regarding proven investment systems that work in good times and bad.
Comments contained in the body of this report are technical opinions only and are not necessarily those of Gruneisen Growth Corp. The material herein has been obtained from sources believed to be reliable and accurate, however, its accuracy and completeness cannot be guaranteed. Our firm, employees, and customers may effect transactions, including transactions contrary to any recommendation herein, or have positions in the securities mentioned herein or options with respect thereto. Any recommendation contained in this report may not be suitable for all investors and it is not to be deemed an offer or solicitation on our part with respect to the purchase or sale of any securities. |
|
 |
Financial and Commodity-Linked Gains Outweighed by Other Weakness
Kenneth J. Gruneisen - Passed the CAN SLIM® Master's Exam
The Gold & Silver Index ($XAU +5.71%) rebounded off of fresh multi-year lows with a big gain on Monday. Financial shares were a positive influence as the Bank Index ($BKX +0.49%) and Broker/Dealer Index ($XBD +0.30%) posted small gains. Energy-related shares also had a positive bias as the Integrated Oil Index ($XOI +0.89%) and the Oil Services Index ($OSX +0.94%) rose. The Retail Index ($RLX -0.06%) finished flat and the Internet Index ($IIX +0.27%) eked out a tiny gain. Meanwhile, the Healthcare Index ($HMO -1.20%) slumped, and the tech sector was mostly lower as the Networking Index ($NWX -0.73%), Biotechnology Index ($BTK -0.44%), and the Semiconductor Index ($SOX -0.32%) fell.
Charts courtesy www.stockcharts.com
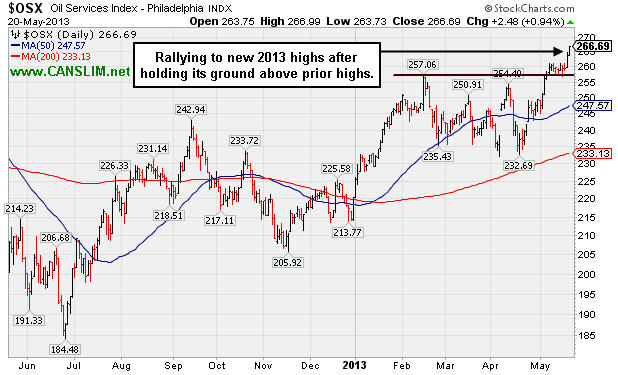
PICTURED: The Oil Services Index ($OSX +0.94%) is rallying to new 2013 highs after holding its ground above prior highs.
| Oil Services |
$OSX |
266.69 |
+2.48 |
+0.94% |
+21.13% |
| Healthcare |
$HMO |
3,079.68 |
-37.44 |
-1.20% |
+22.49% |
| Integrated Oil |
$XOI |
1,419.60 |
+12.56 |
+0.89% |
+14.32% |
| Semiconductor |
$SOX |
469.12 |
-1.51 |
-0.32% |
+22.15% |
| Networking |
$NWX |
245.24 |
-1.80 |
-0.73% |
+8.25% |
| Internet |
$IIX |
389.47 |
+1.03 |
+0.27% |
+19.10% |
| Broker/Dealer |
$XBD |
125.54 |
+0.38 |
+0.30% |
+33.09% |
| Retail |
$RLX |
793.03 |
-0.47 |
-0.06% |
+21.43% |
| Gold & Silver |
$XAU |
103.06 |
+5.57 |
+5.71% |
-37.77% |
| Bank |
$BKX |
61.43 |
+0.30 |
+0.49% |
+19.79% |
| Biotech |
$BTK |
1,997.79 |
-8.81 |
-0.44% |
+29.14% |
|
|
|
 |
Following Fundamental Flaws Technical Weakness Developing
Kenneth J. Gruneisen - Passed the CAN SLIM® Master's Exam
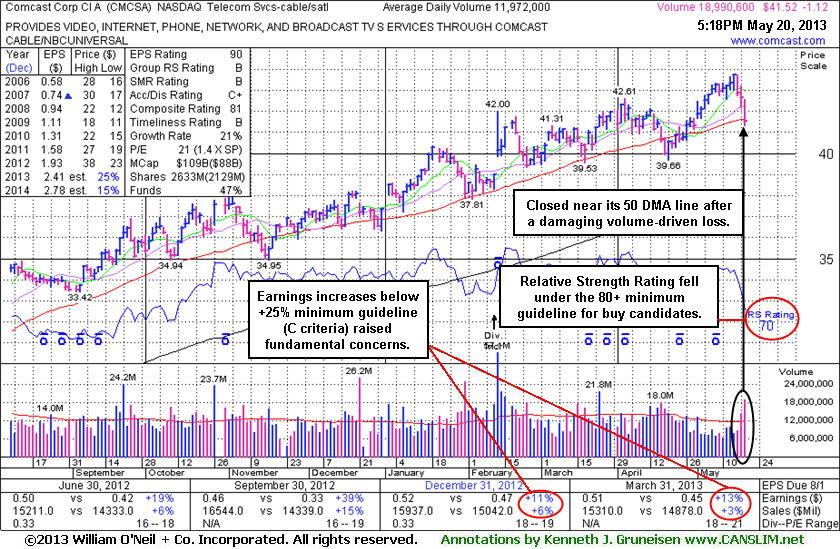
Comcast Corp Cl A (CMCSA -$1.12 or -2.63% to $41.52) slumped to a close just below its 50-day moving average line today with a damaging loss backed by above average volume. Despite fundamental concerns recently noted it had been holding its ground near its 52-week high with volume totals cooling in recent weeks. The loss today on heavier volume hinted that at least some institutional investors were heading for the exit. Its Relative Strength Rating has slumped to 70, well below the 80+ minimum guideline for buy candidates. It may likely find support near its short-term average, however, due to fundamental and technical concerns it will be dropped from the Featured Stocks list tonight.
The Telecom Services - Cable/Satellite firm's annual earnings (A criteria) history has been strong and leadership from other firms in the industry group is a reassuring sign concerning the L criteria. The number of top-rated funds owning its shares rose from 1,916 in Jun '11 to 2,303 in Mar '13, a reassuring sign concerning the I criteria. Its huge supply of 2.097 billion shares in the float could make it less likely to be a great sprinter, meanwhile, the S criteria calls for investors to usually look at small-cap or mid-cap companies. Comcast recently reported earnings +13% on +3% sales revenues for the Mar '13 quarter, marking its 2nd consecutive quarterly comparison with earnings well below the +25% minimum guideline (C criteria). It was last shown in this FSU section on 4/16/13 with an annotated graph under the headline, "Fundamental Concerns Remain While Hovering At Highs". Disciplined investors following the fact-based system would likely choose a candidate showing strength and solid earnings increases over one which appears to be faltering.
|
|
|
Color Codes Explained :
Y - Better candidates highlighted by our
staff of experts.
G - Previously featured
in past reports as yellow but may no longer be buyable under the
guidelines.
***Last / Change / Volume data in this table is the closing quote data***
Symbol/Exchange
Company Name
Industry Group |
PRICE |
CHANGE
(%Change) |
Day High |
Volume
(% DAV)
(% 50 day avg vol) |
52 Wk Hi
% From Hi |
Featured
Date |
Price
Featured |
Pivot Featured |
|
Max Buy |
AL
-
NYSE
Air Lease Corp Cl A
DIVERSIFIED SERVICES - Rental and Leasing Services
|
$30.03
|
+0.15
0.50% |
$30.52
|
341,593
72.28% of 50 DAV
50 DAV is 472,600
|
$31.00
-3.13%
|
5/9/2013
|
$30.95
|
PP = $29.38
|
|
MB = $30.85
|
Most Recent Note - 5/15/2013 1:51:39 PM
Y - Rallying from support at its 50 DMA line and back above its pivot point with today's considerable gain backed by above average volume. Recently reported earnings +38% on +45% sales revenues for the Mar '13 quarter after highlighted in yellow in the 5/09/13 mid-day report (read here) with a pivot point cited based on its 4/09/13 high while rallying from a "double bottom" base.
>>> The latest Featured Stock Update with an annotated graph appeared on 5/9/2013. Click here.
View all notes |
Alert me of new notes |
CANSLIM.net Company Profile |
SEC |
Zacks Reports |
StockTalk |
News |
Chart |
Request a new note
C
A N
S L
I M


|
AMBA
-
NASDAQ
Ambarella Inc
ELECTRONICS - Semiconductor - Specialized
|
$16.79
|
+1.55
10.17% |
$17.39
|
3,108,101
507.28% of 50 DAV
50 DAV is 612,700
|
$16.00
4.94%
|
5/6/2013
|
$15.31
|
PP = $16.10
|
|
MB = $16.91
|
 Most Recent Note - 5/20/2013 12:00:03 PM
Y - Gapped up today and rallied to a new 52-week high, rising above its pivot point while already trading 2 times its average daily volume. The strong technical action triggered a technical buy signal and it has quickly sprinted just above its "max buy" level.
>>> The latest Featured Stock Update with an annotated graph appeared on 5/6/2013. Click here.
View all notes |
Alert me of new notes |
CANSLIM.net Company Profile |
SEC |
Zacks Reports |
StockTalk |
News |
Chart |
Request a new note
C
A N
S L
I M
|
CELG
-
NASDAQ
Celgene Corp
DRUGS - Drug Manufacturers - Major
|
$123.12
|
-1.79
-1.43% |
$125.17
|
2,243,116
72.19% of 50 DAV
50 DAV is 3,107,300
|
$131.82
-6.60%
|
3/27/2013
|
$113.24
|
PP = $115.54
|
|
MB = $121.32
|
Most Recent Note - 5/17/2013 12:04:08 PM
G - Pulling back for a 3rd consecutive session, retreating from all-time highs. It is extended from any sound base pattern, yet may go on to produce more climactic gains. Found support at its 50 DMA line during its recent consolidation and that short-term average defines important near-term support to watch.
>>> The latest Featured Stock Update with an annotated graph appeared on 5/13/2013. Click here.
View all notes |
Alert me of new notes |
CANSLIM.net Company Profile |
SEC |
Zacks Reports |
StockTalk |
News |
Chart |
Request a new note
C
A N
S L
I M
|
CMCSA
-
NASDAQ
Comcast Corp Cl A
MEDIA - CATV Systems
|
$41.52
|
-1.12
-2.63% |
$42.56
|
19,027,172
161.08% of 50 DAV
50 DAV is 11,812,100
|
$43.74
-5.08%
|
12/3/2012
|
$37.08
|
PP = $38.06
|
|
MB = $39.96
|
Most Recent Note - 5/20/2013 5:44:18 PM
Slumped to a close just below its 50 DMA line with above average volume behind a damaging loss. Due to fundamental and technical deterioration it will be dropped from the Featured Stocks list tonight. See the latest FSU analysis for more details and a new annotated graph.
>>> The latest Featured Stock Update with an annotated graph appeared on 5/20/2013. Click here.
View all notes |
Alert me of new notes |
CANSLIM.net Company Profile |
SEC |
Zacks Reports |
StockTalk |
News |
Chart |
Request a new note
C
A N
S L
I M
|
EQM
-
NYSE
E Q T Midstream Partners
ENERGY - Oil and Gas Pipelines
|
$49.11
|
+0.42
0.86% |
$49.38
|
294,435
357.76% of 50 DAV
50 DAV is 82,300
|
$49.10
0.02%
|
4/25/2013
|
$40.16
|
PP = $40.84
|
|
MB = $42.88
|
Most Recent Note - 5/20/2013 12:15:54 PM
G - Churning heavy volume today while still stubbornly holding its ground near its all-time high, extended from its latest base. Prior highs coincide with its 50 DMA line defining important near-term chart support to watch in the $41 area.
>>> The latest Featured Stock Update with an annotated graph appeared on 5/16/2013. Click here.
View all notes |
Alert me of new notes |
CANSLIM.net Company Profile |
SEC |
Zacks Reports |
StockTalk |
News |
Chart |
Request a new note
C
A N
S L
I M
|
Symbol/Exchange
Company Name
Industry Group |
PRICE |
CHANGE
(%Change) |
Day High |
Volume
(% DAV)
(% 50 day avg vol) |
52 Wk Hi
% From Hi |
Featured
Date |
Price
Featured |
Pivot Featured |
|
Max Buy |
FLT
-
NYSE
Fleetcor Technologies
DIVERSIFIED SERVICES - Business/Management Services
|
$83.43
|
+1.38
1.68% |
$83.67
|
1,011,369
109.54% of 50 DAV
50 DAV is 923,300
|
$85.56
-2.49%
|
3/21/2013
|
$71.14
|
PP = $73.00
|
|
MB = $76.65
|
Most Recent Note - 5/16/2013 12:09:14 PM
G - Enduring mild distributional pressure near its all-time high, extended from any sound base pattern. Its 50 DMA line and recent low ($70.09) define near-term support where violations would raise more serious concerns and trigger worrisome technical sell signals.
>>> The latest Featured Stock Update with an annotated graph appeared on 5/8/2013. Click here.
View all notes |
Alert me of new notes |
CANSLIM.net Company Profile |
SEC |
Zacks Reports |
StockTalk |
News |
Chart |
Request a new note
C
A N
S L
I M
|
LNKD
-
NYSE
Linkedin Corp Class A
INTERNET - Internet Information Providers
|
$182.31
|
-0.04
-0.02% |
$185.24
|
1,583,100
67.57% of 50 DAV
50 DAV is 2,342,800
|
$202.91
-10.15%
|
4/12/2013
|
$182.69
|
PP = $184.25
|
|
MB = $193.46
|
Most Recent Note - 5/15/2013 12:27:18 PM
Y - Rebounded above its 50 DMA line helping its technical stance improve, and on track for a 3rd consecutive gain with ever-increasing volume. Recent lows in the $171 area define important near-term support above the 4/03/13 low ($165), levels where subsequent violations may raise greater concerns and trigger more worrisome technical sell signals.
>>> The latest Featured Stock Update with an annotated graph appeared on 4/29/2013. Click here.
View all notes |
Alert me of new notes |
CANSLIM.net Company Profile |
SEC |
Zacks Reports |
StockTalk |
News |
Chart |
Request a new note
C
A N
S L
I M
|
LOPE
-
NASDAQ
Grand Canyon Education
DIVERSIFIED SERVICES - Education and; Training Services
|
$32.76
|
+0.51
1.58% |
$32.78
|
450,280
121.60% of 50 DAV
50 DAV is 370,300
|
$32.60
0.49%
|
5/10/2013
|
$29.03
|
PP = $27.28
|
|
MB = $28.64
|
Most Recent Note - 5/17/2013 4:50:31 PM
G - Added to its spurt of volume-driven gains with today's 4th consecutive gain, getting very extended from prior highs. Stubbornly held its ground since featured in the 5/10/13 mid-day report and in greater detail in the Featured Stock Update (FSU) section following a recent "breakaway gap". Prior highs in the $27 area define initial support to watch on pullbacks.
>>> The latest Featured Stock Update with an annotated graph appeared on 5/10/2013. Click here.
View all notes |
Alert me of new notes |
CANSLIM.net Company Profile |
SEC |
Zacks Reports |
StockTalk |
News |
Chart |
Request a new note
C
A N
S L
I M
|
MRLN
-
NASDAQ
Marlin Business Services
DIVERSIFIED SERVICES - Rental and Leasing Services
|
$23.74
|
-0.16
-0.67% |
$23.75
|
9,616
38.46% of 50 DAV
50 DAV is 25,000
|
$25.97
-8.59%
|
3/15/2013
|
$22.29
|
PP = $23.18
|
|
MB = $24.34
|
Most Recent Note - 5/16/2013 6:07:43 PM
Y - Down again today with lighter but still above average volume, slumping near prior highs in the $23 area and its 50 DMA line defining important chart support to watch. Subsequent violations may raise concerns and trigger technical sell signals.
>>> The latest Featured Stock Update with an annotated graph appeared on 5/2/2013. Click here.
View all notes |
Alert me of new notes |
CANSLIM.net Company Profile |
SEC |
Zacks Reports |
StockTalk |
News |
Chart |
Request a new note
C
A N
S L
I M
|
N
-
NYSE
Netsuite Inc
DIVERSIFIED SERVICES - Business/Management Services
|
$94.49
|
-0.56
-0.59% |
$95.35
|
407,496
117.57% of 50 DAV
50 DAV is 346,600
|
$95.76
-1.33%
|
12/12/2012
|
$64.75
|
PP = $67.12
|
|
MB = $70.48
|
Most Recent Note - 5/15/2013 6:16:26 PM
G - Perched at its all-time high, extended from any sound base while on track for its 6th straight weekly gain. Fundamentally, concerns were raised by 2 consecutive quarterly comparisons with earnings below the minimum guideline (C criteria). See the latest FSU analysis for more details and a new annotated weekly graph.
>>> The latest Featured Stock Update with an annotated graph appeared on 5/15/2013. Click here.
View all notes |
Alert me of new notes |
CANSLIM.net Company Profile |
SEC |
Zacks Reports |
StockTalk |
News |
Chart |
Request a new note
C
A N
S L
I M
|
Symbol/Exchange
Company Name
Industry Group |
PRICE |
CHANGE
(%Change) |
Day High |
Volume
(% DAV)
(% 50 day avg vol) |
52 Wk Hi
% From Hi |
Featured
Date |
Price
Featured |
Pivot Featured |
|
Max Buy |
NSM
-
NYSE
Nationstar Mtg Hldgs Inc
FINANCIAL SERVICES - Credit Services
|
$45.61
|
+0.29
0.64% |
$46.01
|
1,399,554
113.06% of 50 DAV
50 DAV is 1,237,900
|
$46.91
-2.77%
|
5/7/2013
|
$39.71
|
PP = $42.34
|
|
MB = $44.46
|
Most Recent Note - 5/20/2013 5:48:59 PM
G - Edged higher with slightly above average volume behind another gain. Stubbornly holding its ground above prior highs in the $42 area defining initial chart support to watch on pullbacks.
>>> The latest Featured Stock Update with an annotated graph appeared on 5/7/2013. Click here.
View all notes |
Alert me of new notes |
CANSLIM.net Company Profile |
SEC |
Zacks Reports |
StockTalk |
News |
Chart |
Request a new note
C
A N
S L
I M
|
PRAA
-
NASDAQ
Portfolio Recovery Assoc
DIVERSIFIED SERVICES - Business/Management Services
|
$147.23
|
-2.83
-1.89% |
$149.79
|
60,872
86.96% of 50 DAV
50 DAV is 70,000
|
$151.51
-2.82%
|
5/1/2013
|
$130.77
|
PP = $127.88
|
|
MB = $134.27
|
Most Recent Note - 5/17/2013 12:20:50 PM
G - Small loss on the prior session ended an impressive streak of 13 consecutive gains into new high territory. It is very extended from prior highs in the $127 area coinciding with its 50 DMA line defining important chart support.
>>> The latest Featured Stock Update with an annotated graph appeared on 5/1/2013. Click here.
View all notes |
Alert me of new notes |
CANSLIM.net Company Profile |
SEC |
Zacks Reports |
StockTalk |
News |
Chart |
Request a new note
C
A N
S L
I M
|
PRLB
-
NYSE
Proto Labs Inc
MANUFACTURING - Small Tools and Accessories
|
$56.11
|
+0.99
1.80% |
$56.81
|
444,727
81.71% of 50 DAV
50 DAV is 544,300
|
$59.84
-6.23%
|
5/3/2013
|
$54.77
|
PP = $54.01
|
|
MB = $56.71
|
Most Recent Note - 5/15/2013 12:49:48 PM
Y - Gapped down today, retreating below its "max buy" level and its color code is changed to yellow. Prior highs in the $54-55 area define support to watch above its 50 DMA line.
>>> The latest Featured Stock Update with an annotated graph appeared on 5/3/2013. Click here.
View all notes |
Alert me of new notes |
CANSLIM.net Company Profile |
SEC |
Zacks Reports |
StockTalk |
News |
Chart |
Request a new note
C
A N
S L
I M
|
RRTS
-
NYSE
Roadrunner Trans Systems
TRANSPORTATION - Air Delivery and Freight Service
|
$27.07
|
-0.27
-0.99% |
$27.21
|
430,313
216.56% of 50 DAV
50 DAV is 198,700
|
$27.49
-1.53%
|
4/3/2013
|
$22.77
|
PP = $23.75
|
|
MB = $24.94
|
Most Recent Note - 5/20/2013 12:28:59 PM
G - Holding its ground perched at its all-time high, extended from the latest base. Prior highs in the $23 area define initial support to watch above its 50 DMA line. Fundamental concerns were raised by its sub par earnings increase in the Mar '13 quarter, below the +25% minimum guideline (C criteria).
>>> The latest Featured Stock Update with an annotated graph appeared on 5/14/2013. Click here.
View all notes |
Alert me of new notes |
CANSLIM.net Company Profile |
SEC |
Zacks Reports |
StockTalk |
News |
Chart |
Request a new note
C
A N
S L
I M
|
VRX
-
NYSE
Valeant Pharmaceuticals
DRUGS - Drug Manufacturers - Other
|
$75.38
|
-2.79
-3.57% |
$78.69
|
1,113,303
77.49% of 50 DAV
50 DAV is 1,436,700
|
$78.37
-3.82%
|
4/30/2013
|
$60.24
|
PP = $76.66
|
|
MB = $80.49
|
Most Recent Note - 5/20/2013 5:46:20 PM
Y- Erased the prior session's gain and more with a big loss today on lighter volume. The 50 DMA line and recent low ($69.87 on 4/04/13) define important support where subsequent violations may trigger technical sell signals. Prior reports cautioned - "Sub par earnings for the Mar '13 quarter below the +25% minimum guideline (C criteria) raised fundamental concerns."
>>> The latest Featured Stock Update with an annotated graph appeared on 5/17/2013. Click here.
View all notes |
Alert me of new notes |
CANSLIM.net Company Profile |
SEC |
Zacks Reports |
StockTalk |
News |
Chart |
Request a new note
C
A N
S L
I M
|
Symbol/Exchange
Company Name
Industry Group |
PRICE |
CHANGE
(%Change) |
Day High |
Volume
(% DAV)
(% 50 day avg vol) |
52 Wk Hi
% From Hi |
Featured
Date |
Price
Featured |
Pivot Featured |
|
Max Buy |
|
|
|
THESE ARE NOT BUY RECOMMENDATIONS!
Comments contained in the body of this report are technical
opinions only. The material herein has been obtained
from sources believed to be reliable and accurate, however,
its accuracy and completeness cannot be guaranteed.
This site is not an investment advisor, hence it does
not endorse or recommend any securities or other investments.
Any recommendation contained in this report may not
be suitable for all investors and it is not to be deemed
an offer or solicitation on our part with respect to
the purchase or sale of any securities. All trademarks,
service marks and trade names appearing in this report
are the property of their respective owners, and are
likewise used for identification purposes only.
This report is a service available
only to active Paid Premium Members.
You may opt-out of receiving report notifications
at any time. Questions or comments may be submitted
by writing to Premium Membership Services 665 S.E. 10 Street, Suite 201 Deerfield Beach, FL 33441-5634 or by calling 1-800-965-8307
or 954-785-1121.
|
|
|

