You are not logged in.
This means you
CAN ONLY VIEW reports that were published prior to Monday, April 14, 2025.
You
MUST UPGRADE YOUR MEMBERSHIP if you want to see any current reports.
AFTER MARKET UPDATE - THURSDAY, MAY 20TH, 2010
Previous After Market Report Next After Market Report >>>
|
|
|
|
DOW |
-376.36 |
10,068.01 |
-3.60% |
|
Volume |
2,124,797,490 |
+30% |
|
Volume |
3,287,248,080 |
+30% |
|
NASDAQ |
-94.36 |
2,204.01 |
-4.11% |
|
Advancers |
154 |
5% |
|
Advancers |
230 |
8% |
|
S&P 500 |
-43.46 |
1,071.59 |
-3.90% |
|
Decliners |
3,008 |
94% |
|
Decliners |
2,557 |
90% |
|
Russell 2000 |
-34.36 |
640.04 |
-5.09% |
|
52 Wk Highs |
7 |
|
|
52 Wk Highs |
10 |
|
|
S&P 600 |
-17.81 |
345.06 |
-4.91% |
|
52 Wk Lows |
98 |
|
|
52 Wk Lows |
162 |
|
|
 |
Major Indices Collectively Closed Below 200-Day Average Lines
Adam Sarhan, Contributing Writer,
Stocks got pounded and the major averages collectively sliced below their respective 200-day moving average (DMA) lines and closed near their session lows after a series of lackluster economic reports were released. Volume totals were reported higher on the Nasdaq exchange and the NYSE compared to Wednesday's total, which was a clear sign that institutional investors were dumping stocks even more aggressively. Decliners trumped advancers by a 19-to-1 ratio on the NYSE and an 11-to-1 ratio on the Nasdaq exchange. New 52-week lows outnumbered new 52-week highs on both major exchanges. Leadership was virtually nonexistent on Thursday as there were 0 high-ranked companies from the CANSLIM.net Leaders List that made a new 52-week high and appeared on the CANSLIM.net BreakOuts Page, lower than the 3 issues that appeared on the prior session. It is difficult for the market to rally without a healthy crop of strong leaders.
The major averages sliced below their respective 200 DMA lines as European contagion woes spread and economic data from the US was less than stellar. The two primary European concerns of the day came from Greece and Germany. Several Greek unions went on strike which sparked fear that the $1 trillion bailout was not enough to help allay their concerns. Investors are concerned that the new trading regulations in Germany could spread to other developed nations. In the US, Thursday's economic data added to the worries about the economic recovery. Before Thursday's open, the Labor Department said initial jobless claims grew by +25,000 to +471,000 in the week ended May 15. This was higher than the economists estimate for a decline of -4,000. In addition, the Conference Board's index of leading economic indicators slid in April for the first time since March 2009. It was also interesting to see the euro rally even as equities and a slew of commodities got smacked on Thursday.
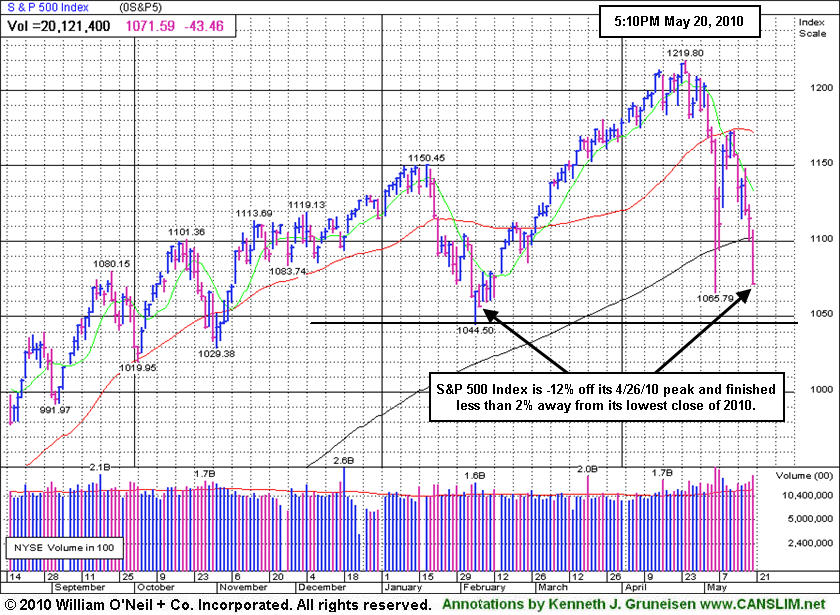
The major averages' deterioration below their respective 200 DMA lines suggests lower prices are likely to follow. Furthermore, the NYSE Composite Index undercut its Thursday, May 6, 2010 low (during the "flash crash") which bodes poorly for this market. In addition, all of the major averages are down over -10% from their late April highs, which is the first time a pullback of that magnitude has occurred since the March 2009 low. On Wednesday, the major averages undercut their recent lows which means the day count was reset and we are now looking for Day 1 of a new rally attempt to occur. What does all of this mean for investors? Simple, the market remains in a correction which reiterates the importance of adopting a strong defense stance until a new rally is confirmed. Trade accordingly.
PICTURED: The S&P 500 Index is now -12% off its April 26, 2010 peak, and it finished less that 2% away from its lowest close of 2010.
|
|
|
 |
Weak Action in Financial, Retail, Technology, and All Defensive Groups
Kenneth J. Gruneisen - Passed the CAN SLIM® Master's Exam
Weakness in financial shares was a significant negative influence on the major averages Thursday as the Bank Index ($BKX -5.09%) and Broker/Dealer Index ($XBD -4.61%) suffered large losses. The Retail Index ($RLX -3.21%) suffered a large loss and the tech sector saw unanimous losses from the Internet Index ($IIX -4.16%), Networking Index ($NWX -4.31%), Biotechnology Index ($BTK -3.58%), and the Semiconductor Index ($SOX -2.92%). Defensive groups provided no safe haven for investors as the Gold & Silver Index ($XAU -4.47%), Oil Services Index ($OSX -5.79%) and Integrated Oil Index ($XOI -3.76%) fell considerably, and the Healthcare Index ($HMO -4.21%) also felt the market's ills.
Charts courtesy www.stockcharts.com
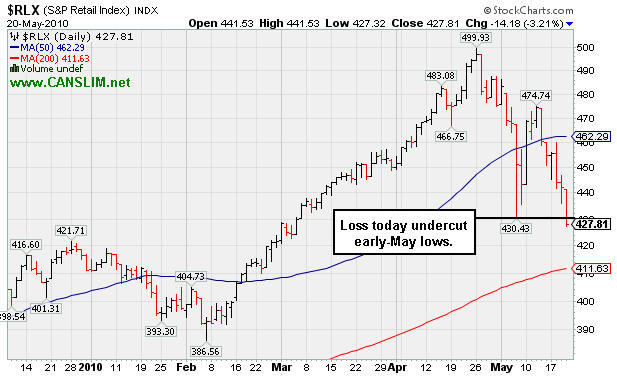
PICTURED: The Retail Index ($RLX -3.21%) suffered another big loss today and undercut its early-May lows.
| Oil Services |
$OSX |
173.82 |
-10.69 |
-5.79% |
-10.82% |
| Healthcare |
$HMO |
1,436.30 |
-63.19 |
-4.21% |
-2.49% |
| Integrated Oil |
$XOI |
951.15 |
-37.16 |
-3.76% |
-10.96% |
| Semiconductor |
$SOX |
340.60 |
-10.24 |
-2.92% |
-5.37% |
| Networking |
$NWX |
233.95 |
-10.55 |
-4.31% |
+1.25% |
| Internet |
$IIX |
229.30 |
-9.95 |
-4.16% |
-1.95% |
| Broker/Dealer |
$XBD |
105.10 |
-5.08 |
-4.61% |
-8.65% |
| Retail |
$RLX |
427.81 |
-14.18 |
-3.21% |
+4.06% |
| Gold & Silver |
$XAU |
164.82 |
-7.71 |
-4.47% |
-2.04% |
| Bank |
$BKX |
48.46 |
-2.60 |
-5.09% |
+13.46% |
| Biotech |
$BTK |
1,045.71 |
-38.78 |
-3.58% |
+10.99% |
|
|
|
 |
Weakness Weighs On Previously Resilient Leader
Kenneth J. Gruneisen - Passed the CAN SLIM® Master's Exam
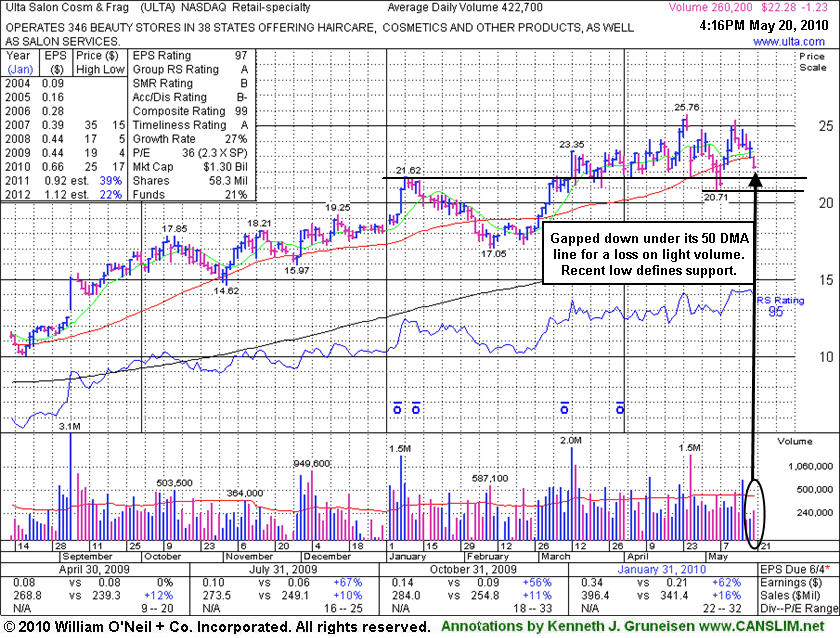
Ulta Salon Cosmetics & Fragrance, Inc. (ULTA -$1.35 or -5.74% to $22.16) gapped down today and the considerable loss on light volume violated its 50-day moving average (DMA) line again, raising concerns. In the past it proved resilient and promptly rebounded above its short-term average. Meanwhile, the recent chart low ($20.71) defines the next important support to watch now, where any violations would raise more serious concerns and trigger additional technical sell signals. ULTA made very little headway since the detailed Stock Bulletin with annotated graph was published soon after it was featured in the 3/12/10 mid-day report (read here) as a considerable gain with heavy volume helped it reach a new 52-week high. It was noted as it rose from an 8-week cup shaped base following stronger results for the quarter ended January 31, 2010.
This high-ranked leader in the Retail - Misc group which has shown accelerating sales revenues increases. Strong quarterly earnings increases above the +25% guideline in the 3 latest quarterly comparisons satisfies the C criteria. The number of top-rated funds with an ownership interest has grown from 49 funds in March '09 to 77 funds as of Mar '10 which is an encouraging sign of increasing institutional interest (the I criteria). Management's 51% ownership stake keeps the company's directors very motivated to look after and build shareholder value. Its current Up/Down Volume Ratio of 1.3 is an unbiased bullish indication concerning its recent action. Until the major averages (M criteria) get their footing and produce a solid follow-through day, the outlook is not favorable enough for new buying efforts under the fact-based system.
|
|
|
Color Codes Explained :
Y - Better candidates highlighted by our
staff of experts.
G - Previously featured
in past reports as yellow but may no longer be buyable under the
guidelines.
***Last / Change / Volume data in this table is the closing quote data***
Symbol/Exchange
Company Name
Industry Group |
PRICE |
CHANGE
(%Change) |
Day High |
Volume
(% DAV)
(% 50 day avg vol) |
52 Wk Hi
% From Hi |
Featured
Date |
Price
Featured |
Pivot Featured |
|
Max Buy |
BIDU
-
NASDAQ
Baidu Inc Ads
INTERNET - Internet Information Providers
|
$67.58
|
-2.55
-3.64% |
$69.62
|
15,682,841
88.12% of 50 DAV
50 DAV is 17,796,700
|
$82.29
-17.88%
|
1/13/2010
|
$43.13
|
PP = $42.68
|
|
MB = $44.81
|
Most Recent Note - 5/18/2010 3:57:35 PM
G - Volume has been cooling, yet today marks the 4th consecutive loss after a worrisome negative reversal from its all-time high on 5/13/10. It is extended from any sound base. Do not be confused as the latest Featured Price, PP and MB levels have been adjusted for a recent 10:1 stock split.
 >>> The latest Featured Stock Update with an annotated graph appeared on 5/14/2010. Click here. >>> The latest Featured Stock Update with an annotated graph appeared on 5/14/2010. Click here.
View all notes |
Alert me of new notes |
CANSLIM.net Company Profile
|
BPI
-
NYSE
Bridgepoint Education
DIVERSIFIED SERVICES - Education and; Training Services
|
$22.76
|
-1.11
-4.65% |
$23.63
|
388,032
78.63% of 50 DAV
50 DAV is 493,500
|
$27.50
-17.24%
|
4/13/2010
|
$25.59
|
PP = $25.76
|
|
MB = $27.05
|
 Most Recent Note - 5/20/2010 3:14:35 PM
G - Gapped down today, slumping further below its 50 DMA line toward recent lows coinciding with its old chart highs near $22 as a very support level to watch.
>>> The latest Featured Stock Update with an annotated graph appeared on 5/7/2010. Click here.
View all notes |
Alert me of new notes |
CANSLIM.net Company Profile
|
BRLI
-
NASDAQ
Bio Reference Labs Inc
HEALTH SERVICES - Medical Laboratories and Researc
|
$21.85
|
-1.02
-4.46% |
$22.65
|
544,105
296.68% of 50 DAV
50 DAV is 183,400
|
$24.67
-11.44%
|
2/12/2010
|
$39.02
|
PP = $20.49
|
|
MB = $21.51
|
Most Recent Note - 5/20/2010 3:22:13 PM
G - Gapped down today, violating its 50 DMA line again with a loss on higher volume, raising concerns.
>>> The latest Featured Stock Update with an annotated graph appeared on 5/11/2010. Click here.
View all notes |
Alert me of new notes |
CANSLIM.net Company Profile
|
CRM
-
NYSE
Salesforce.Com Inc
INTERNET - Internet Software and Services
|
$79.03
|
-2.57
-3.15% |
$81.27
|
4,321,749
244.78% of 50 DAV
50 DAV is 1,765,600
|
$89.84
-12.03%
|
3/5/2010
|
$72.28
|
PP = $75.53
|
|
MB = $79.31
|
Most Recent Note - 5/19/2010 9:07:37 AM
G - Concerns are raised after Microsoft Corp. has sued the company for infringing on nine of its patents. Its gap up on 5/10/10 promptly repaired a brief violation of its 50 DMA line, a sign of great institutional support.
>>> The latest Featured Stock Update with an annotated graph appeared on 5/17/2010. Click here.
View all notes |
Alert me of new notes |
CANSLIM.net Company Profile
|
LL
-
NYSE
Lumber Liquidators Hldgs
RETAIL - Home Improvement Stores
|
$26.90
|
-1.73
-6.04% |
$28.05
|
259,398
69.71% of 50 DAV
50 DAV is 372,100
|
$33.41
-19.49%
|
4/22/2010
|
$29.87
|
PP = $29.03
|
|
MB = $30.48
|
Most Recent Note - 5/20/2010 12:16:23 PM
G - Gapped down today, raising more serious concerns while violating its 50 DMA line and slumping under its December 2009 highs again.
>>> The latest Featured Stock Update with an annotated graph appeared on 5/19/2010. Click here.
View all notes |
Alert me of new notes |
CANSLIM.net Company Profile
|
Symbol/Exchange
Company Name
Industry Group |
PRICE |
CHANGE
(%Change) |
Day High |
Volume
(% DAV)
(% 50 day avg vol) |
52 Wk Hi
% From Hi |
Featured
Date |
Price
Featured |
Pivot Featured |
|
Max Buy |
LOPE
-
NASDAQ
Grand Canyon Education
DIVERSIFIED SERVICES - Education and; Training Services
|
$25.30
|
+0.22
0.88% |
$25.71
|
556,610
148.03% of 50 DAV
50 DAV is 376,000
|
$28.46
-11.10%
|
4/13/2010
|
$27.71
|
PP = $27.33
|
|
MB = $28.70
|
Most Recent Note - 5/18/2010 4:01:35 PM
G - Gapped up today but negatively reversed and closed near the session low as its 50 DMA line acted as resistance. Its 4/29/10 low of $23.66 is the next important chart support.
>>> The latest Featured Stock Update with an annotated graph appeared on 5/10/2010. Click here.
View all notes |
Alert me of new notes |
CANSLIM.net Company Profile
|
MELI
-
NASDAQ
Mercadolibre Inc
INTERNET - Internet Software and; Services
|
$46.33
|
-2.75
-5.60% |
$48.02
|
1,319,834
222.57% of 50 DAV
50 DAV is 593,000
|
$55.75
-16.90%
|
5/13/2010
|
$54.21
|
PP = $55.85
|
|
MB = $58.64
|
Most Recent Note - 5/20/2010 12:13:24 PM
G - Gapped down today for a 6th consecutive loss following a 5/13/10 negative reversal. Its considerable loss has it slumping well below its 50 DMA line toward its recent chart lows and 200 DMA line.
>>> The latest Featured Stock Update with an annotated graph appeared on 5/13/2010. Click here.
View all notes |
Alert me of new notes |
CANSLIM.net Company Profile
|
ROVI
-
NASDAQ
Rovi Corp
COMPUTER SOFTWARE andamp; SERVICES - Security Software andamp; Services
|
$36.88
|
-0.55
-1.47% |
$37.03
|
3,332,208
241.52% of 50 DAV
50 DAV is 1,379,700
|
$40.06
-7.94%
|
4/20/2010
|
$37.62
|
PP = $38.60
|
|
MB = $40.53
|
Most Recent Note - 5/19/2010 4:18:59 PM
G - Still perched near its 52-week high, clear of virtually all chart resistance while today's 4th consecutive small loss on ever-decreasing volume led to a close just below its 50 DMA line. Its recent chart low ($33.17) defines near-term chart support above its 200 DMA line.
>>> The latest Featured Stock Update with an annotated graph appeared on 5/5/2010. Click here.
View all notes |
Alert me of new notes |
CANSLIM.net Company Profile
|
SIRO
-
NASDAQ
Sirona Dental Systems
HEALTH SERVICES - Medical Instruments andamp; Supplies
|
$34.64
|
-1.72
-4.73% |
$36.00
|
773,299
121.24% of 50 DAV
50 DAV is 637,800
|
$43.45
-20.28%
|
2/16/2010
|
$36.43
|
PP = $36.15
|
|
MB = $37.96
|
Most Recent Note - 5/20/2010 4:02:56 PM
G - Gapped down today after its considerable loss on 5/19/10 raised more serious concerns while slumping below prior chart highs in the $36 area previously noted as important support to watch. Its 200 DMA line ($32.63 now) is the next chart support level to watch. Based on weak action it will be dropped from the Featured Stocks list tonight.
>>> The latest Featured Stock Update with an annotated graph appeared on 5/18/2010. Click here.
View all notes |
Alert me of new notes |
CANSLIM.net Company Profile
|
SUMR
-
NASDAQ
Summer Infant Inc
CONSUMER NON-DURABLES - Personal Products
|
$7.26
|
-0.11
-1.49% |
$7.53
|
110,119
208.16% of 50 DAV
50 DAV is 52,900
|
$8.21
-11.57%
|
5/4/2010
|
$6.85
|
PP = $7.09
|
|
MB = $7.44
|
Most Recent Note - 5/20/2010 4:05:52 PM
G - Closed unchanged today after distributional pressure tested prior chart highs which may now act as a support level above its 50 DMA line.
>>> The latest Featured Stock Update with an annotated graph appeared on 5/4/2010. Click here.
View all notes |
Alert me of new notes |
CANSLIM.net Company Profile
|
Symbol/Exchange
Company Name
Industry Group |
PRICE |
CHANGE
(%Change) |
Day High |
Volume
(% DAV)
(% 50 day avg vol) |
52 Wk Hi
% From Hi |
Featured
Date |
Price
Featured |
Pivot Featured |
|
Max Buy |
ULTA
-
NASDAQ
Ulta Salon Cosm & Frag
SPECIALTY RETAIL - Specialty Retail, Other
|
$22.16
|
-1.35
-5.74% |
$22.97
|
313,216
72.87% of 50 DAV
50 DAV is 429,800
|
$25.76
-13.98%
|
3/12/2010
|
$22.81
|
PP = $21.72
|
|
MB = $22.81
|
Most Recent Note - 5/20/2010 12:20:09 PM
G - Gapped down today and violated its 50 DMA line again, raising concerns. Recent chart lows define important support to watch now.
>>> The latest Featured Stock Update with an annotated graph appeared on 5/20/2010. Click here.
View all notes |
Alert me of new notes |
CANSLIM.net Company Profile
|
|
|
|
THESE ARE NOT BUY RECOMMENDATIONS!
Comments contained in the body of this report are technical
opinions only. The material herein has been obtained
from sources believed to be reliable and accurate, however,
its accuracy and completeness cannot be guaranteed.
This site is not an investment advisor, hence it does
not endorse or recommend any securities or other investments.
Any recommendation contained in this report may not
be suitable for all investors and it is not to be deemed
an offer or solicitation on our part with respect to
the purchase or sale of any securities. All trademarks,
service marks and trade names appearing in this report
are the property of their respective owners, and are
likewise used for identification purposes only.
This report is a service available
only to active Paid Premium Members.
You may opt-out of receiving report notifications
at any time. Questions or comments may be submitted
by writing to Premium Membership Services 665 S.E. 10 Street, Suite 201 Deerfield Beach, FL 33441-5634 or by calling 1-800-965-8307
or 954-785-1121.
|
|
|


