You are not logged in.
This means you
CAN ONLY VIEW reports that were published prior to Thursday, April 10, 2025.
You
MUST UPGRADE YOUR MEMBERSHIP if you want to see any current reports.
AFTER MARKET UPDATE - WEDNESDAY, MAY 19TH, 2010
Previous After Market Report Next After Market Report >>>
|
|
|
|
DOW |
-66.58 |
10,444.37 |
-0.63% |
|
Volume |
1,630,657,600 |
+7% |
|
Volume |
2,526,841,350 |
+7% |
|
NASDAQ |
-18.89 |
2,298.37 |
-0.82% |
|
Advancers |
639 |
20% |
|
Advancers |
654 |
23% |
|
S&P 500 |
-5.75 |
1,115.05 |
-0.51% |
|
Decliners |
2,471 |
78% |
|
Decliners |
2,091 |
74% |
|
Russell 2000 |
-8.35 |
674.40 |
-1.22% |
|
52 Wk Highs |
18 |
|
|
52 Wk Highs |
16 |
|
|
S&P 600 |
-3.54 |
362.87 |
-0.97% |
|
52 Wk Lows |
42 |
|
|
52 Wk Lows |
82 |
|
|
 |
Losses End Short-Lived Rally As Indices Fail To Find Footing
Adam Sarhan, Contributing Writer,
US stocks fell even as the euro rallied after investors digested a slew of economic data. Volume totals were reported higher on the Nasdaq and the NYSE compared to Tuesday's total which was not an encouraging sign. Decliners trumped advancers by over a 3-to-1 ratio on the NYSE and the Nasdaq exchange. New 52-week lows outnumbered new 52-week highs on both major exchanges. There were only 3 high-ranked companies from the CANSLIM.net Leaders List that made a new 52-week high and appeared on the CANSLIM.net BreakOuts Page, lower than the 15 issues that appeared on the prior session.
Stocks closed lower as investors reacted to Germany's surprise announcement on Tuesday to ban naked short selling in certain markets. Also, a lower-than-expected report on consumer prices was released. The US consumer price index fell short of expectations which helped allay inflation woes. Elsewhere, the Mortgage Bankers Association (MBA) said foreclosures surged to a new record in the first quarter as uncomfortably high unemployment rates caused homeowners to fall behind on monthly payments. The report also showed that residential foreclosures jumped to +4.63% from +4.58% in the fourth quarter of 2009. Shortly after 2:00PM EST, the minutes of the Federal Reserve's latest meeting were released. Fed officials said they were not in a rush to sell $1.1 trillion of mortgage-backed securities, with a majority of policy makers wanting to wait until they begin raising interest rates before unloading their positions.
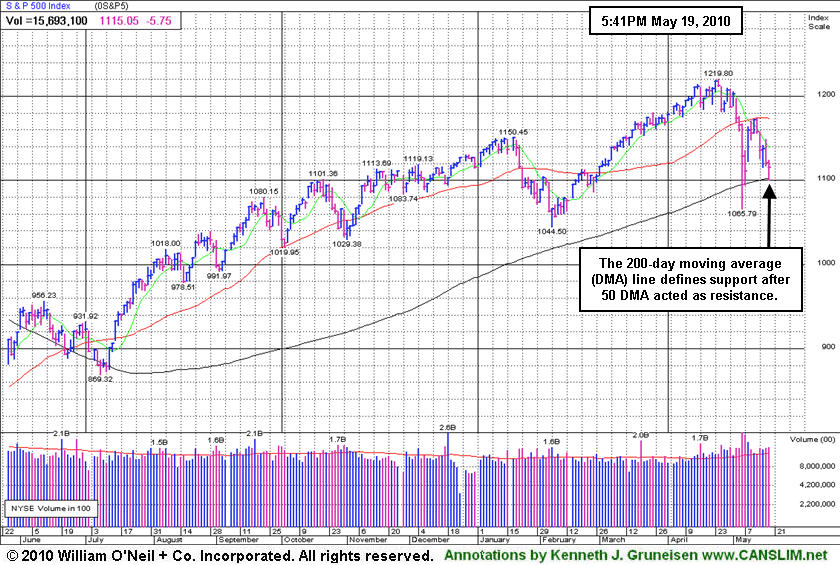
All the major averages sliced below their recent lows which means the day count is reset and we are now looking for Day 1 of a new rally attempt to occur. At this point, the 200 DMA line (i.e. 40 week-moving average) remains a support level to watch for all the major averages while their respective 50 DMA lines have acted as resistance. If the 200 DMA line is breached, on a closing basis, then odds favor lower prices will follow. A rally above the 50 DMA lines would suggest odds were favoring further gains. Until either event occurs, we should expect this sideways action (between the 50 & 200 DMA line) to continue. What does all of this mean for investors? Simple, the market remains in a correction which reiterates the importance of adopting a strong defense stance until a new rally is confirmed. Trade accordingly.
Professional Money Management Services - Free Portfolio Review:
If your portfolio is greater than $100,000 and you would like a free portfolio review, click here to get connected with one of our portfolio managers. ** Serious inquires only, please.
PICTURED: The benchmark S&P 500 Index's 200-day moving average (DMA) line defines support after 50 DMA acted as resistance.
|
|
|
 |
Commodity-Linked Groups Led Decliners
Kenneth J. Gruneisen - Passed the CAN SLIM® Master's Exam
Commodity-linked groups were among Wednesday's worst laggards as the Gold & Silver Index ($XAU -3.48%), Oil Services Index ($OSX -1.41%), and Integrated Oil Index ($XOI -0.51%) finished unanimously lower. Losses for the Internet Index ($IIX -0.85%) and Networking Index ($NWX -0.87%) weighed on the tech-sector while the Biotechnology Index ($BTK -0.05%) held its ground and the Semiconductor Index ($SOX +0.57%) posted a small gain. Modest losses for the Retail Index ($RLX -0.50%) and Healthcare Index ($HMO -0.21%) went along with the mostly negative session. However, it was somewhat encouraging that the Broker/Dealer Index ($XBD +0.72%) managed to post a decent gain.
Charts courtesy www.stockcharts.com

PICTURED: The Bank Index ($BKX -0.35%) has shown weak action in May. The latest pullback leaves it perched above prior resistance and an upward trendline defining support above its 200-day moving average (DMA) line.
| Oil Services |
$OSX |
184.51 |
-2.63 |
-1.41% |
-5.34% |
| Healthcare |
$HMO |
1,499.49 |
-3.14 |
-0.21% |
+1.80% |
| Integrated Oil |
$XOI |
988.30 |
-5.11 |
-0.51% |
-7.48% |
| Semiconductor |
$SOX |
350.84 |
+1.99 |
+0.57% |
-2.52% |
| Networking |
$NWX |
244.49 |
-2.14 |
-0.87% |
+5.81% |
| Internet |
$IIX |
239.25 |
-2.05 |
-0.85% |
+2.30% |
| Broker/Dealer |
$XBD |
110.18 |
+0.79 |
+0.72% |
-4.23% |
| Retail |
$RLX |
441.99 |
-2.22 |
-0.50% |
+7.51% |
| Gold & Silver |
$XAU |
172.53 |
-6.22 |
-3.48% |
+2.54% |
| Bank |
$BKX |
51.06 |
-0.18 |
-0.35% |
+19.55% |
| Biotech |
$BTK |
1,084.49 |
-0.52 |
-0.05% |
+15.11% |
|
|
|
 |
Consolidation Near Prior Highs Defining Support
Kenneth J. Gruneisen - Passed the CAN SLIM® Master's Exam
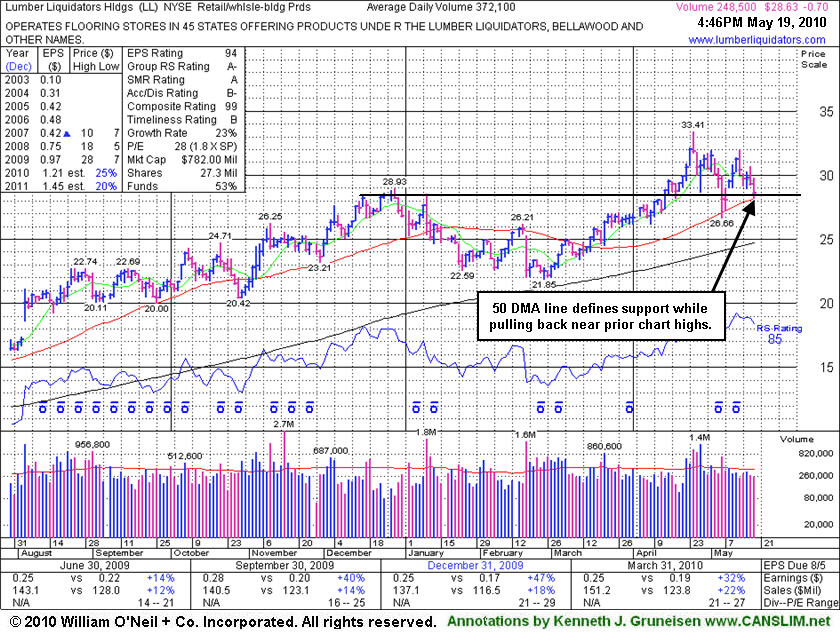
Lumber Liquidators Hldgs (LL -$0.69 or -2.35% to $28.64) is consolidating near its 50-day moving average (DMA) line. Further deterioration would raise concerns and trigger more worrisome technical sell signals. It found support near that short-term average recently and promptly rebounded back above its December 2009 highs. Its last appearance in this FSU section on 4/26/10 under the headline "Negative Reversal Today; Fresh Earnings News Wednesday" illustrated a worrisome "negative reversal" after hitting its $33.41 high. The action was indicative of distributional pressure, as selling offset any new buying efforts. Sequentially, its quarterly comparisons show accelerating sales revenues with earnings above the +25% guideline versus the year ago period in the 3 most current (C criteria) quarters
LL quickly got extended beyond the "max buy" guideline used by disciplined investors after it was recently featured at $29.87 in the 4/22/10 the mid-day report (read here) with a timely note as it was - "rising from an orderly cup shaped pattern (without a proper handle) formed since last noted on 12/17/09. It rallied steadily after a 'breakaway gap' on 8/05/09 helped it clear stubborn resistance in the $17 area. Quarterly sales and earnings increases have recently shown encouraging acceleration while growth rates have previously been noted as below the investment system's guidelines." The number of top-rated funds owning its shares rose from 24 in Dec '09 to 60 in Mar '10, an encouraging sign concerning the I criteria of the fact-based system.
|
|
|
Color Codes Explained :
Y - Better candidates highlighted by our
staff of experts.
G - Previously featured
in past reports as yellow but may no longer be buyable under the
guidelines.
***Last / Change / Volume data in this table is the closing quote data***
Symbol/Exchange
Company Name
Industry Group |
PRICE |
CHANGE
(%Change) |
Day High |
Volume
(% DAV)
(% 50 day avg vol) |
52 Wk Hi
% From Hi |
Featured
Date |
Price
Featured |
Pivot Featured |
|
Max Buy |
BIDU
-
NASDAQ
Baidu Inc Ads
INTERNET - Internet Information Providers
|
$70.13
|
-1.44
-2.01% |
$71.98
|
13,575,459
76.10% of 50 DAV
50 DAV is 17,839,500
|
$82.29
-14.78%
|
1/13/2010
|
$43.13
|
PP = $42.68
|
|
MB = $44.81
|
Most Recent Note - 5/18/2010 3:57:35 PM
G - Volume has been cooling, yet today marks the 4th consecutive loss after a worrisome negative reversal from its all-time high on 5/13/10. It is extended from any sound base. Do not be confused as the latest Featured Price, PP and MB levels have been adjusted for a recent 10:1 stock split.
 >>> The latest Featured Stock Update with an annotated graph appeared on 5/14/2010. Click here. >>> The latest Featured Stock Update with an annotated graph appeared on 5/14/2010. Click here.
View all notes |
Alert me of new notes |
CANSLIM.net Company Profile
|
BPI
-
NYSE
Bridgepoint Education
DIVERSIFIED SERVICES - Education and; Training Services
|
$23.87
|
-0.18
-0.75% |
$24.49
|
1,089,759
221.59% of 50 DAV
50 DAV is 491,800
|
$27.50
-13.20%
|
4/13/2010
|
$25.59
|
PP = $25.76
|
|
MB = $27.05
|
 Most Recent Note - 5/19/2010 5:33:02 PM
G - Loss below its 50 DMA line with higher volume indicates distributional pressure. Recent lows coincide with its old chart highs near $22 as a support level to watch.
>>> The latest Featured Stock Update with an annotated graph appeared on 5/7/2010. Click here.
View all notes |
Alert me of new notes |
CANSLIM.net Company Profile
|
BRLI
-
NASDAQ
Bio Reference Labs Inc
HEALTH SERVICES - Medical Laboratories and Researc
|
$22.87
|
-0.03
-0.13% |
$23.21
|
198,071
106.26% of 50 DAV
50 DAV is 186,400
|
$24.67
-7.31%
|
2/12/2010
|
$39.02
|
PP = $20.49
|
|
MB = $21.51
|
Most Recent Note - 5/18/2010 3:08:37 PM
G - Pulling back for a considerable loss today, testing its 50 DMA line. Promptly rallied last week after violations of its 50 DMA line and 3/26/10 low triggered technical sell signals.
>>> The latest Featured Stock Update with an annotated graph appeared on 5/11/2010. Click here.
View all notes |
Alert me of new notes |
CANSLIM.net Company Profile
|
CISG
-
NASDAQ
Cninsure Inc Ads
INSURANCE - Insurance Brokers
|
$24.15
|
-0.76
-3.05% |
$24.91
|
185,636
77.19% of 50 DAV
50 DAV is 240,500
|
$28.62
-15.62%
|
3/3/2010
|
$24.38
|
PP = $23.10
|
|
MB = $24.26
|
Most Recent Note - 5/19/2010 12:10:46 PM
G - Today marks its 5th consecutive loss while slumping near recent chart lows. Based on weak action it will be dropped from the Featured Stocks list tonight.
>>> The latest Featured Stock Update with an annotated graph appeared on 5/12/2010. Click here.
View all notes |
Alert me of new notes |
CANSLIM.net Company Profile
|
CRM
-
NYSE
Salesforce.Com Inc
INTERNET - Internet Software and Services
|
$81.60
|
-2.56
-3.04% |
$83.74
|
2,645,504
150.63% of 50 DAV
50 DAV is 1,756,300
|
$89.84
-9.17%
|
3/5/2010
|
$72.28
|
PP = $75.53
|
|
MB = $79.31
|
Most Recent Note - 5/19/2010 9:07:37 AM
G - Concerns are raised after Microsoft Corp. has sued the company for infringing on nine of its patents. Its gap up on 5/10/10 promptly repaired a brief violation of its 50 DMA line, a sign of great institutional support.
>>> The latest Featured Stock Update with an annotated graph appeared on 5/17/2010. Click here.
View all notes |
Alert me of new notes |
CANSLIM.net Company Profile
|
Symbol/Exchange
Company Name
Industry Group |
PRICE |
CHANGE
(%Change) |
Day High |
Volume
(% DAV)
(% 50 day avg vol) |
52 Wk Hi
% From Hi |
Featured
Date |
Price
Featured |
Pivot Featured |
|
Max Buy |
LL
-
NYSE
Lumber Liquidators Hldgs
RETAIL - Home Improvement Stores
|
$28.63
|
-0.70
-2.39% |
$29.78
|
249,940
67.10% of 50 DAV
50 DAV is 372,500
|
$33.41
-14.31%
|
4/22/2010
|
$29.87
|
PP = $29.03
|
|
MB = $30.48
|
Most Recent Note - 5/18/2010 3:59:23 PM
G - Consolidating above its 50 DMA line after promptly rebounding back above its December 2009 highs.
>>> The latest Featured Stock Update with an annotated graph appeared on 5/19/2010. Click here.
View all notes |
Alert me of new notes |
CANSLIM.net Company Profile
|
LOPE
-
NASDAQ
Grand Canyon Education
DIVERSIFIED SERVICES - Education and; Training Services
|
$25.08
|
-0.08
-0.32% |
$25.40
|
259,240
69.58% of 50 DAV
50 DAV is 372,600
|
$28.46
-11.88%
|
4/13/2010
|
$27.71
|
PP = $27.33
|
|
MB = $28.70
|
Most Recent Note - 5/18/2010 4:01:35 PM
G - Gapped up today but negatively reversed and closed near the session low as its 50 DMA line acted as resistance. Its 4/29/10 low of $23.66 is the next important chart support.
>>> The latest Featured Stock Update with an annotated graph appeared on 5/10/2010. Click here.
View all notes |
Alert me of new notes |
CANSLIM.net Company Profile
|
MELI
-
NASDAQ
Mercadolibre Inc
INTERNET - Internet Software and; Services
|
$49.08
|
-0.27
-0.55% |
$50.60
|
769,722
131.44% of 50 DAV
50 DAV is 585,600
|
$55.75
-11.96%
|
5/13/2010
|
$54.21
|
PP = $55.85
|
|
MB = $58.64
|
Most Recent Note - 5/18/2010 4:03:30 PM
G - Pulled back near its 50 DMA line, its color code was changed to green. Today marked its 4th consecutive loss following a 5/13/10 negative reversal.
>>> The latest Featured Stock Update with an annotated graph appeared on 5/13/2010. Click here.
View all notes |
Alert me of new notes |
CANSLIM.net Company Profile
|
ROVI
-
NASDAQ
Rovi Corp
COMPUTER SOFTWARE andamp; SERVICES - Security Software andamp; Services
|
$37.43
|
-0.84
-2.19% |
$38.19
|
911,086
66.46% of 50 DAV
50 DAV is 1,370,900
|
$40.06
-6.57%
|
4/20/2010
|
$37.62
|
PP = $38.60
|
|
MB = $40.53
|
Most Recent Note - 5/19/2010 4:18:59 PM
G - Still perched near its 52-week high, clear of virtually all chart resistance while today's 4th consecutive small loss on ever-decreasing volume led to a close just below its 50 DMA line. Its recent chart low ($33.17) defines near-term chart support above its 200 DMA line.
>>> The latest Featured Stock Update with an annotated graph appeared on 5/5/2010. Click here.
View all notes |
Alert me of new notes |
CANSLIM.net Company Profile
|
SIRO
-
NASDAQ
Sirona Dental Systems
HEALTH SERVICES - Medical Instruments andamp; Supplies
|
$36.36
|
-1.12
-2.98% |
$37.90
|
1,104,551
174.66% of 50 DAV
50 DAV is 632,400
|
$43.45
-16.32%
|
2/16/2010
|
$36.43
|
PP = $36.15
|
|
MB = $37.96
|
Most Recent Note - 5/19/2010 12:06:31 PM
G - Considerable loss today raises more serious concerns while slumping below prior chart highs in the $36 area previously noted as important support to watch.
>>> The latest Featured Stock Update with an annotated graph appeared on 5/18/2010. Click here.
View all notes |
Alert me of new notes |
CANSLIM.net Company Profile
|
Symbol/Exchange
Company Name
Industry Group |
PRICE |
CHANGE
(%Change) |
Day High |
Volume
(% DAV)
(% 50 day avg vol) |
52 Wk Hi
% From Hi |
Featured
Date |
Price
Featured |
Pivot Featured |
|
Max Buy |
SUMR
-
NASDAQ
Summer Infant Inc
CONSUMER NON-DURABLES - Personal Products
|
$7.37
|
-0.55
-6.94% |
$8.00
|
84,933
163.65% of 50 DAV
50 DAV is 51,900
|
$8.21
-10.23%
|
5/4/2010
|
$6.85
|
PP = $7.09
|
|
MB = $7.44
|
Most Recent Note - 5/19/2010 4:14:17 PM
G - Loss today on higher volume indicates distributional pressure while pulling back below its "max buy" level. Prior chart highs may now act as a support level along with its 50 DMA line.
>>> The latest Featured Stock Update with an annotated graph appeared on 5/4/2010. Click here.
View all notes |
Alert me of new notes |
CANSLIM.net Company Profile
|
ULTA
-
NASDAQ
Ulta Salon Cosm & Frag
SPECIALTY RETAIL - Specialty Retail, Other
|
$23.51
|
+0.01
0.04% |
$23.97
|
203,269
46.76% of 50 DAV
50 DAV is 434,700
|
$25.76
-8.73%
|
3/12/2010
|
$22.81
|
PP = $21.72
|
|
MB = $22.81
|
Most Recent Note - 5/18/2010 4:22:10 PM
G - After a gap up today it negatively reversed and closed near the session low for a small loss on light volume. Recent rebound above its 50 DMA line and January low was an encouraging sign of support.
>>> The latest Featured Stock Update with an annotated graph appeared on 4/30/2010. Click here.
View all notes |
Alert me of new notes |
CANSLIM.net Company Profile
|
VIT
-
NYSE
Vanceinfo Tech Inc Ads
COMPUTER SOFTWARE and SERVICES - Business Software and Services
|
$19.49
|
-1.44
-6.88% |
$20.77
|
1,275,892
161.44% of 50 DAV
50 DAV is 790,300
|
$26.48
-26.40%
|
4/9/2010
|
$23.79
|
PP = $23.95
|
|
MB = $25.15
|
Most Recent Note - 5/19/2010 11:00:00 AM
G - Down considerably today, slumping under recent lows in the $20 area and approaching its 200 DMA line. Based on weak action it will be dropped from the Featured Stocks list tonight.
>>> The latest Featured Stock Update with an annotated graph appeared on 5/6/2010. Click here.
View all notes |
Alert me of new notes |
CANSLIM.net Company Profile
|
|
|
|
THESE ARE NOT BUY RECOMMENDATIONS!
Comments contained in the body of this report are technical
opinions only. The material herein has been obtained
from sources believed to be reliable and accurate, however,
its accuracy and completeness cannot be guaranteed.
This site is not an investment advisor, hence it does
not endorse or recommend any securities or other investments.
Any recommendation contained in this report may not
be suitable for all investors and it is not to be deemed
an offer or solicitation on our part with respect to
the purchase or sale of any securities. All trademarks,
service marks and trade names appearing in this report
are the property of their respective owners, and are
likewise used for identification purposes only.
This report is a service available
only to active Paid Premium Members.
You may opt-out of receiving report notifications
at any time. Questions or comments may be submitted
by writing to Premium Membership Services 665 S.E. 10 Street, Suite 201 Deerfield Beach, FL 33441-5634 or by calling 1-800-965-8307
or 954-785-1121.
|
|
|


