You are not logged in.
This means you
CAN ONLY VIEW reports that were published prior to Monday, February 26, 2024.
You
MUST UPGRADE YOUR MEMBERSHIP if you want to see any current reports.
AFTER MARKET UPDATE - TUESDAY, MAY 19TH, 2020
Previous After Market Report Next After Market Report >>>
|
|
|
|
DOW |
-390.51 |
24,206.86 |
-1.59% |
|
Volume |
875,117,640 |
-27% |
|
Volume |
4,138,137,200 |
-4% |
|
NASDAQ |
-49.73 |
9,185.10 |
-0.54% |
|
Advancers |
1,108 |
39% |
|
Advancers |
1,191 |
37% |
|
S&P 500 |
-30.97 |
2,922.94 |
-1.05% |
|
Decliners |
1,758 |
61% |
|
Decliners |
2,054 |
63% |
|
Russell 2000 |
-25.97 |
1,307.72 |
-1.95% |
|
52 Wk Highs |
28 |
|
|
52 Wk Highs |
71 |
|
|
S&P 600 |
-15.94 |
747.78 |
-2.09% |
|
52 Wk Lows |
9 |
|
|
52 Wk Lows |
11 |
|
|
 |
Major Indices Pulled Back With Volume Totals Lighter
Kenneth J. Gruneisen - Passed the CAN SLIM® Master's Exam
The Dow lost 390 points, while the S&P 500 declined 1.1%. The Nasdaq Composite slipped 0.5%, erasing mid-session gains of 0.9%. Breadth was negative as decliners led advancers by a 3-2 margin on the NYSE and 5-3 on the Nasdaq exchange. The reported volume totals were lighter than the prior session on the NYSE and on the Nasdaq exchange. There were 33 high-ranked companies from the Leaders List that hit new 52-week highs and were listed on the BreakOuts Page, versus 60 on the prior session. New 52-week highs totals outnumbered new 52-week lows totals on the NYSE and on the Nasdaq exchange. The major indices are in a confirmed uptrend (M criteria). Any sustainable rally requires a healthy crop of new leaders, so the recent improvement in new highs totals was noted as an encouraging sign. Charts used courtesy of www.stockcharts.com
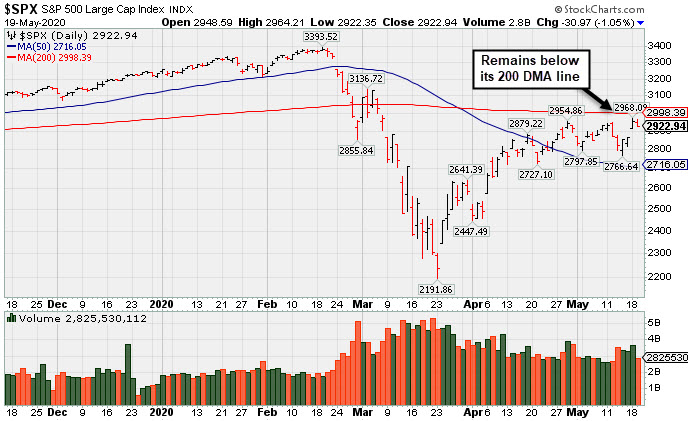
PICTURED: The S&P 500 Index remains below its 200-day moving average (DMA) line.
Stocks finished lower Tuesday for the first time in four sessions after investor sentiment wavered following negative headlines on a hopeful coronavirus vaccine. Shares of Moderna (MRNA -10.41%) fell after a report raised concerns about missing critical data in the biotech’s study released Monday. Elsewhere, both Fed Chair Jerome Powell and Treasury Secretary Steven Mnuchin testified before the Senate Banking Committee, with Powell reiterating that the central bank remains committed to utilizing their “full range of tools to support the economy.”
All 11 S&P 500 sectors ended the day in negative territory with Energy and Financials leading the losses. In earnings, Walmart (WMT -2.12%) fell despite posting a 10% increase in U.S. revenue, fueled by a heavy jump in online sales. Home Depot (HD -2.95%) declined after reporting disappointing earnings attributed to an increase in COVID-19-related expenses. Elsewhere, Advance Auto Parts (AAP +3.59%) rose after noting that same-store sales significantly improved at the beginning of the second quarter. In other corporate news, Disney (DIS -2.12%) fell on the heels of an analyst downgrade, with the departure of a key executive cited as increasing uncertainty.
On the data front, housing starts tumbled an unprecedented 30.2% in April, hitting a five-year low. Separately, building permits fell 20.8% last month, better than expected but worsening from a previous 5.7% decline. Treasuries strengthened, with the yield on the 10-year note slipping three basis points to 0.69%. In commodities, WTI crude gained 2.1% to $32.50/barrel. |
 Kenneth J. Gruneisen started out as a licensed stockbroker in August 1987, a couple of months prior to the historic stock market crash that took the Dow Jones Industrial Average down -22.6% in a single day. He has published daily fact-based fundamental and technical analysis on high-ranked stocks online for two decades. Through FACTBASEDINVESTING.COM, Kenneth provides educational articles, news, market commentary, and other information regarding proven investment systems that work in good times and bad.
Comments contained in the body of this report are technical opinions only and are not necessarily those of Gruneisen Growth Corp. The material herein has been obtained from sources believed to be reliable and accurate, however, its accuracy and completeness cannot be guaranteed. Our firm, employees, and customers may effect transactions, including transactions contrary to any recommendation herein, or have positions in the securities mentioned herein or options with respect thereto. Any recommendation contained in this report may not be suitable for all investors and it is not to be deemed an offer or solicitation on our part with respect to the purchase or sale of any securities. |
|
 |
Gold & Silver Index Posted a Standout Gain Amid Broad Weakness
Kenneth J. Gruneisen - Passed the CAN SLIM® Master's Exam
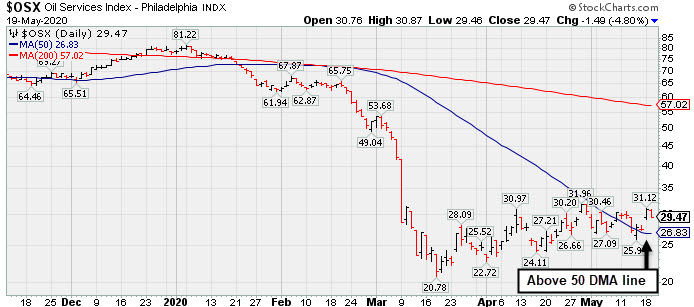
The Bank Index ($BKX -3.53%) and the Broker/Dealer Index ($XBD -2.75%) both lost ground while the Retail Index ($RLX -0.04%) finished flat. The tech sector ended with a negative bias as the Semiconductor Index ($SOX -0.39%), Networking Index ($NWX -0.52%), and Biotech Index ($BTK -1.33%) each ended lower. Energy-linked groups also had a negative bias as the Oil Services Index ($OSX -4.80%) and Integrated Oil Index ($XOI -2.47%) both fell Meanwhile, the Gold & Silver Index ($XAU +3.63%) posted a standout gain. PICTURED: The Oil Services Index ($OSX -4.80%) pulled back today after a big gain on Monday. Recently it has been rebounding above its downward sloping 50-day moving average (DMA) line.
| Oil Services |
$OSX |
29.47 |
-1.49 |
-4.81% |
-62.36% |
| Integrated Oil |
$XOI |
775.14 |
-19.67 |
-2.47% |
-38.99% |
| Semiconductor |
$SOX |
1,775.61 |
-6.93 |
-0.39% |
-4.00% |
| Networking |
$NWX |
516.74 |
-2.70 |
-0.52% |
-11.43% |
| Broker/Dealer |
$XBD |
238.03 |
-6.72 |
-2.75% |
-18.03% |
| Retail |
$RLX |
2,735.19 |
-1.07 |
-0.04% |
+11.67% |
| Gold & Silver |
$XAU |
129.26 |
+4.53 |
+3.63% |
+20.89% |
| Bank |
$BKX |
66.82 |
-2.44 |
-3.52% |
-41.06% |
| Biotech |
$BTK |
5,507.09 |
-74.32 |
-1.33% |
+8.68% |
|
|
|
 |
Biotech Firm Has New Parkinson's Treatment Drug Approved by FDA
Kenneth J. Gruneisen - Passed the CAN SLIM® Master's Exam
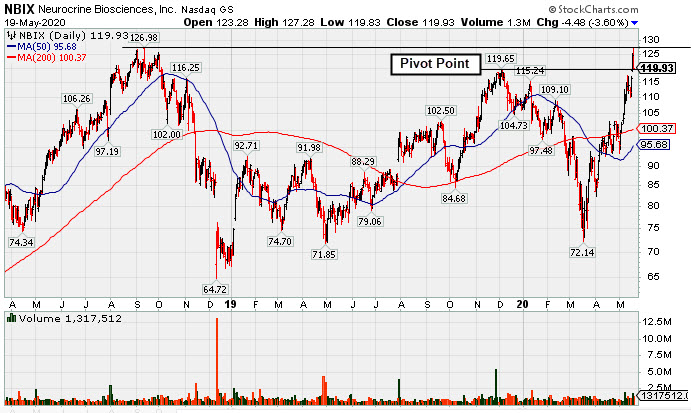
Neurocrine Biosciences (NBIX -$4.48 or -3.60% to $119.93) was highlighted in yellow with pivot point cited based on its 12/04/20 high plus 10 cents in the earlier mid-day report (read here). It reversed into the red and closed lower after early gains touched a new all-time highs (above the $126.98 in Sep '18). Technically, it broke out for a new 52-week high (N criteria) on the prior session with +101% above average volume behind a big gain after a gap up and its finished strong. Subsequent gains into new all-time high territory could signal the beginning of a new substantial leg higher.
It reported earnings +545%, +200%, +163%, and +183% in the Jun, Sep, Dec '19 and Mar '20 quarters, well above the +25% minimum guideline (C criteria) versus the year ago periods, respectively. It showed greatly improved sales revenues up +89%, +46%, +86%, and +71% during that same span of quarterly comparisons. After years of losses it reported strong annual earnings (A criteria) results in FY '18 and '19.
There are 92.8 million shares outstanding (S criteria). The number of top-rated funds owning its shares rose from 651 in Jun '19 to 899 in Mar '20, a reassuring sign concerning the I criteria. Its current Up/Down Volume ratio of 1.6 is an unbiased indication its shares have been under accumulation over the past 50 days. It has an A Timeliness rating and a C Sponsorship Rating. It hails from the strong Medical - Biomed/Biotech industry which is currently rated 5th of the 197 industry groups listed in the newspaper (L criteria). In late April it received approval from the FDA for ONGENTYS, a new medication (N criteria) to help patients with Parkinson's disease better manage motor fluctuations.. |
|
|
Color Codes Explained :
Y - Better candidates highlighted by our
staff of experts.
G - Previously featured
in past reports as yellow but may no longer be buyable under the
guidelines.
***Last / Change / Volume data in this table is the closing quote data***
Symbol/Exchange
Company Name
Industry Group |
PRICE |
CHANGE
(%Change) |
Day High |
Volume
(% DAV)
(% 50 day avg vol) |
52 Wk Hi
% From Hi |
Featured
Date |
Price
Featured |
Pivot Featured |
|
Max Buy |
 FTNT
-
NASDAQ
FTNT
-
NASDAQ
Fortinet Inc
Computer Sftwr-Security
|
$144.82
|
+0.15
0.10% |
$147.57
|
1,075,490
43.35% of 50 DAV
50 DAV is 2,481,000
|
$148.85
-2.71%
|
5/7/2020
|
$134.40
|
PP = $121.92
|
|
MB = $128.02
|
Most Recent Note - 5/15/2020 5:16:11 PM
G - Hit another new all-time high today with light volume behind a big gain, getting more extended from the prior base. Prior highs in the $121 area define initial support to watch on pullbacks.
>>> FEATURED STOCK ARTICLE : Gap Up and Big Volume-Driven Gain for Computer Security Firm - 5/7/2020 |
View all notes |
Set NEW NOTE alert |
Company Profile |
SEC
News |
Chart |
Request a new note
C
A
S
I |
SPNS
-
NASDAQ
Sapiens Intl Corp
COMPUTER SOFTWARE and SERVICES - Technical and System Software
|
$24.88
|
-0.61
-2.39% |
$26.07
|
190,346
122.02% of 50 DAV
50 DAV is 156,000
|
$29.24
-14.91%
|
5/11/2020
|
$27.80
|
PP = $26.96
|
|
MB = $28.31
|
 Most Recent Note - 5/19/2020 12:54:33 PM
G - Encountered distributional pressure yet found prompt support at its 200 DMA line. Last week it reported Mar '20 quarterly earnings +18% on +18% sales revenues versus the year ago period, below the +25% minimum guideline (C criteria), raising fundamental concerns. It slumped after highlighted in the 5/11/20 mid-day report with pivot point cited based on its 1/24/20 high plus 10 cents.
>>> FEATURED STOCK ARTICLE : Encountered Distributional Pressure After Hitting New High - 5/11/2020 |
View all notes |
Set NEW NOTE alert |
Company Profile |
SEC
News |
Chart |
Request a new note
C
A
S
I |
EBS
-
NYSE
Emergent Biosolutions
DRUGS - Biotechnology
|
$86.44
|
-3.08
-3.44% |
$89.56
|
408,824
69.88% of 50 DAV
50 DAV is 585,000
|
$90.00
-3.96%
|
4/24/2020
|
$72.10
|
PP = $73.99
|
|
MB = $77.69
|
Most Recent Note - 5/15/2020 5:21:18 PM
G - Posted a gain today with light volume for the second-best ever close, capping an 8-week winning streak. It is extended from the previously noted base. Prior highs in the $71-73 area define initial support to watch on pullbacks. Fundamentals remain strong.
>>> FEATURED STOCK ARTICLE : Light Volume Gain for New High Close Caps 7th Straight Weekly Gain - 5/8/2020 |
View all notes |
Set NEW NOTE alert |
Company Profile |
SEC
News |
Chart |
Request a new note
C
A
S
I |
NBIX
-
NASDAQ
Neurocrine Biosciences
DRUGS - Biotechnology
|
$119.93
|
-4.48
-3.60% |
$127.28
|
1,317,512
150.92% of 50 DAV
50 DAV is 873,000
|
$125.22
-4.22%
|
5/19/2020
|
$123.71
|
PP = $119.75
|
|
MB = $125.74
|
Most Recent Note - 5/19/2020 6:20:24 PM
Y - Finished near the session low after highlighted in yellow with pivot point cited based on its 12/04/20 high plus 10 cents in the earlier mid-day report. Reversed into the red after touching a new all-time high (above the $126.98 in Sep '18). Technically, it broke out on the prior session with +101% above average volume behind a big gain and strong finish after a gap up. Recent quarterly comparisons through Mar '20 showed greatly improved sales revenues and earnings increases versus year ago periods (C criteria). After years of losses it reported annual earnings (A criteria) in FY '18 and '19. See the latest FSU analysis for more details and a new annotated graph.
>>> FEATURED STOCK ARTICLE : Biotech Firm Has New Parkinson's Treatment Drug Approved by FDA - 5/19/2020 |
View all notes |
Set NEW NOTE alert |
Company Profile |
SEC
News |
Chart |
Request a new note
C
A
S
I |
TREX
-
NYSE
Trex Company Inc
MATERIALS and CONSTRUCTION - General Building Materials
|
$119.18
|
-3.58
-2.92% |
$124.50
|
608,443
56.44% of 50 DAV
50 DAV is 1,078,000
|
$123.61
-3.58%
|
5/5/2020
|
$109.05
|
PP = $111.95
|
|
MB = $117.55
|
Most Recent Note - 5/18/2020 5:21:05 PM
G - Gapped up today and its color code is changed to green after rising above the "max buy" level, hitting a new all-time high with volume below average. Recent gains above the pivot point lacked the great volume conviction indicative of institutional demand. Prior highs in the $111 area define initial support to watch. Has a new CEO as of 4/29/20. Fundamentals remain strong.
>>> FEATURED STOCK ARTICLE : Gapped Up for Volume-Driven Gain and Hit a New All-Time High - 5/5/2020 |
View all notes |
Set NEW NOTE alert |
Company Profile |
SEC
News |
Chart |
Request a new note
C
A
S
I |
Symbol/Exchange
Company Name
Industry Group |
PRICE |
CHANGE
(%Change) |
Day High |
Volume
(% DAV)
(% 50 day avg vol) |
52 Wk Hi
% From Hi |
Featured
Date |
Price
Featured |
Pivot Featured |
|
Max Buy |
NFLX
-
NASDAQ
Netflix Inc
SPECIALTY RETAIL - Music and Video Stores
|
$451.04
|
-1.54
-0.34% |
$458.97
|
4,802,230
51.07% of 50 DAV
50 DAV is 9,404,000
|
$456.36
-1.17%
|
5/14/2020
|
$441.95
|
PP = $449.62
|
|
MB = $472.10
|
Most Recent Note - 5/15/2020 5:19:26 PM
Y - Hit a new all-time high and closed near the session high with today's 3rd consecutive gain backed by below average volume. Color code was changed to yellow with new pivot point cited based on its 4/16/20 high plus 10 cents. Recently formed an advanced "3-weeks tight" base or what may also be considered a 4-week "square box" base. Gains above the pivot point must be backed by at least +40% above average volume to trigger a proper new (or add-on) technical buy signal. Prior highs in the $393 area acted as support following the recent breakout. Fundamentals remain strong.
>>> FEATURED STOCK ARTICLE : Prior Highs Acted as Support Following Recent Breakout - 5/6/2020 |
View all notes |
Set NEW NOTE alert |
Company Profile |
SEC
News |
Chart |
Request a new note
C
A
S
I |
NOW
-
NYSE
Servicenow Inc
Computer Sftwr-Enterprse
|
$382.88
|
+8.01
2.14% |
$389.67
|
1,721,371
61.72% of 50 DAV
50 DAV is 2,789,000
|
$388.50
-1.45%
|
4/30/2020
|
$343.05
|
PP = $363.05
|
|
MB = $381.20
|
Most Recent Note - 5/19/2020 6:15:43 PM
G - Posted a 4th consecutive gain today with light volume and its color code is changed to green after closing above its "max buy" level again. Gains above the pivot point should be backed by at least +40% above average volume to clinch a proper technical buy signal. Prior highs in the $362 area define initial support to watch on pullbacks.
>>> FEATURED STOCK ARTICLE : Consolidating Near Prior High After Wedging Into New High Ground - 5/14/2020 |
View all notes |
Set NEW NOTE alert |
Company Profile |
SEC
News |
Chart |
Request a new note
C
A
S
I |
QLYS
-
NASDAQ
Qualys Inc
Computer Sftwr-Security
|
$109.36
|
+0.61
0.56% |
$111.11
|
412,914
69.63% of 50 DAV
50 DAV is 593,000
|
$111.79
-2.17%
|
4/9/2020
|
$100.44
|
PP = $97.22
|
|
MB = $102.08
|
Most Recent Note - 5/19/2020 6:17:15 PM
G - Challenged its all-time high with today's 4th consecutive gain but volume was light and it ended near the session low. Reported Mar '20 quarterly earnings +33% on +14% sales revenues versus the year ago period, its 12th consecutive quarterly earnings increase above the +25% minimum guideline (C criteria). Prior highs in the $97 area recently acted as support.
>>> FEATURED STOCK ARTICLE : Quiet Pullback Just Below "Max Buy" Level - 5/13/2020 |
View all notes |
Set NEW NOTE alert |
Company Profile |
SEC
News |
Chart |
Request a new note
C
A
S
I |
TEAM
-
NASDAQ
Atlassian Corp Plc Cl A
Comp Sftwr-Spec Enterprs
|
$181.28
|
-0.88
-0.48% |
$186.27
|
1,351,018
65.36% of 50 DAV
50 DAV is 2,067,000
|
$190.21
-4.69%
|
5/4/2020
|
$159.70
|
PP = $156.22
|
|
MB = $164.03
|
Most Recent Note - 5/18/2020 5:19:12 PM
G - Pulled back with lighter volume today following a gain with above average volume for a new all-time high on the prior session. Extended from the previously noted base, and prior highs in the $156 area define initial support to watch on pullbacks. See the latest FSU analysis for more details and a new annotated graph.
>>> FEATURED STOCK ARTICLE : Pullback on Lighter Volume After Gain For New High on Big Volume - 5/18/2020 |
View all notes |
Set NEW NOTE alert |
Company Profile |
SEC
News |
Chart |
Request a new note
C
A
S
I |
AAXN
-
NASDAQ
Axon Enterprise Inc
Security/Sfty
|
$74.73
|
-0.13
-0.17% |
$76.22
|
702,308
82.62% of 50 DAV
50 DAV is 850,000
|
$90.10
-17.06%
|
5/8/2020
|
$84.86
|
PP = $90.20
|
|
MB = $94.71
|
Most Recent Note - 5/15/2020 5:27:55 PM
Y - Pulled back for a 5th consecutive loss with ever decreasing volume. A rebound and subsequent volume-driven gains above the pivot point are needed to trigger a technical buy signal.
>>> FEATURED STOCK ARTICLE : Security/Safety Firm Perched Near 52-Week High After Gap Up - 5/12/2020 |
View all notes |
Set NEW NOTE alert |
Company Profile |
SEC
News |
Chart |
Request a new note
C
A
S
I |
Symbol/Exchange
Company Name
Industry Group |
PRICE |
CHANGE
(%Change) |
Day High |
Volume
(% DAV)
(% 50 day avg vol) |
52 Wk Hi
% From Hi |
Featured
Date |
Price
Featured |
Pivot Featured |
|
Max Buy |
|
|
|
THESE ARE NOT BUY RECOMMENDATIONS!
Comments contained in the body of this report are technical
opinions only. The material herein has been obtained
from sources believed to be reliable and accurate, however,
its accuracy and completeness cannot be guaranteed.
This site is not an investment advisor, hence it does
not endorse or recommend any securities or other investments.
Any recommendation contained in this report may not
be suitable for all investors and it is not to be deemed
an offer or solicitation on our part with respect to
the purchase or sale of any securities. All trademarks,
service marks and trade names appearing in this report
are the property of their respective owners, and are
likewise used for identification purposes only.
This report is a service available
only to active Paid Premium Members.
You may opt-out of receiving report notifications
at any time. Questions or comments may be submitted
by writing to Premium Membership Services 665 S.E. 10 Street, Suite 201 Deerfield Beach, FL 33441-5634 or by calling 1-800-965-8307
or 954-785-1121.
|
|
|