You are not logged in.
This means you
CAN ONLY VIEW reports that were published prior to Monday, April 14, 2025.
You
MUST UPGRADE YOUR MEMBERSHIP if you want to see any current reports.
AFTER MARKET UPDATE - TUESDAY, MAY 18TH, 2010
Previous After Market Report Next After Market Report >>>
|
|
|
|
DOW |
-114.88 |
10,510.95 |
-1.08% |
|
Volume |
1,524,982,790 |
+6% |
|
Volume |
2,364,033,260 |
+2% |
|
NASDAQ |
-36.97 |
2,317.26 |
-1.57% |
|
Advancers |
703 |
22% |
|
Advancers |
682 |
24% |
|
S&P 500 |
-16.14 |
1,120.80 |
-1.42% |
|
Decliners |
2,362 |
75% |
|
Decliners |
2,026 |
72% |
|
Russell 2000 |
-12.96 |
682.75 |
-1.86% |
|
52 Wk Highs |
45 |
|
|
52 Wk Highs |
56 |
|
|
S&P 600 |
-7.78 |
366.41 |
-2.08% |
|
52 Wk Lows |
16 |
|
|
52 Wk Lows |
40 |
|
|
 |
Stocks Slumped Into Red After Starting Higher
Adam Sarhan, Contributing Writer,
Stocks negatively reversed (opened higher but closed lower) on Tuesday after the Euro plunged to a fresh 4-year low against the US dollar. Volume totals were reported higher on the Nasdaq and the NYSE compared to Monday's total which was not an encouraging sign. Decliners trumped advancers by about a 3-to-1 ratio on the NYSE and the Nasdaq exchange. New 52-week highs outnumbered new 52-week lows on both major exchanges. There were 15 high-ranked companies from the CANSLIM.net Leaders List that made a new 52-week high and appeared on the CANSLIM.net BreakOuts Page, higher than the 7 issues that appeared on the prior session.
The major averages opened higher but quickly turned tail after the euro plunged to a fresh four year low against the greenback. The big news of the day came out of Germany. Germany placed a temporary ban on naked short selling of euro bonds, banks and insurers in an attempt to curb the month long decline and ease contagion woes. Germany's BaFin financial-services regulator said that the plan will be effective midnight and remain in effect until March 31, 2011. This sent the euro plunging below $1.22 for the first time since April 17, 2006. The stronger dollar sent a slew of dollar denominated assets (mainly stocks and commodities) lower. Crude oil negatively reversed and fell -3.5% and closed below $70 a barrel for the first time in months which has negative ramifications on the economic recovery.
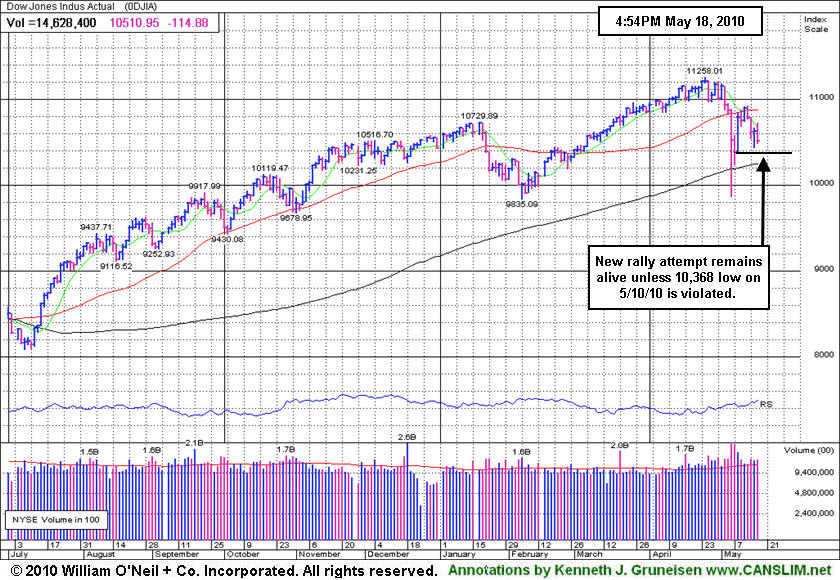
The NYSE Composite Index closed below its 200-day moving average (DMA) line for the third straight session which is not a healthy sign. The Nasdaq Composite Index and S&P 500 Index avoided undercutting Monday's lows, which means that Tuesday marked Day 2 of their current rally attempt and the earliest a possible FTD can emerge for either index would be Thursday. Technically, however, if Monday's lows are breached then the day count will be reset for those major averages. Meanwhile, the Dow Jones Industrial Average has yet to violate last Monday's low, which means that it just finished Day 7 of its current rally attempt and the window for a proper FTD remains open (unless its 5/10/10 low of 10,386 is breached). What does all of this mean for investors? Simple, the market is in a correction which reiterates the importance of adopting a defense stance until a new rally is confirmed. Trade accordingly.
Professional Money Management Services - Free Portfolio Review:
If your portfolio is greater than $100,000 and you would like a free portfolio review, click here to get connected with one of our portfolio managers. ** Serious inquires only, please.
PICTURED: The Dow Jones Industrial Average's latest rally attempt remains intact, but it and the other major averages' outlooks grow increasingly questionable the longer they continue slumping below their 50 DMA lines.
|
|
|
 |
Financial Group Leading The Pullback; Energy Weakness Also Bad For Economic Outlook
Kenneth J. Gruneisen - Passed the CAN SLIM® Master's Exam
Losses in the financial group had a negative influence on the major averages on Tuesday as the Bank Index ($BKX -3.72%) and Broker/Dealer Index ($XBD -3.02%) were among the session's worst declining groups. The Retail Index ($RLX -2.51%) also slumped and the tech sector was hit with unanimous losses from the Semiconductor Index ($SOX -2.93%), Networking Index ($NWX -2.02%), Internet Index ($IIX -1.48%), and Biotechnology Index ($BTK -0.69%) Defensive groups also suffered small losses as the Gold & Silver Index ($XAU -0.67%), Integrated Oil Index ($XOI -0.71%), Oil Services Index ($OSX -1.60%), and Healthcare Index ($HMO -0.18%) rounded out a clearly negative session.
As Adam Sarhan pointed out in Monday's commentary, "It is important to note that crude oil is used as a good proxy for the strength of the overall economy. Therefore, the fact that crude has sliced and closed below its longer-term 200-day moving average (DMA) line bodes poorly for the economic recovery. It is also disconcerting to see copper, another proxy for the global recovery, drop and close below its respective 200 DMA line on Monday." Below we will have a look at the 2 routinely followed energy-related indexes' charts.
Charts courtesy www.stockcharts.com
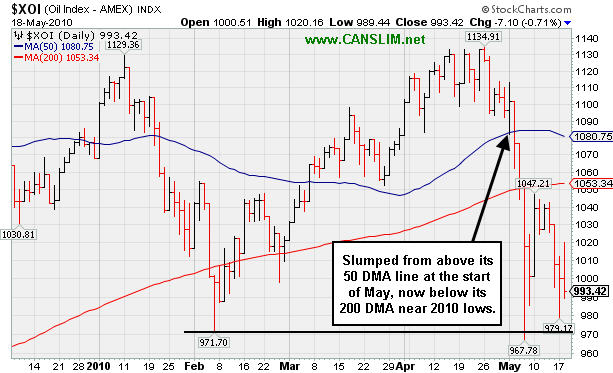
PICTURED 1: The Integrated Oil Index ($XOI -0.71%) slumped from above its 50-day moving average (DMA) line at the start of May, and is now trading below its 200 DMA near 2010 lows.
Charts courtesy www.stockcharts.com
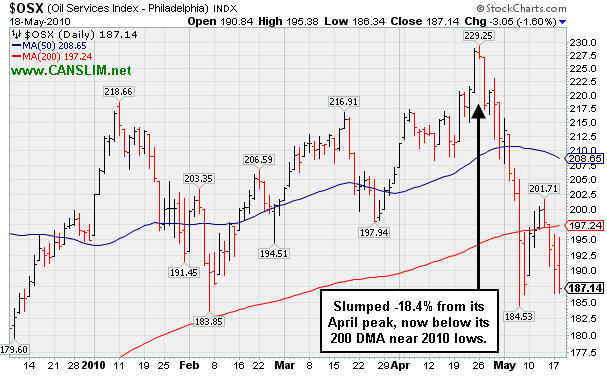
PICTURED 2: The Oil Services Index ($OSX -1.60%) fell -18.4% from its April peak, now trading below its 200 DMA near 2010 lows.
| Oil Services |
$OSX |
187.14 |
-3.05 |
-1.60% |
-3.99% |
| Healthcare |
$HMO |
1,502.63 |
-2.74 |
-0.18% |
+2.02% |
| Integrated Oil |
$XOI |
993.42 |
-7.10 |
-0.71% |
-7.00% |
| Semiconductor |
$SOX |
348.85 |
-10.54 |
-2.93% |
-3.07% |
| Networking |
$NWX |
246.63 |
-5.06 |
-2.01% |
+6.74% |
| Internet |
$IIX |
241.29 |
-3.65 |
-1.49% |
+3.18% |
| Broker/Dealer |
$XBD |
109.39 |
-3.40 |
-3.02% |
-4.92% |
| Retail |
$RLX |
444.21 |
-11.46 |
-2.51% |
+8.05% |
| Gold & Silver |
$XAU |
178.75 |
-1.21 |
-0.67% |
+6.24% |
| Bank |
$BKX |
51.24 |
-1.98 |
-3.72% |
+19.97% |
| Biotech |
$BTK |
1,085.01 |
-7.52 |
-0.69% |
+15.17% |
|
|
|
 |
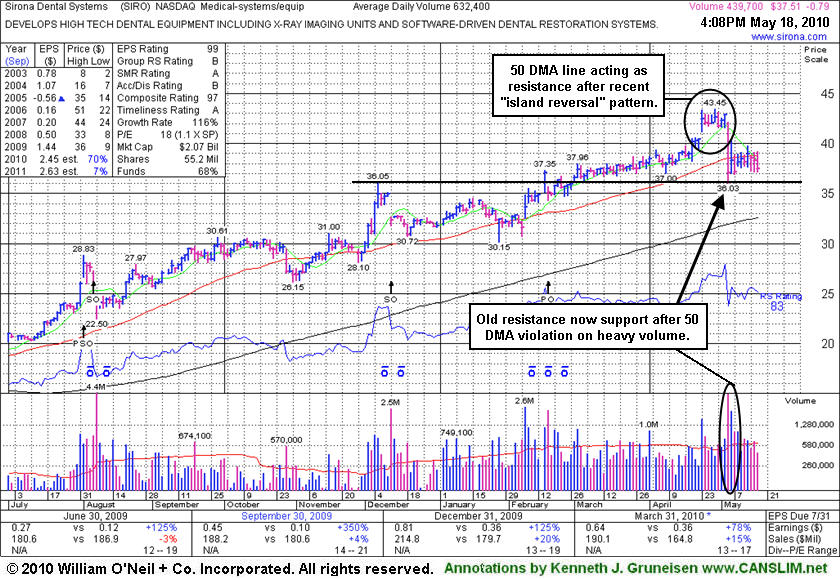
50 DMA Acts As Resistance After Recent Island Reversal Pattern
Kenneth J. Gruneisen - Passed the CAN SLIM® Master's Exam
Sirona Dental Systems (SIRO -$0.83 or -2.15% to $37.48) is continuing to sputter below its 50-day moving average (DMA) line which is acting as resistance. On 5/05/10 it endured heavy distributional pressure after reporting +231% earnings on +15% sales revenues for the quarter ended March 31, 2010 versus the year ago period. Since its last appearance in this FSU section on 4/22/10 under the headline "Wedging Up For Another New High Close" a gap up on 4/23/10 and then a subsequent gap down on 5/05/10 formed a worrisome "island reversal" pattern. Prior chart highs in the $36 area define important support to watch, while the outlook becomes more questionable the longer it lingers below its 50 DMA line.
SIRO was featured in yellow in the 2/16/10 mid-day report (read here) as it broke out from a 10-week flat base. Fundamentally, following 3 negative comparisons, its sales revenues and earnings increases in the Sep, Dec '09 and Mar '10 quarterly comparisons showed a return to growth. Quarterly earnings increases have been very strong along with great annual earnings growth in recent years (good C and A criteria). While rallying from January 2009 lows near $10 underwriters helped this high-ranked Medical - Systems/Equipment firm complete Secondary Offerings on 8/06/09 and 12/11/09, and yet another Public Offering on 2/17/10. The number of top-rated funds owning its shares rose from 55 in Mar '09 to 99 in Mar '10, which is nice reassurance with respect to the I criteria of the investment system. Companies often attract new institutional investors with the help of underwriters, but offerings often have the near-term effect of hindering upward price progress. Company management reportedly still owns a 70% interest in the company's shares even after those offerings, keeping them very motivated to maintain and build shareholder value.
 |
|
|
Color Codes Explained :
Y - Better candidates highlighted by our
staff of experts.
G - Previously featured
in past reports as yellow but may no longer be buyable under the
guidelines.
***Last / Change / Volume data in this table is the closing quote data***
Symbol/Exchange
Company Name
Industry Group |
PRICE |
CHANGE
(%Change) |
Day High |
Volume
(% DAV)
(% 50 day avg vol) |
52 Wk Hi
% From Hi |
Featured
Date |
Price
Featured |
Pivot Featured |
|
Max Buy |
BIDU
-
NASDAQ
Baidu Inc Ads
INTERNET - Internet Information Providers
|
$71.57
|
-1.61
-2.20% |
$75.25
|
12,456,882
70.08% of 50 DAV
50 DAV is 17,775,100
|
$82.29
-13.03%
|
1/13/2010
|
$43.13
|
PP = $42.68
|
|
MB = $44.81
|
 Most Recent Note - 5/18/2010 3:57:35 PM
G - Volume has been cooling, yet today marks the 4th consecutive loss after a worrisome negative reversal from its all-time high on 5/13/10. It is extended from any sound base. Do not be confused as the latest Featured Price, PP and MB levels have been adjusted for a recent 10:1 stock split.
 >>> The latest Featured Stock Update with an annotated graph appeared on 5/14/2010. Click here. >>> The latest Featured Stock Update with an annotated graph appeared on 5/14/2010. Click here.
View all notes |
Alert me of new notes |
CANSLIM.net Company Profile
|
BPI
-
NYSE
Bridgepoint Education
DIVERSIFIED SERVICES - Education and; Training Services
|
$24.05
|
-0.20
-0.82% |
$24.50
|
569,536
116.66% of 50 DAV
50 DAV is 488,200
|
$27.50
-12.55%
|
4/13/2010
|
$25.59
|
PP = $25.76
|
|
MB = $27.05
|
Most Recent Note - 5/17/2010 4:02:25 PM
G - Late-afternoon rebound led to an impressive positive reversal today, a sign of prompt support arriving after early losses below its 50 DMA line technically violated prior chart lows.
>>> The latest Featured Stock Update with an annotated graph appeared on 5/7/2010. Click here.
View all notes |
Alert me of new notes |
CANSLIM.net Company Profile
|
BRLI
-
NASDAQ
Bio Reference Labs Inc
HEALTH SERVICES - Medical Laboratories and Researc
|
$22.90
|
-1.14
-4.74% |
$24.40
|
174,824
93.29% of 50 DAV
50 DAV is 187,400
|
$24.67
-7.19%
|
2/12/2010
|
$39.02
|
PP = $20.49
|
|
MB = $21.51
|
Most Recent Note - 5/18/2010 3:08:37 PM
G - Pulling back for a considerable loss today, testing its 50 DMA line. Promptly rallied last week after violations of its 50 DMA line and 3/26/10 low triggered technical sell signals.
>>> The latest Featured Stock Update with an annotated graph appeared on 5/11/2010. Click here.
View all notes |
Alert me of new notes |
CANSLIM.net Company Profile
|
CISG
-
NASDAQ
Cninsure Inc Ads
INSURANCE - Insurance Brokers
|
$24.91
|
-0.73
-2.85% |
$26.49
|
299,481
120.81% of 50 DAV
50 DAV is 247,900
|
$28.62
-12.96%
|
3/3/2010
|
$24.38
|
PP = $23.10
|
|
MB = $24.26
|
Most Recent Note - 5/18/2010 4:19:09 PM
G - Today marked its 4th consecutive loss. Its slump below its 50 DMA line hurts its outlook, yet it may be forming a new base-on-base type pattern.
>>> The latest Featured Stock Update with an annotated graph appeared on 5/12/2010. Click here.
View all notes |
Alert me of new notes |
CANSLIM.net Company Profile
|
CRM
-
NYSE
Salesforce.Com Inc
INTERNET - Internet Software and Services
|
$84.16
|
-1.08
-1.27% |
$87.67
|
1,920,802
109.27% of 50 DAV
50 DAV is 1,757,800
|
$89.84
-6.32%
|
3/5/2010
|
$72.28
|
PP = $75.53
|
|
MB = $79.31
|
Most Recent Note - 5/17/2010 4:13:32 PM
G - Holding its ground near all-time highs with no overhead supply to act as resistance. Its gap up on 5/10/10 promptly repaired a brief violation of its 50 DMA line, a sign of great institutional support.
>>> The latest Featured Stock Update with an annotated graph appeared on 5/17/2010. Click here.
View all notes |
Alert me of new notes |
CANSLIM.net Company Profile
|
Symbol/Exchange
Company Name
Industry Group |
PRICE |
CHANGE
(%Change) |
Day High |
Volume
(% DAV)
(% 50 day avg vol) |
52 Wk Hi
% From Hi |
Featured
Date |
Price
Featured |
Pivot Featured |
|
Max Buy |
LL
-
NYSE
Lumber Liquidators Hldgs
RETAIL - Home Improvement Stores
|
$29.33
|
-0.47
-1.58% |
$30.67
|
262,904
69.48% of 50 DAV
50 DAV is 378,400
|
$33.41
-12.21%
|
4/22/2010
|
$29.87
|
PP = $29.03
|
|
MB = $30.48
|
Most Recent Note - 5/18/2010 3:59:23 PM
G - Consolidating above its 50 DMA line after promptly rebounding back above its December 2009 highs.
>>> The latest Featured Stock Update with an annotated graph appeared on 4/26/2010. Click here.
View all notes |
Alert me of new notes |
CANSLIM.net Company Profile
|
LOPE
-
NASDAQ
Grand Canyon Education
DIVERSIFIED SERVICES - Education and; Training Services
|
$25.16
|
+0.01
0.04% |
$26.27
|
445,491
120.66% of 50 DAV
50 DAV is 369,200
|
$28.46
-11.60%
|
4/13/2010
|
$27.71
|
PP = $27.33
|
|
MB = $28.70
|
Most Recent Note - 5/18/2010 4:01:35 PM
G - Gapped up today but negatively reversed and closed near the session low as its 50 DMA line acted as resistance. Its 4/29/10 low of $23.66 is the next important chart support.
>>> The latest Featured Stock Update with an annotated graph appeared on 5/10/2010. Click here.
View all notes |
Alert me of new notes |
CANSLIM.net Company Profile
|
MELI
-
NASDAQ
Mercadolibre Inc
INTERNET - Internet Software and; Services
|
$49.35
|
-0.56
-1.12% |
$51.51
|
781,219
133.84% of 50 DAV
50 DAV is 583,700
|
$55.75
-11.48%
|
5/13/2010
|
$54.21
|
PP = $55.85
|
|
MB = $58.64
|
Most Recent Note - 5/18/2010 4:03:30 PM
G - Pulled back near its 50 DMA line, its color code was changed to green. Today marked its 4th consecutive loss following a 5/13/10 negative reversal.
>>> The latest Featured Stock Update with an annotated graph appeared on 5/13/2010. Click here.
View all notes |
Alert me of new notes |
CANSLIM.net Company Profile
|
ROVI
-
NASDAQ
Rovi Corp
COMPUTER SOFTWARE andamp; SERVICES - Security Software andamp; Services
|
$38.27
|
-0.38
-0.98% |
$39.08
|
1,222,009
90.39% of 50 DAV
50 DAV is 1,352,000
|
$40.06
-4.47%
|
4/20/2010
|
$37.62
|
PP = $38.60
|
|
MB = $40.53
|
Most Recent Note - 5/18/2010 4:04:41 PM
G - Still hovering near its 52-week high, clear of virtually all chart resistance while consolidating just above its 50 DMA line. Its recent chart low ($33.17) defines near-term chart support above its 200 DMA line.
>>> The latest Featured Stock Update with an annotated graph appeared on 5/5/2010. Click here.
View all notes |
Alert me of new notes |
CANSLIM.net Company Profile
|
SIRO
-
NASDAQ
Sirona Dental Systems
HEALTH SERVICES - Medical Instruments andamp; Supplies
|
$37.48
|
-0.83
-2.15% |
$39.19
|
511,185
81.49% of 50 DAV
50 DAV is 627,300
|
$43.45
-13.75%
|
2/16/2010
|
$36.43
|
PP = $36.15
|
|
MB = $37.96
|
Most Recent Note - 5/18/2010 3:50:45 PM
G - Continuing to trade below its 50 DMA line which is recently acting as resistance following an "island reversal" pattern. Prior chart highs in the $36 area define important support to watch.
>>> The latest Featured Stock Update with an annotated graph appeared on 5/18/2010. Click here.
View all notes |
Alert me of new notes |
CANSLIM.net Company Profile
|
Symbol/Exchange
Company Name
Industry Group |
PRICE |
CHANGE
(%Change) |
Day High |
Volume
(% DAV)
(% 50 day avg vol) |
52 Wk Hi
% From Hi |
Featured
Date |
Price
Featured |
Pivot Featured |
|
Max Buy |
SUMR
-
NASDAQ
Summer Infant Inc
CONSUMER NON-DURABLES - Personal Products
|
$7.92
|
-0.06
-0.75% |
$8.21
|
66,463
129.81% of 50 DAV
50 DAV is 51,200
|
$7.75
2.19%
|
5/4/2010
|
$6.85
|
PP = $7.09
|
|
MB = $7.44
|
Most Recent Note - 5/18/2010 12:57:20 PM
G - Hit another new 52-week high today. Color code was changed to green after rallying well above its "max buy" level. Prior chart highs may now act as a support level. Disciplined investors do not chase extended stocks. Questions also remain about the rally's tenacity until a follow-through-day occurs from at least one of the major averages.
>>> The latest Featured Stock Update with an annotated graph appeared on 5/4/2010. Click here.
View all notes |
Alert me of new notes |
CANSLIM.net Company Profile
|
ULTA
-
NASDAQ
Ulta Salon Cosm & Frag
SPECIALTY RETAIL - Specialty Retail, Other
|
$23.50
|
-0.26
-1.09% |
$24.50
|
195,569
45.29% of 50 DAV
50 DAV is 431,800
|
$25.76
-8.77%
|
3/12/2010
|
$22.81
|
PP = $21.72
|
|
MB = $22.81
|
Most Recent Note - 5/18/2010 4:22:10 PM
G - After a gap up today it negatively reversed and closed near the session low for a small loss on light volume. Recent rebound above its 50 DMA line and January low was an encouraging sign of support.
>>> The latest Featured Stock Update with an annotated graph appeared on 4/30/2010. Click here.
View all notes |
Alert me of new notes |
CANSLIM.net Company Profile
|
VIT
-
NYSE
Vanceinfo Tech Inc Ads
COMPUTER SOFTWARE and SERVICES - Business Software and Services
|
$20.93
|
-0.77
-3.55% |
$22.00
|
476,185
59.96% of 50 DAV
50 DAV is 794,200
|
$26.48
-20.96%
|
4/9/2010
|
$23.79
|
PP = $23.95
|
|
MB = $25.15
|
Most Recent Note - 5/18/2010 3:30:19 PM
G - Down again today on light volume, still failing to find support since a gap down on 5/13/10 and violation of its 50 DMA line. Recent lows in the $20 area define near-term chart support above its 200 DMA line.
>>> The latest Featured Stock Update with an annotated graph appeared on 5/6/2010. Click here.
View all notes |
Alert me of new notes |
CANSLIM.net Company Profile
|
|
|
|
THESE ARE NOT BUY RECOMMENDATIONS!
Comments contained in the body of this report are technical
opinions only. The material herein has been obtained
from sources believed to be reliable and accurate, however,
its accuracy and completeness cannot be guaranteed.
This site is not an investment advisor, hence it does
not endorse or recommend any securities or other investments.
Any recommendation contained in this report may not
be suitable for all investors and it is not to be deemed
an offer or solicitation on our part with respect to
the purchase or sale of any securities. All trademarks,
service marks and trade names appearing in this report
are the property of their respective owners, and are
likewise used for identification purposes only.
This report is a service available
only to active Paid Premium Members.
You may opt-out of receiving report notifications
at any time. Questions or comments may be submitted
by writing to Premium Membership Services 665 S.E. 10 Street, Suite 201 Deerfield Beach, FL 33441-5634 or by calling 1-800-965-8307
or 954-785-1121.
|
|
|


