You are not logged in.
This means you
CAN ONLY VIEW reports that were published prior to Monday, April 14, 2025.
You
MUST UPGRADE YOUR MEMBERSHIP if you want to see any current reports.
AFTER MARKET UPDATE - MONDAY, MAY 16TH, 2011
Previous After Market Report Next After Market Report >>>
|
|
|
|
DOW |
-47.38 |
12,548.37 |
-0.38% |
|
Volume |
907,698,670 |
+1% |
|
Volume |
2,010,547,950 |
+7% |
|
NASDAQ |
-46.16 |
2,782.31 |
-1.63% |
|
Advancers |
971 |
31% |
|
Advancers |
540 |
20% |
|
S&P 500 |
-8.30 |
1,329.47 |
-0.62% |
|
Decliners |
2,044 |
65% |
|
Decliners |
2,098 |
77% |
|
Russell 2000 |
-12.76 |
822.91 |
-1.53% |
|
52 Wk Highs |
105 |
|
|
52 Wk Highs |
40 |
|
|
S&P 600 |
-6.00 |
441.11 |
-1.34% |
|
52 Wk Lows |
35 |
|
|
52 Wk Lows |
68 |
|
|
 |
Negative Breadth and Waning Leadership Weighs Indices Down
Kenneth J. Gruneisen - Passed the CAN SLIM® Master's Exam
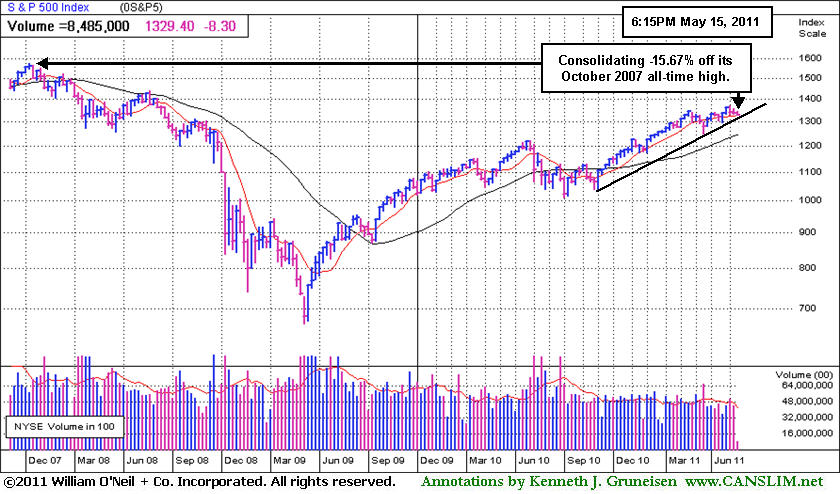
The stock market drifted steadily lower during the afternoon, and the Nasdaq Composite Index fared the worst on a percentage basis among the major U.S. indexes as technology stocks lagged. Declining issues beat advancers by 2-1 on the NYSE and by 4-1 on the Nasdaq. New 52-week highs outnumbered new 52-week lows on the NYSE, but new 52-week lows outnumbered new highs on the Nasdaq exchange. Volume totals were reported lighter than the prior session totals on the NYSE and on the Nasdaq exchange, which was a sign that institutional investors were not aggressively dumping shares. There were 26 high-ranked companies from the CANSLIM.net Leaders List that made new 52-week highs and appeared on the CANSLIM.net BreakOuts Page, down from the total of 49 on the prior session. Breadth was especially negative among the high-ranked leaders currently included on the Featured Stocks Page as 14 out of 15 stocks finished Monday's session lower.
European debt problems nagged the U.S. market as the euro zone considered aid packages for Portugal and Greece. Two reports pointed to a slowing U.S. economy. A gauge of manufacturing in the New York region slid to its lowest level in five months as the cost of raw materials surged. The NAHB housing index was unchanged in April and continued to suggest a weak housing market.
Amazon.com Inc (AMZN -4.96%) fell following reports hackers used Amazon's cloud web-servers to launch their attack on Sony Corp (SNE +0.87%) last month. Shares of NYSE Euronext (NYX -12.62%) after Nasdaq OMX Group Inc (NDAQ -2.53%) withdrew its offer for the company. Capital One Financial Corp (COF +2.18%) rose after reporting a decline in credit-card delinquencies in April. On the plus side, airline stocks gained on a forecast that air travel will increase this summer.
PICTURED: The weakness extended a two-week slump for the S&P 500 Index. It is perched -15.67% off its October 2007 all-time high.
|
 Kenneth J. Gruneisen started out as a licensed stockbroker in August 1987, a couple of months prior to the historic stock market crash that took the Dow Jones Industrial Average down -22.6% in a single day. He has published daily fact-based fundamental and technical analysis on high-ranked stocks online for two decades. Through FACTBASEDINVESTING.COM, Kenneth provides educational articles, news, market commentary, and other information regarding proven investment systems that work in good times and bad.
Comments contained in the body of this report are technical opinions only and are not necessarily those of Gruneisen Growth Corp. The material herein has been obtained from sources believed to be reliable and accurate, however, its accuracy and completeness cannot be guaranteed. Our firm, employees, and customers may effect transactions, including transactions contrary to any recommendation herein, or have positions in the securities mentioned herein or options with respect thereto. Any recommendation contained in this report may not be suitable for all investors and it is not to be deemed an offer or solicitation on our part with respect to the purchase or sale of any securities. |
|
 |
Tech and Retail Weakness Drags Market Down
Kenneth J. Gruneisen - Passed the CAN SLIM® Master's Exam
The tech sector's negative bias resulted from larger losses in the Internet Index ($IIX -2.53%) and Networking Index ($NWX -2.25%) followed by the Biotechnology Index ($BTK -1.65%) and Semiconductor Index ($SOX -1.42%). Energy-related stocks were weak as the Oil Services Index ($OSX -1.07%) and Integrated Oil Index ($XOI -0.86%) slumped. The Retail Index ($RLX -2.00%) and Broker/Dealer Index ($XBD -1.13%) also lost ground and had a negative influence on the major market averages. Meanwhile, the Bank Index ($BKX +0.12%) basically held its ground along with the defensive Gold & Silver Index ($XAU +0.05%) and Healthcare Index ($HMO +0.33%).
Charts courtesy www.stockcharts.com
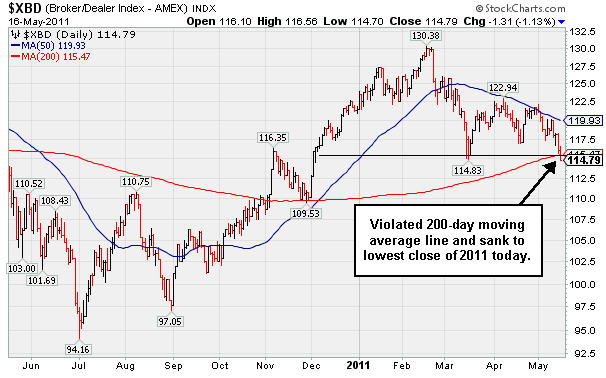
PICTURED: The Broker/Dealer Index ($XBD -1.13%) violated its 200-day moving average (DMA) line and sank to its lowest close of 2011.
| Oil Services |
$OSX |
260.05 |
-2.81 |
-1.07% |
+6.09% |
| Healthcare |
$HMO |
2,394.09 |
+7.96 |
+0.33% |
+41.50% |
| Integrated Oil |
$XOI |
1,271.56 |
-10.97 |
-0.86% |
+4.81% |
| Semiconductor |
$SOX |
434.69 |
-6.26 |
-1.42% |
+5.55% |
| Networking |
$NWX |
320.93 |
-7.40 |
-2.25% |
+14.39% |
| Internet |
$IIX |
313.71 |
-8.13 |
-2.53% |
+1.94% |
| Broker/Dealer |
$XBD |
114.79 |
-1.31 |
-1.13% |
-5.53% |
| Retail |
$RLX |
536.30 |
-10.95 |
-2.00% |
+5.49% |
| Gold & Silver |
$XAU |
195.36 |
+0.10 |
+0.05% |
-13.78% |
| Bank |
$BKX |
49.57 |
+0.06 |
+0.12% |
-5.06% |
| Biotech |
$BTK |
1,473.51 |
-24.70 |
-1.65% |
+13.55% |
|
|
|
 |
Waning Ownership From Top Funds And Noted Distribution
Kenneth J. Gruneisen - Passed the CAN SLIM® Master's Exam
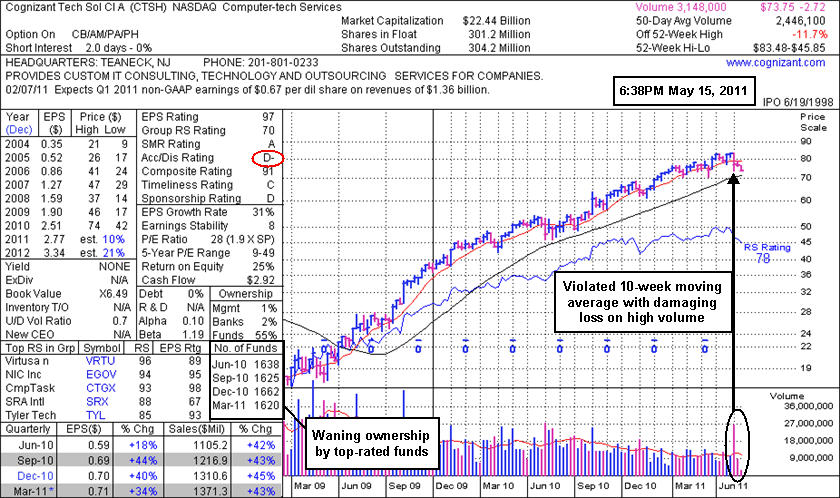
Cognizant Technology Solutions Corp. (CTSH -$2.72 or -3.56% to $73.75) suffered another considerable loss today with above average volume, slumping toward prior lows in the $70.50 range and its 200-day moving average (DMA) line. Its Accumulation/Distribution rating is now a D- (see red circle) while it is still perched just -11.7% off its 52-week high. However, overhead supply up through the $83 level is likely to hinder its upward progress for the near term.
CTSH initially found support near its 50 DMA line after its last appearance in this FSU section with an annotated graph on 4/15/11 under the headline, "Collateral Damage Hurts IT Firm's Shares", when its prominent competitor, India-based Infosys Technologies (INFY), gave disappointing guidance which put pressure on other IT companies' shares. After testing support at prior highs in the $77 area and its 50-day moving average (DMA) line it found prompt support and soon surged to a new all-time high again. However, the damaging gap down loss on 5/03/11 after its latest earnings report triggered a technical sell signal. The above linked article had noted - "Additional losses would make it increasingly harder to give it the benefit of the doubt, especially when compared to a fresh new breakout with healthy characteristics."
Lackluster earnings estimates (see red circle) for FY '11 were noted recently as cause for concern. It was also recognized as a familiar name to the institutional crowd. In fact, the number of top-rated funds owning its shares waned from 1,662 in Dec '10 to 1,620 in Mar '11.
|
|
|
Color Codes Explained :
Y - Better candidates highlighted by our
staff of experts.
G - Previously featured
in past reports as yellow but may no longer be buyable under the
guidelines.
***Last / Change / Volume data in this table is the closing quote data***
Symbol/Exchange
Company Name
Industry Group |
PRICE |
CHANGE
(%Change) |
Day High |
Volume
(% DAV)
(% 50 day avg vol) |
52 Wk Hi
% From Hi |
Featured
Date |
Price
Featured |
Pivot Featured |
|
Max Buy |
CMG
-
NYSE
Chipotle Mexican Grill
LEISURE - Restaurants
|
$272.69
|
-7.71
-2.75% |
$279.88
|
806,858
70.19% of 50 DAV
50 DAV is 1,149,500
|
$289.35
-5.76%
|
4/1/2011
|
$274.00
|
PP = $275.10
|
|
MB = $288.86
|
 Most Recent Note - 5/16/2011 4:06:02 PM
G - Pulled back on light volume today. Little resistance remains due to overhead supply. Recently found support near its 50 DMA line after it negated its latest technical breakout.
>>> The latest Featured Stock Update with an annotated graph appeared on 4/13/2011. Click here.
View all notes |
Alert me of new notes |
CANSLIM.net Company Profile |
SEC |
Zacks Reports |
StockTalk |
News |
Chart |
Request a new note
C
A N
S L
I M


|
CTSH
-
NASDAQ
Cognizant Tech Sol Cl A
COMPUTER SOFTWARE and SERVICES - Business Software and Services
|
$73.75
|
-2.72
-3.56% |
$76.22
|
3,155,567
129.00% of 50 DAV
50 DAV is 2,446,100
|
$83.48
-11.66%
|
2/7/2011
|
$75.09
|
PP = $76.46
|
|
MB = $80.28
|
Most Recent Note - 5/16/2011 3:15:32 PM
G - Considerable loss today with near average volume, slumping toward prior lows in the $70.50 range and its 200 DMA line. Overhead supply up through the $83 level may also hinder upward progress for the near term.
>>> The latest Featured Stock Update with an annotated graph appeared on 5/16/2011. Click here.
View all notes |
Alert me of new notes |
CANSLIM.net Company Profile |
SEC |
Zacks Reports |
StockTalk |
News |
Chart |
Request a new note
C
A N
S L
I M
|
EZPW
-
NASDAQ
Ezcorp Inc Cl A
SPECIALTY RETAIL - Specialty Retail, Other
|
$29.87
|
-0.26
-0.86% |
$30.65
|
216,984
61.02% of 50 DAV
50 DAV is 355,600
|
$33.08
-9.70%
|
2/18/2011
|
$27.94
|
PP = $30.04
|
|
MB = $31.54
|
Most Recent Note - 5/13/2011 3:22:33 PM
G - Volume totals have been cooling in recent weeks while consolidating above its 50 DMA line. Recent lows also define important nearby chart support to watch where technical violations would raise more serious concerns. It has not formed a sound new base pattern.
>>> The latest Featured Stock Update with an annotated graph appeared on 5/10/2011. Click here.
View all notes |
Alert me of new notes |
CANSLIM.net Company Profile |
SEC |
Zacks Reports |
StockTalk |
News |
Chart |
Request a new note
C
A N
S L
I M
|
FOSL
-
NASDAQ
Fossil Inc
CONSUMER DURABLES - Recreational Goods, Other
|
$103.62
|
-1.72
-1.63% |
$105.48
|
639,139
70.90% of 50 DAV
50 DAV is 901,500
|
$107.54
-3.64%
|
2/1/2011
|
$73.30
|
PP = $74.44
|
|
MB = $78.16
|
Most Recent Note - 5/13/2011 10:55:51 AM
G - Stubbornly holding its ground in a tight range with volume totals cooling since its considerable gap up gain on 5/10/11 for a new all-time high. It is extended from a sound base. Prior highs near $96 define initial support to watch above its 50 DMA line.
>>> The latest Featured Stock Update with an annotated graph appeared on 5/2/2011. Click here.
View all notes |
Alert me of new notes |
CANSLIM.net Company Profile |
SEC |
Zacks Reports |
StockTalk |
News |
Chart |
Request a new note
C
A N
S L
I M
|
HMSY
-
NASDAQ
H M S Holdings Corp
COMPUTER SOFTWARE and SERVICES - Healthcare Information Service
|
$76.02
|
-1.28
-1.66% |
$77.33
|
112,937
65.47% of 50 DAV
50 DAV is 172,500
|
$84.82
-10.37%
|
11/19/2010
|
$61.89
|
PP = $63.01
|
|
MB = $66.16
|
Most Recent Note - 5/13/2011 10:44:26 AM
G - Continuing to linger quietly below its 50 DMA line after damaging distribution in recent weeks. That short-term average may now act as resistance, while a rally above it would improve its technical stance. Deterioration below its recent chart low ($73.27) would raise more serious concerns and trigger an additional sell signal.
>>> The latest Featured Stock Update with an annotated graph appeared on 4/26/2011. Click here.
View all notes |
Alert me of new notes |
CANSLIM.net Company Profile |
SEC |
Zacks Reports |
StockTalk |
News |
Chart |
Request a new note
C
A N
S L
I M
|
Symbol/Exchange
Company Name
Industry Group |
PRICE |
CHANGE
(%Change) |
Day High |
Volume
(% DAV)
(% 50 day avg vol) |
52 Wk Hi
% From Hi |
Featured
Date |
Price
Featured |
Pivot Featured |
|
Max Buy |
HS
-
NYSE
Healthspring Inc
HEALTH SERVICES - Health Care Plans
|
$44.06
|
+0.62
1.43% |
$44.87
|
929,082
98.75% of 50 DAV
50 DAV is 940,800
|
$44.47
-0.92%
|
3/22/2011
|
$38.29
|
PP = $38.85
|
|
MB = $40.79
|
Most Recent Note - 5/16/2011 2:46:03 PM
G - Hit a new all-time high with today's gain, getting more extended from any sound base pattern. Prior highs define important chart support to watch along with its 50 DMA line in the $39-40 area. Violations would trigger technical sell signals.
>>> The latest Featured Stock Update with an annotated graph appeared on 4/21/2011. Click here.
View all notes |
Alert me of new notes |
CANSLIM.net Company Profile |
SEC |
Zacks Reports |
StockTalk |
News |
Chart |
Request a new note
C
A N
S L
I M
|
INFA
-
NASDAQ
Informatica Corp
COMPUTER SOFTWARE and SERVICES - Business Software and Services
|
$52.96
|
-1.18
-2.18% |
$54.50
|
1,748,415
165.44% of 50 DAV
50 DAV is 1,056,800
|
$56.49
-6.25%
|
3/24/2011
|
$50.04
|
PP = $49.86
|
|
MB = $52.35
|
Most Recent Note - 5/16/2011 4:08:22 PM
G - Churning above average volume for a third consecutive session today while consolidating above prior highs in the $49 area and its 50 DMA line, important chart support to watch. Subsequent violations would trigger technical sell signals.
>>> The latest Featured Stock Update with an annotated graph appeared on 4/27/2011. Click here.
View all notes |
Alert me of new notes |
CANSLIM.net Company Profile |
SEC |
Zacks Reports |
StockTalk |
News |
Chart |
Request a new note
C
A N
S L
I M
|
LULU
-
NASDAQ
Lululemon Athletica
MANUFACTURING - Textile Manufacturing
|
$94.07
|
-1.16
-1.22% |
$95.44
|
1,086,535
50.88% of 50 DAV
50 DAV is 2,135,500
|
$102.83
-8.52%
|
3/28/2011
|
$68.11
|
PP = $85.38
|
|
MB = $89.65
|
Most Recent Note - 5/13/2011 4:43:57 PM
G - Volume totals have been cooling and lighter than average in recent weeks while this high-ranked Retail-Apparel firm has been consolidating near its all-time highs. Prior highs and its 50 DMA line in the $85 area define important chart support to watch.
>>> The latest Featured Stock Update with an annotated graph appeared on 5/3/2011. Click here.
View all notes |
Alert me of new notes |
CANSLIM.net Company Profile |
SEC |
Zacks Reports |
StockTalk |
News |
Chart |
Request a new note
C
A N
S L
I M
|
MG
-
NYSE
Mistras Group Inc
DIVERSIFIED SERVICES - Bulding and Faci;ity Management Services
|
$16.50
|
-0.31
-1.84% |
$16.79
|
107,443
59.36% of 50 DAV
50 DAV is 181,000
|
$18.46
-10.62%
|
3/15/2011
|
$15.48
|
PP = $15.90
|
|
MB = $16.70
|
Most Recent Note - 5/13/2011 4:48:51 PM
G - It has not formed a sound base pattern and today it slumped to a close below its 50 DMA line. Completed a new Public Offering on 5/05/11 and it is consolidating -8.9% off its 52-week high. See the latest FSU analysis for more details and a new annotated graph.
>>> The latest Featured Stock Update with an annotated graph appeared on 5/12/2011. Click here.
View all notes |
Alert me of new notes |
CANSLIM.net Company Profile |
SEC |
Zacks Reports |
StockTalk |
News |
Chart |
Request a new note
C
A N
S L
I M
|
MWIV
-
NASDAQ
M W I Veterinary Supply
HEALTH SERVICES - Medical Instruments and; Supplies
|
$82.34
|
-0.68
-0.82% |
$83.52
|
76,107
76.26% of 50 DAV
50 DAV is 99,800
|
$86.99
-5.35%
|
11/4/2010
|
$61.79
|
PP = $59.60
|
|
MB = $62.58
|
Most Recent Note - 5/13/2011 10:49:03 AM
G - Hovering near its all-time high with volume totals cooling since 5/05/11 while stubbornly holding its ground. It has not formed a sound base pattern. Its 50 DMA line defines important support to watch.
>>> The latest Featured Stock Update with an annotated graph appeared on 5/5/2011. Click here.
View all notes |
Alert me of new notes |
CANSLIM.net Company Profile |
SEC |
Zacks Reports |
StockTalk |
News |
Chart |
Request a new note
C
A N
S L
I M
|
Symbol/Exchange
Company Name
Industry Group |
PRICE |
CHANGE
(%Change) |
Day High |
Volume
(% DAV)
(% 50 day avg vol) |
52 Wk Hi
% From Hi |
Featured
Date |
Price
Featured |
Pivot Featured |
|
Max Buy |
OPNT
-
NASDAQ
Opnet Technologies
INTERNET - Internet Software and Services
|
$38.41
|
-1.25
-3.14% |
$40.25
|
93,460
70.06% of 50 DAV
50 DAV is 133,400
|
$42.51
-9.64%
|
5/11/2011
|
$41.21
|
PP = $40.50
|
|
MB = $42.53
|
Most Recent Note - 5/16/2011 3:51:48 PM
Y - Slumping below its previously noted high close ($39.44 on 4/01/11) today with a loss on light volume completely negating its latest breakout, raising concerns.
>>> The latest Featured Stock Update with an annotated graph appeared on 5/11/2011. Click here.
View all notes |
Alert me of new notes |
CANSLIM.net Company Profile |
SEC |
Zacks Reports |
StockTalk |
News |
Chart |
Request a new note
C
A N
S L
I M
|
PCLN
-
NASDAQ
Priceline.Com Inc
INTERNET - Internet Software and Services
|
$503.38
|
-17.23
-3.31% |
$519.33
|
1,466,700
130.44% of 50 DAV
50 DAV is 1,124,400
|
$561.88
-10.41%
|
1/3/2011
|
$399.55
|
PP = $428.20
|
|
MB = $449.61
|
Most Recent Note - 5/16/2011 3:20:16 PM
G - Technically, its considerable loss today has it trading -10.4% off its 52-week high and slumping below its 50 DMA line raising concerns. That short-term average has been a reliable support level this year.
>>> The latest Featured Stock Update with an annotated graph appeared on 4/20/2011. Click here.
View all notes |
Alert me of new notes |
CANSLIM.net Company Profile |
SEC |
Zacks Reports |
StockTalk |
News |
Chart |
Request a new note
C
A N
S L
I M
|
RAX
-
NYSE
Rackspace Hosting Inc
INTERNET - Internet Software and; Services
|
$40.70
|
-1.50
-3.55% |
$42.48
|
1,859,436
107.28% of 50 DAV
50 DAV is 1,733,300
|
$46.50
-12.46%
|
3/16/2011
|
$36.28
|
PP = $40.72
|
|
MB = $42.76
|
Most Recent Note - 5/16/2011 3:36:38 PM
G - Down today, slumping below its 50 DMA line again, raising concerns. Deterioration below its recent chart low ($38.84) would trigger a more worrisome technical sell signal. It has not formed a sound new base.
>>> The latest Featured Stock Update with an annotated graph appeared on 5/13/2011. Click here.
View all notes |
Alert me of new notes |
CANSLIM.net Company Profile |
SEC |
Zacks Reports |
StockTalk |
News |
Chart |
Request a new note
C
A N
S L
I M
|
TIBX
-
NASDAQ
Tibco Software Inc
COMPUTER SOFTWARE and SERVICES - Business Software and Services
|
$28.37
|
-1.12
-3.80% |
$29.64
|
1,954,467
74.88% of 50 DAV
50 DAV is 2,610,200
|
$30.75
-7.74%
|
3/18/2011
|
$23.88
|
PP = $26.04
|
|
MB = $27.34
|
Most Recent Note - 5/16/2011 3:44:14 PM
G - Volume totals have been cooling while consolidating above its 50 DMA line, extended from a sound base pattern. Technically, that short-term average and recent low ($27.17) mark important chart support levels to watch where violations may trigger sell signals.
>>> The latest Featured Stock Update with an annotated graph appeared on 4/14/2011. Click here.
View all notes |
Alert me of new notes |
CANSLIM.net Company Profile |
SEC |
Zacks Reports |
StockTalk |
News |
Chart |
Request a new note
C
A N
S L
I M
|
ULTA
-
NASDAQ
Ulta Salon Cosm & Frag
SPECIALTY RETAIL - Specialty Retail, Other
|
$53.35
|
-2.16
-3.89% |
$56.00
|
492,805
82.24% of 50 DAV
50 DAV is 599,200
|
$56.87
-6.19%
|
1/6/2011
|
$36.12
|
PP = $37.34
|
|
MB = $39.21
|
Most Recent Note - 5/16/2011 3:45:36 PM
G - Quietly touched a new all-time high on the prior session, and it is extended from any sound base pattern. Its 50 DMA line defines chart support to watch well above prior highs.
>>> The latest Featured Stock Update with an annotated graph appeared on 4/28/2011. Click here.
View all notes |
Alert me of new notes |
CANSLIM.net Company Profile |
SEC |
Zacks Reports |
StockTalk |
News |
Chart |
Request a new note
C
A N
S L
I M
|
Symbol/Exchange
Company Name
Industry Group |
PRICE |
CHANGE
(%Change) |
Day High |
Volume
(% DAV)
(% 50 day avg vol) |
52 Wk Hi
% From Hi |
Featured
Date |
Price
Featured |
Pivot Featured |
|
Max Buy |
|
|
|
THESE ARE NOT BUY RECOMMENDATIONS!
Comments contained in the body of this report are technical
opinions only. The material herein has been obtained
from sources believed to be reliable and accurate, however,
its accuracy and completeness cannot be guaranteed.
This site is not an investment advisor, hence it does
not endorse or recommend any securities or other investments.
Any recommendation contained in this report may not
be suitable for all investors and it is not to be deemed
an offer or solicitation on our part with respect to
the purchase or sale of any securities. All trademarks,
service marks and trade names appearing in this report
are the property of their respective owners, and are
likewise used for identification purposes only.
This report is a service available
only to active Paid Premium Members.
You may opt-out of receiving report notifications
at any time. Questions or comments may be submitted
by writing to Premium Membership Services 665 S.E. 10 Street, Suite 201 Deerfield Beach, FL 33441-5634 or by calling 1-800-965-8307
or 954-785-1121.
|
|
|

