You are not logged in.
This means you
CAN ONLY VIEW reports that were published prior to Monday, April 14, 2025.
You
MUST UPGRADE YOUR MEMBERSHIP if you want to see any current reports.
AFTER MARKET UPDATE - WEDNESDAY, MAY 15TH, 2013
Previous After Market Report Next After Market Report >>>
|
|
|
|
DOW |
+60.44 |
15,275.69 |
+0.40% |
|
Volume |
742,251,760 |
+6% |
|
Volume |
1,759,143,140 |
+1% |
|
NASDAQ |
+9.01 |
3,471.62 |
+0.26% |
|
Advancers |
1,652 |
53% |
|
Advancers |
1,390 |
54% |
|
S&P 500 |
+8.44 |
1,658.78 |
+0.51% |
|
Decliners |
1,370 |
44% |
|
Decliners |
1,081 |
42% |
|
Russell 2000 |
+2.58 |
988.54 |
+0.26% |
|
52 Wk Highs |
515 |
|
|
52 Wk Highs |
291 |
|
|
S&P 600 |
+1.90 |
556.01 |
+0.34% |
|
52 Wk Lows |
25 |
|
|
52 Wk Lows |
16 |
|
|
 |
Major Averages Extend Rally for Record Highs
Kenneth J. Gruneisen - Passed the CAN SLIM® Master's Exam
The major averages recovered from early losses to end the session unanimously higher on Wednesday as stocks continued their winning ways. Behind the gains the volume totals were reported higher than the prior session totals on the Nasdaq exchange and on the NYSE, another encouraging indication that institutional investors were accumulating shares. Advancing issues led decliners by a narrow 8-7 margin on the NYSE and by a 7-5 margin on the Nasdaq exchange. There were 149 high-ranked companies from the CANSLIM.net Leaders List making new 52-week highs and appearing on the CANSLIM.net BreakOuts Page, up from the prior session total of 136 stocks. New 52-week highs totals expanded and easily outnumbered new 52-week lows on both the NYSE and the Nasdaq exchange. There were gains for 8 of the 15 high-ranked companies currently included on the Featured Stocks Page.
The Dow Jones Industrial Average and the S&P 500 Index hit fresh all-time highs as the major averages extended their rally despite disappointing reports on manufacturing. Before the open, a report showed activity in the New York region unexpectedly contracted in May. Separate releases showed the largest decline in industrial production since last August. The market was higher even after the euro zone's GDP contracted for a sixth consecutive quarter. The disappointing data prompted speculation of further Fed induced stimulus measures which helped stocks rebound.
Most sectors finished in positive territory with defensives outperforming cyclicals. Utilities and Consumer Staples were the best performing groups as Southern Co. (SO +0.86%) and Procter & Gamble (PG +1.52%) rose. Energy shares including Chevron Corp (CVX -0.80%) fell, and Technology stocks were also among the worst performers as Apple Inc (AAPL -3.38%) extended its slump.
Agilent Technologies (A +3.89%) and Macy's (M +2.49%) posted solid gains after their latest earnings news, meanwhile from Deere (DE -4.40%) was notable decliner. As the first quarter earnings season comes to a close, investors will focus on the latest profit tally from Cisco Systems (CSCO -0.28%) and upcoming results from Wal-Mart (WMT +1.37%) and Dell (DELL -0.15%).
Treasuries snapped a four day decline with the 10-year note up 8/32 to yield 1.94% and the 30-year bond gaining 17/32 to yield 3.16%.
The market (M criteria) saw an expansion in leadership (stocks hitting new 52-week highs) that reassured investors a confirmed uptrend is at hand. Watch for new stocks featured in the CANSLIM.net Mid-Day BreakOuts Report. Action-worthy leaders are covered on an ongoing basis with the latest notes and additional resource links included on the Featured Stocks Page. Watch for an announcement via email concerning the next WEBCAST. The webcast will also be available via an updated link highlighted at the top of the Premium Member Homepage.
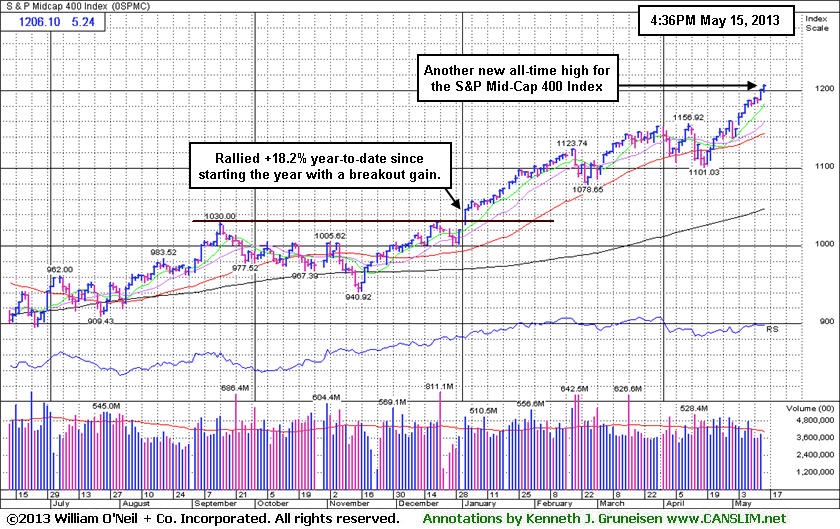
PICTURED: The S&P Mid Cap 400 Index is at an all-time high and it has rallied +18.2% year-to-date after technically breaking out at the start of the year. The indices' rally to new highs confirmed the market's uptrend which means odds are favorable for new buying efforts in stocks meeting all of the fact-based investment system's key criteria.
|
 Kenneth J. Gruneisen started out as a licensed stockbroker in August 1987, a couple of months prior to the historic stock market crash that took the Dow Jones Industrial Average down -22.6% in a single day. He has published daily fact-based fundamental and technical analysis on high-ranked stocks online for two decades. Through FACTBASEDINVESTING.COM, Kenneth provides educational articles, news, market commentary, and other information regarding proven investment systems that work in good times and bad.
Comments contained in the body of this report are technical opinions only and are not necessarily those of Gruneisen Growth Corp. The material herein has been obtained from sources believed to be reliable and accurate, however, its accuracy and completeness cannot be guaranteed. Our firm, employees, and customers may effect transactions, including transactions contrary to any recommendation herein, or have positions in the securities mentioned herein or options with respect thereto. Any recommendation contained in this report may not be suitable for all investors and it is not to be deemed an offer or solicitation on our part with respect to the purchase or sale of any securities. |
|
 |
Retail, Bank, and Tech Groups Led Gainers; XAU Dives at Recent Lows
Kenneth J. Gruneisen - Passed the CAN SLIM® Master's Exam
The Retail Index ($RLX +0.75%) tallied a 10th consecutive gain and a solid gain from the Bank Index ($BKX +1.10%) was also a positive influence on the major averages on Wednesday. Most tech areas has a positive bias as the Networking Index ($NWX +0.49%), Internet Index ($IIX +0.86%), and the Semiconductor Index ($SOX +0.97%) each ended higher. The Broker/Dealer Index ($XBD +0.14%) posted a smaller gain.
The Gold & Silver Index ($XAU -4.01%) was a clear laggard as it suffered a large loss. Weakness in energy-related shares pushed the Integrated Oil Index ($XOI -0.75%) and the Oil Services Index ($OSX -0.18%) lower. The Biotechnology Index ($BTK -1.43%) slumped for a large loss and the Healthcare Index ($HMO +0.05%) finished flat.
Charts courtesy www.stockcharts.com
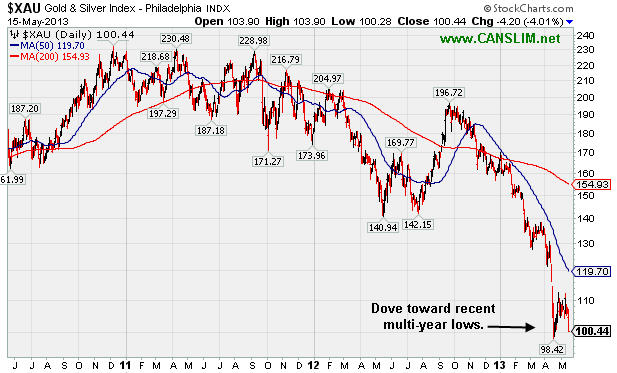
PICTURED: The Gold & Silver Index ($XAU -4.01%) dove toward recent multi-year lows, clearly lagging growth-oriented groups once again.
| Oil Services |
$OSX |
259.64 |
-0.46 |
-0.18% |
+17.93% |
| Healthcare |
$HMO |
3,123.55 |
+1.57 |
+0.05% |
+24.24% |
| Integrated Oil |
$XOI |
1,393.35 |
-10.47 |
-0.75% |
+12.20% |
| Semiconductor |
$SOX |
467.82 |
+4.49 |
+0.97% |
+21.81% |
| Networking |
$NWX |
237.85 |
+1.15 |
+0.49% |
+4.99% |
| Internet |
$IIX |
384.02 |
+3.27 |
+0.86% |
+17.44% |
| Broker/Dealer |
$XBD |
123.81 |
+0.18 |
+0.14% |
+31.25% |
| Retail |
$RLX |
794.20 |
+5.94 |
+0.75% |
+21.61% |
| Gold & Silver |
$XAU |
100.44 |
-4.20 |
-4.01% |
-39.35% |
| Bank |
$BKX |
60.51 |
+0.66 |
+1.10% |
+18.00% |
| Biotech |
$BTK |
2,036.01 |
-29.50 |
-1.43% |
+31.61% |
|
|
|
 |
Bullish Action Rewarded Investors Watching Still For Sell Signals
Kenneth J. Gruneisen - Passed the CAN SLIM® Master's Exam
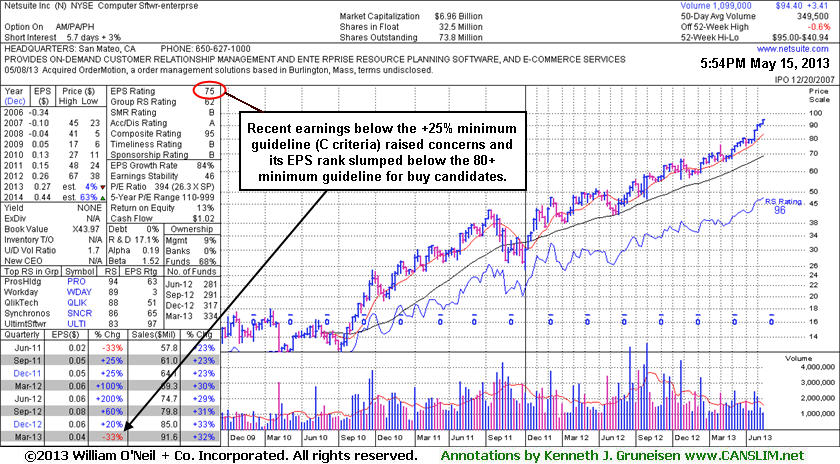
Netsuite Inc (N -$0.22 or -0.23% to $94.40) technically is extended from any sound base, and finished with a small loss after touching yet another new all-time high today, pausing following 3 consecutive gains backed average volume. Its annotated weekly graph below shows it on track for a 6th consecutive weekly gain. Fundamentally, concerns were raised as it recently reported earnings -33% on +32% sales revenues for the Mar '13 quarter, marking a 2nd consecutive quarterly comparison with earnings below the +25% minimum guideline (C criteria). Its Earnings Per Share Rating (EPS) subsequently has slumped to 75, below the 80+ minimum guideline for buy candidates. Its last appearance in this FSU section was on 4/22/13 with an annotated graph under the headline, "New Flat Base Formed, But Fundamental Concerns Remain" while trading in a tight range near its all-time high. It was then noted - "It has formed an orderly flat base however, due to fundamental concerns, no new pivot point is being cited. A subsequent volume-driven gain into new high territory may trigger a new (or add-on) technical buy signal, however historic studies showed that the markets best winners had a combination of strong fundamentals (earnings history) coupled with bullish technical (price/volume) action."
The number of top-rated funds owning its shares rose from 201 in Jun '11 to 334 in Mar '13, a reassuring sign concerning the I criteria. Its current Up/Down Volume Ratio of 1.7 is an unbiased indication its shares have been under accumulation over the past 50 days. Bullish action has continued to reward patient investors still giving it the benefit of the doubt until any technical sell signals start adding up. Its 50-day moving average (DMA) line ($81.14 now) defines important near-term support to watch where a violation would raise concerns. Its prior report of earnings +20% on +33% sales revenues for the Dec '12 quarter was below the +25% minimum earnings guideline (C criteria), first raising fundamental concerns for followers of the fact-based investment system. The company had reported earnings increases above the +25% minimum earnings guideline (C criteria) in the 5 prior quarterly comparisons. Its annual earnings (A criteria) history improved from losses prior to FY '09.
Investors are taught in the Certification to only buy stocks with a combination of both strong fundamentals and strong technical action, however stocks should be sold based on their technical action only. In this example, bullish action has continued to reward patient investors still giving it the benefit of the doubt until any technical sell signals start adding up.
 |
|
|
Color Codes Explained :
Y - Better candidates highlighted by our
staff of experts.
G - Previously featured
in past reports as yellow but may no longer be buyable under the
guidelines.
***Last / Change / Volume data in this table is the closing quote data***
Symbol/Exchange
Company Name
Industry Group |
PRICE |
CHANGE
(%Change) |
Day High |
Volume
(% DAV)
(% 50 day avg vol) |
52 Wk Hi
% From Hi |
Featured
Date |
Price
Featured |
Pivot Featured |
|
Max Buy |
AL
-
NYSE
Air Lease Corp Cl A
DIVERSIFIED SERVICES - Rental and Leasing Services
|
$30.19
|
+1.82
6.42% |
$30.40
|
818,498
173.41% of 50 DAV
50 DAV is 472,000
|
$31.00
-2.61%
|
5/9/2013
|
$30.95
|
PP = $29.38
|
|
MB = $30.85
|
 Most Recent Note - 5/15/2013 1:51:39 PM
Y - Rallying from support at its 50 DMA line and back above its pivot point with today's considerable gain backed by above average volume. Recently reported earnings +38% on +45% sales revenues for the Mar '13 quarter after highlighted in yellow in the 5/09/13 mid-day report (read here) with a pivot point cited based on its 4/09/13 high while rallying from a "double bottom" base.
>>> The latest Featured Stock Update with an annotated graph appeared on 5/9/2013. Click here.
View all notes |
Alert me of new notes |
CANSLIM.net Company Profile |
SEC |
Zacks Reports |
StockTalk |
News |
Chart |
Request a new note
C
A N
S L
I M


|
AMBA
-
NASDAQ
Ambarella Inc
ELECTRONICS - Semiconductor - Specialized
|
$15.21
|
+1.06
7.49% |
$15.25
|
952,552
162.11% of 50 DAV
50 DAV is 587,600
|
$16.00
-4.94%
|
5/6/2013
|
$15.31
|
PP = $16.10
|
|
MB = $16.91
|
Most Recent Note - 5/15/2013 1:54:07 PM
Y - Rebounding today with a solid gain erasing the prior session's damaging loss on above average volume. Previous notes cautioned - "Volume-driven gains above the new pivot point are needed to trigger a new technical buy signal. Still basing, with near-term resistance due to overhead supply up through the $16 level. Found encouraging support at its 50 DMA line and flashed above average volume behind recent gains while building on a new base."
>>> The latest Featured Stock Update with an annotated graph appeared on 5/6/2013. Click here.
View all notes |
Alert me of new notes |
CANSLIM.net Company Profile |
SEC |
Zacks Reports |
StockTalk |
News |
Chart |
Request a new note
C
A N
S L
I M
|
CELG
-
NASDAQ
Celgene Corp
DRUGS - Drug Manufacturers - Major
|
$129.63
|
-0.54
-0.41% |
$131.42
|
2,419,170
77.16% of 50 DAV
50 DAV is 3,135,400
|
$131.82
-1.66%
|
3/27/2013
|
$113.24
|
PP = $115.54
|
|
MB = $121.32
|
Most Recent Note - 5/13/2013 6:01:50 PM
G - Rallied to another new high with today's 2nd consecutive gain backed by slightly above average volume. Found support at its 50 DMA line during its recent consolidation. It is extended from any sound base pattern. See the latest FSU analysis for more details and a new annotated graph.
>>> The latest Featured Stock Update with an annotated graph appeared on 5/13/2013. Click here.
View all notes |
Alert me of new notes |
CANSLIM.net Company Profile |
SEC |
Zacks Reports |
StockTalk |
News |
Chart |
Request a new note
C
A N
S L
I M
|
CMCSA
-
NASDAQ
Comcast Corp Cl A
MEDIA - CATV Systems
|
$43.73
|
+0.40
0.92% |
$43.74
|
7,831,987
65.92% of 50 DAV
50 DAV is 11,880,200
|
$43.64
0.20%
|
12/3/2012
|
$37.08
|
PP = $38.06
|
|
MB = $39.96
|
Most Recent Note - 5/13/2013 6:02:32 PM
G - Despite fundamental concerns repeatedly noted it remains perched at its 52-week high. Reported earnings +13% on +3% sales revenues for the Mar '13 quarter, the 2nd consecutive quarterly comparison with earnings well below the +25% minimum guideline (C criteria).
>>> The latest Featured Stock Update with an annotated graph appeared on 4/16/2013. Click here.
View all notes |
Alert me of new notes |
CANSLIM.net Company Profile |
SEC |
Zacks Reports |
StockTalk |
News |
Chart |
Request a new note
C
A N
S L
I M
|
EQM
-
NYSE
E Q T Midstream Partners
ENERGY - Oil and Gas Pipelines
|
$48.00
|
+0.31
0.65% |
$48.00
|
131,337
167.10% of 50 DAV
50 DAV is 78,600
|
$49.10
-2.24%
|
4/25/2013
|
$40.16
|
PP = $40.84
|
|
MB = $42.88
|
Most Recent Note - 5/14/2013 4:37:15 PM
G - Volume totals have been cooling while holding its ground near its all-time high, a sign that few investors have headed for the exit. It is extended from its latest base, meanwhile prior highs in the $40 area define support to watch along with its 50 DMA line.
>>> The latest Featured Stock Update with an annotated graph appeared on 4/25/2013. Click here.
View all notes |
Alert me of new notes |
CANSLIM.net Company Profile |
SEC |
Zacks Reports |
StockTalk |
News |
Chart |
Request a new note
C
A N
S L
I M
|
Symbol/Exchange
Company Name
Industry Group |
PRICE |
CHANGE
(%Change) |
Day High |
Volume
(% DAV)
(% 50 day avg vol) |
52 Wk Hi
% From Hi |
Featured
Date |
Price
Featured |
Pivot Featured |
|
Max Buy |
FLT
-
NYSE
Fleetcor Technologies
DIVERSIFIED SERVICES - Business/Management Services
|
$81.90
|
-2.31
-2.74% |
$82.75
|
1,615,547
182.05% of 50 DAV
50 DAV is 887,400
|
$85.56
-4.28%
|
3/21/2013
|
$71.14
|
PP = $73.00
|
|
MB = $76.65
|
Most Recent Note - 5/15/2013 5:48:32 PM
G - Gapped down today for a small loss with above average volume. It was repeatedly noted - "Extended from any sound base pattern. Its 50 DMA line and recent low ($70.09) define near-term support where violations would raise more serious concerns and trigger worrisome technical sell signals."
>>> The latest Featured Stock Update with an annotated graph appeared on 5/8/2013. Click here.
View all notes |
Alert me of new notes |
CANSLIM.net Company Profile |
SEC |
Zacks Reports |
StockTalk |
News |
Chart |
Request a new note
C
A N
S L
I M
|
LNKD
-
NYSE
Linkedin Corp Class A
INTERNET - Internet Information Providers
|
$184.81
|
+0.41
0.22% |
$192.56
|
3,861,246
166.25% of 50 DAV
50 DAV is 2,322,600
|
$202.91
-8.92%
|
4/12/2013
|
$182.69
|
PP = $184.25
|
|
MB = $193.46
|
Most Recent Note - 5/15/2013 12:27:18 PM
Y - Rebounded above its 50 DMA line helping its technical stance improve, and on track for a 3rd consecutive gain with ever-increasing volume. Recent lows in the $171 area define important near-term support above the 4/03/13 low ($165), levels where subsequent violations may raise greater concerns and trigger more worrisome technical sell signals.
>>> The latest Featured Stock Update with an annotated graph appeared on 4/29/2013. Click here.
View all notes |
Alert me of new notes |
CANSLIM.net Company Profile |
SEC |
Zacks Reports |
StockTalk |
News |
Chart |
Request a new note
C
A N
S L
I M
|
LOPE
-
NASDAQ
Grand Canyon Education
DIVERSIFIED SERVICES - Education and; Training Services
|
$31.33
|
+0.88
2.89% |
$31.44
|
641,528
175.86% of 50 DAV
50 DAV is 364,800
|
$31.24
0.29%
|
5/10/2013
|
$29.03
|
PP = $27.28
|
|
MB = $28.64
|
Most Recent Note - 5/15/2013 4:34:04 PM
G - Added to its spurt of volume-driven gains today, getting very extended from prior highs. Stubbornly held its ground since featured in the 5/10/13 mid-day report and in greater detail in the Featured Stock Update (FSU) section following a recent "breakaway gap". Prior highs in the $27 area define initial support to watch on pullbacks.
>>> The latest Featured Stock Update with an annotated graph appeared on 5/10/2013. Click here.
View all notes |
Alert me of new notes |
CANSLIM.net Company Profile |
SEC |
Zacks Reports |
StockTalk |
News |
Chart |
Request a new note
C
A N
S L
I M
|
MRLN
-
NASDAQ
Marlin Business Services
DIVERSIFIED SERVICES - Rental and Leasing Services
|
$23.90
|
-1.19
-4.74% |
$25.42
|
54,036
221.46% of 50 DAV
50 DAV is 24,400
|
$25.97
-7.97%
|
3/15/2013
|
$22.29
|
PP = $23.18
|
|
MB = $24.34
|
Most Recent Note - 5/15/2013 12:37:24 PM
Y - Down considerably today with above average volume slumping below its "max buy" level and its color code is changed to yellow. Prior highs in the $23 area define important chart support to watch coinciding with its 50 DMA line where subsequent violations may raise concerns and trigger technical sell signals.
>>> The latest Featured Stock Update with an annotated graph appeared on 5/2/2013. Click here.
View all notes |
Alert me of new notes |
CANSLIM.net Company Profile |
SEC |
Zacks Reports |
StockTalk |
News |
Chart |
Request a new note
C
A N
S L
I M
|
N
-
NYSE
Netsuite Inc
DIVERSIFIED SERVICES - Business/Management Services
|
$94.40
|
-0.22
-0.23% |
$95.00
|
445,151
127.37% of 50 DAV
50 DAV is 349,500
|
$94.78
-0.40%
|
12/12/2012
|
$64.75
|
PP = $67.12
|
|
MB = $70.48
|
Most Recent Note - 5/15/2013 6:16:26 PM
G - Perched at its all-time high, extended from any sound base while on track for its 6th straight weekly gain. Fundamentally, concerns were raised by 2 consecutive quarterly comparisons with earnings below the minimum guideline (C criteria). See the latest FSU analysis for more details and a new annotated weekly graph.
>>> The latest Featured Stock Update with an annotated graph appeared on 5/15/2013. Click here.
View all notes |
Alert me of new notes |
CANSLIM.net Company Profile |
SEC |
Zacks Reports |
StockTalk |
News |
Chart |
Request a new note
C
A N
S L
I M
|
Symbol/Exchange
Company Name
Industry Group |
PRICE |
CHANGE
(%Change) |
Day High |
Volume
(% DAV)
(% 50 day avg vol) |
52 Wk Hi
% From Hi |
Featured
Date |
Price
Featured |
Pivot Featured |
|
Max Buy |
NSM
-
NYSE
Nationstar Mtg Hldgs Inc
FINANCIAL SERVICES - Credit Services
|
$44.80
|
-0.16
-0.36% |
$45.42
|
1,018,847
83.63% of 50 DAV
50 DAV is 1,218,300
|
$46.91
-4.50%
|
5/7/2013
|
$39.71
|
PP = $42.34
|
|
MB = $44.46
|
Most Recent Note - 5/14/2013 2:19:00 PM
G - Color code is changed to green after rallying beyond its "max buy" level for another new all-time high with today's 7th consecutive volume-driven gain. Technically, the gain above its new pivot point on 5/09/13 triggered a technical buy signal. Highlighted in the 5/07/13 mid-day report with an annotated daily graph (read here) and covered in more detail in the latest FSU analysis with an annotated weekly graph.
>>> The latest Featured Stock Update with an annotated graph appeared on 5/7/2013. Click here.
View all notes |
Alert me of new notes |
CANSLIM.net Company Profile |
SEC |
Zacks Reports |
StockTalk |
News |
Chart |
Request a new note
C
A N
S L
I M
|
PRAA
-
NASDAQ
Portfolio Recovery Assoc
DIVERSIFIED SERVICES - Business/Management Services
|
$150.00
|
+1.03
0.69% |
$151.00
|
123,377
180.90% of 50 DAV
50 DAV is 68,200
|
$149.69
0.21%
|
5/1/2013
|
$130.77
|
PP = $127.88
|
|
MB = $134.27
|
Most Recent Note - 5/15/2013 12:47:26 PM
G - Inching further into new high territory with today's 13th consecutive gain. Very extended from prior highs in the $127 area coinciding with its 50 DMA line defining important chart support.
>>> The latest Featured Stock Update with an annotated graph appeared on 5/1/2013. Click here.
View all notes |
Alert me of new notes |
CANSLIM.net Company Profile |
SEC |
Zacks Reports |
StockTalk |
News |
Chart |
Request a new note
C
A N
S L
I M
|
PRLB
-
NYSE
Proto Labs Inc
MANUFACTURING - Small Tools and Accessories
|
$54.69
|
-2.10
-3.70% |
$55.94
|
844,809
157.17% of 50 DAV
50 DAV is 537,500
|
$59.84
-8.61%
|
5/3/2013
|
$54.77
|
PP = $54.01
|
|
MB = $56.71
|
Most Recent Note - 5/15/2013 12:49:48 PM
Y - Gapped down today, retreating below its "max buy" level and its color code is changed to yellow. Prior highs in the $54-55 area define support to watch above its 50 DMA line.
>>> The latest Featured Stock Update with an annotated graph appeared on 5/3/2013. Click here.
View all notes |
Alert me of new notes |
CANSLIM.net Company Profile |
SEC |
Zacks Reports |
StockTalk |
News |
Chart |
Request a new note
C
A N
S L
I M
|
RRTS
-
NYSE
Roadrunner Trans Systems
TRANSPORTATION - Air Delivery and Freight Service
|
$27.08
|
+0.58
2.19% |
$27.29
|
245,969
126.20% of 50 DAV
50 DAV is 194,900
|
$26.54
2.03%
|
4/3/2013
|
$22.77
|
PP = $23.75
|
|
MB = $24.94
|
Most Recent Note - 5/14/2013 4:33:16 PM
G - Finished strong today with a gain on average volume for another new all-time high, getting more extended from its latest base. Prior highs in the $23 area define initial support to watch above its 50 DMA line.
>>> The latest Featured Stock Update with an annotated graph appeared on 5/14/2013. Click here.
View all notes |
Alert me of new notes |
CANSLIM.net Company Profile |
SEC |
Zacks Reports |
StockTalk |
News |
Chart |
Request a new note
C
A N
S L
I M
|
VRX
-
NYSE
Valeant Pharmaceuticals
DRUGS - Drug Manufacturers - Other
|
$76.33
|
-0.97
-1.25% |
$77.36
|
851,728
58.78% of 50 DAV
50 DAV is 1,448,900
|
$77.44
-1.43%
|
4/30/2013
|
$60.24
|
PP = $76.66
|
|
MB = $80.49
|
Most Recent Note - 5/13/2013 6:06:02 PM
Y- Finished 19 cents off its best-ever close with today's gain on average volume. The 50 DMA line and recent low ($69.87 on 4/04/13) define important support where subsequent violations may trigger technical sell signals. Prior reports cautioned - "Sub par earnings for the Mar '13 quarter below the +25% minimum guideline (C criteria) raised fundamental concerns."
>>> The latest Featured Stock Update with an annotated graph appeared on 4/30/2013. Click here.
View all notes |
Alert me of new notes |
CANSLIM.net Company Profile |
SEC |
Zacks Reports |
StockTalk |
News |
Chart |
Request a new note
C
A N
S L
I M
|
Symbol/Exchange
Company Name
Industry Group |
PRICE |
CHANGE
(%Change) |
Day High |
Volume
(% DAV)
(% 50 day avg vol) |
52 Wk Hi
% From Hi |
Featured
Date |
Price
Featured |
Pivot Featured |
|
Max Buy |
|
|
|
THESE ARE NOT BUY RECOMMENDATIONS!
Comments contained in the body of this report are technical
opinions only. The material herein has been obtained
from sources believed to be reliable and accurate, however,
its accuracy and completeness cannot be guaranteed.
This site is not an investment advisor, hence it does
not endorse or recommend any securities or other investments.
Any recommendation contained in this report may not
be suitable for all investors and it is not to be deemed
an offer or solicitation on our part with respect to
the purchase or sale of any securities. All trademarks,
service marks and trade names appearing in this report
are the property of their respective owners, and are
likewise used for identification purposes only.
This report is a service available
only to active Paid Premium Members.
You may opt-out of receiving report notifications
at any time. Questions or comments may be submitted
by writing to Premium Membership Services 665 S.E. 10 Street, Suite 201 Deerfield Beach, FL 33441-5634 or by calling 1-800-965-8307
or 954-785-1121.
|
|
|

