You are not logged in.
This means you
CAN ONLY VIEW reports that were published prior to Wednesday, April 9, 2025.
You
MUST UPGRADE YOUR MEMBERSHIP if you want to see any current reports.
AFTER MARKET UPDATE - TUESDAY, MAY 14TH, 2013
Previous After Market Report Next After Market Report >>>
|
|
|
|
DOW |
+123.57 |
15,215.25 |
+0.82% |
|
Volume |
700,152,110 |
+18% |
|
Volume |
1,741,710,950 |
+11% |
|
NASDAQ |
+23.82 |
3,462.61 |
+0.69% |
|
Advancers |
2,035 |
65% |
|
Advancers |
1,756 |
68% |
|
S&P 500 |
+16.57 |
1,650.34 |
+1.01% |
|
Decliners |
982 |
31% |
|
Decliners |
739 |
28% |
|
Russell 2000 |
+12.17 |
985.96 |
+1.25% |
|
52 Wk Highs |
477 |
|
|
52 Wk Highs |
272 |
|
|
S&P 600 |
+7.06 |
554.11 |
+1.29% |
|
52 Wk Lows |
14 |
|
|
52 Wk Lows |
14 |
|
|
 |
Indices Rally For New Highs on Higher Volume With Positive Breadth
Kenneth J. Gruneisen - Passed the CAN SLIM® Master's Exam
The major averages returned to their winning ways and ended unanimously higher on Tuesday. Behind the gains the volume totals were reported higher than the prior session totals on the Nasdaq exchange and on the NYSE, an encouraging indication that institutional investors were accumulating shares. Breadth was positive as advancing issues led decliners by a 2-1 margin on the NYSE and more than 2-1 on the Nasdaq exchange. There were 136 high-ranked companies from the CANSLIM.net Leaders List making new 52-week highs and appearing on the CANSLIM.net BreakOuts Page, up considerably from the prior session total of 81 stocks. New 52-week highs totals expanded and easily outnumbered new 52-week lows on both the NYSE and the Nasdaq exchange. There were gains for 10 of the 15 high-ranked companies currently included on the Featured Stocks Page.
The Dow was up for the 18th consecutive Tuesday as it rose 123 points to 15,215, a new all-time high. The S&P 500 Index gained over 16 points to close at a new all-time high of 1,650. The Nasdaq Composite Index finished at its best level since October 2000 as it advanced 23 points to 3,462.
The biggest jump since October 2010 in a gauge of small business optimism set the positive tone. Signs of limited inflation pressure provided additional support after import prices declined in April by the most since December 2012.
Virtually every sector finished in positive territory. Financials were the best performing group as Bank of America Corp (BAC +2.77%) and Citigroup Inc (C +2.39%) gained ground. Energy erased Monday's losses and also helped pace the advance as Chevron Corp (CVX +1.75%) and ConocoPhillips (COP +1.71%) rose. Technology stocks lagged behind as index heavyweight Apple Inc (AAPL -2.39%) fell following a report that its global market share in smartphones shrank in the first quarter.
The tail end of earnings season will also garner attention. Agilent Technologies (A +2.16%) posted its profit tally after the close, and Wednesday's docket includes notable reports from Deere (DE +1.29%), Macy's (M +1.09%) and Cisco Systems (CSCO).
In fixed-income, Treasuries were down for the fourth straight session. The 10-year note fell 12/32 to yield 1.97% and the 30-year bond lost a full point to yield 3.18%.
The market (M criteria) saw an expansion in leadership (stocks hitting new 52-week highs) that reassured investors a confirmed uptrend is at hand. Watch for new stocks featured in the CANSLIM.net Mid-Day BreakOuts Report. Action-worthy leaders are covered on an ongoing basis with the latest notes and additional resource links included on the Featured Stocks Page. Watch for an announcement via email concerning the next WEBCAST. The webcast will also be available via an updated link highlighted at the top of the Premium Member Homepage.
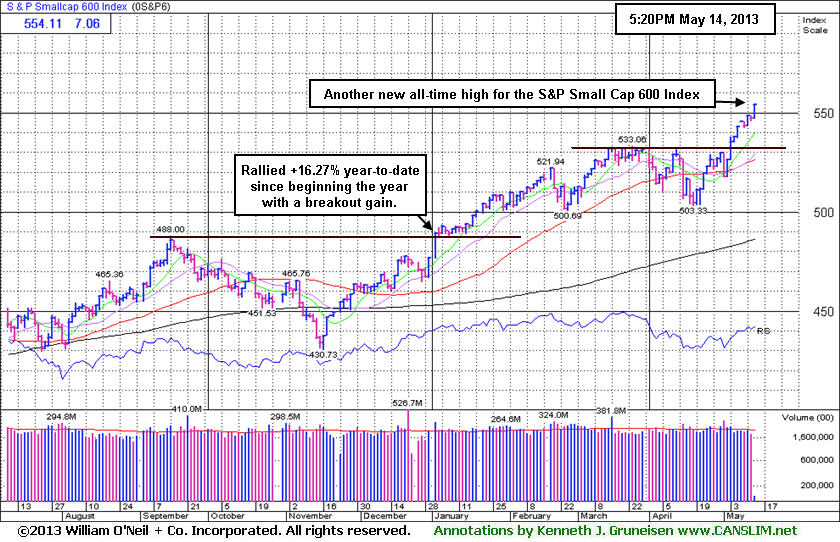
PICTURED: The S&P Small Cap 600 Index is at an all-time high and it has rallied +16.27% year-to-date after technically breaking out at the start of the year. The indices' rally to new highs confirmed the market's uptrend which means odds are favorable for new buying efforts in stocks meeting all of the fact-based investment system's key criteria.
|
 Kenneth J. Gruneisen started out as a licensed stockbroker in August 1987, a couple of months prior to the historic stock market crash that took the Dow Jones Industrial Average down -22.6% in a single day. He has published daily fact-based fundamental and technical analysis on high-ranked stocks online for two decades. Through FACTBASEDINVESTING.COM, Kenneth provides educational articles, news, market commentary, and other information regarding proven investment systems that work in good times and bad.
Comments contained in the body of this report are technical opinions only and are not necessarily those of Gruneisen Growth Corp. The material herein has been obtained from sources believed to be reliable and accurate, however, its accuracy and completeness cannot be guaranteed. Our firm, employees, and customers may effect transactions, including transactions contrary to any recommendation herein, or have positions in the securities mentioned herein or options with respect thereto. Any recommendation contained in this report may not be suitable for all investors and it is not to be deemed an offer or solicitation on our part with respect to the purchase or sale of any securities. |
|
 |
Retail Index Tallied 9th Consecutive Gain
Kenneth J. Gruneisen - Passed the CAN SLIM® Master's Exam
The positive influence of financial shares continued to boost the major averages as the Broker/Dealer Index ($XBD +2.22%) and the Bank Index ($BKX +1.80%) were among Tuesday's standout gainers. The Retail Index ($RLX +1.20%) posted a solid gain and the tech sector saw unanimous gains from the Networking Index ($NWX +0.81%), Internet Index ($IIX +0.85%), and the Semiconductor Index ($SOX +0.44%) while the Biotechnology Index ($BTK +1.94%) was a standout gainer. There were also gains from energy-related issues as the Integrated Oil Index ($XOI +1.68%) outpaced the Oil Services Index ($OSX +0.41%), and the Healthcare Index ($HMO +0.53%) also edged higher. Meanwhile, the Gold & Silver Index ($XAU -1.11%) was a clear laggard as the classic "safe haven" group finished in the red.
Charts courtesy www.stockcharts.com
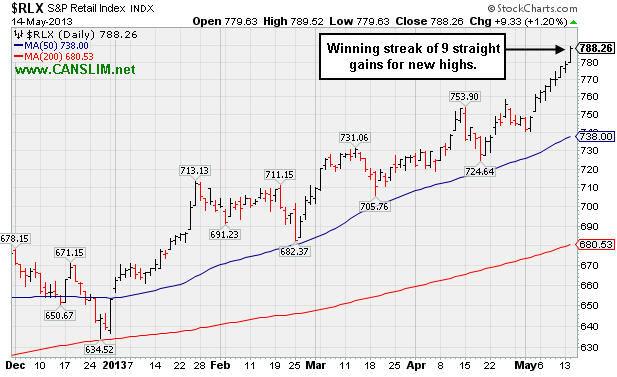
PICTURED: The Retail Index ($RLX +1.20%) extended its winning streak to 9 straight gains for new highs. Regular readers may recall the strength in the Retail Index has been noted as an encouraging sign in the past, as the American consumer's spending accounts for approximately 2/3 of the nation's economic activity.
| Oil Services |
$OSX |
260.10 |
+1.06 |
+0.41% |
+18.14% |
| Healthcare |
$HMO |
3,121.98 |
+16.47 |
+0.53% |
+24.17% |
| Integrated Oil |
$XOI |
1,403.81 |
+23.16 |
+1.68% |
+13.04% |
| Semiconductor |
$SOX |
463.33 |
+2.05 |
+0.44% |
+20.64% |
| Networking |
$NWX |
236.70 |
+1.90 |
+0.81% |
+4.48% |
| Internet |
$IIX |
380.74 |
+3.21 |
+0.85% |
+16.44% |
| Broker/Dealer |
$XBD |
123.63 |
+2.69 |
+2.22% |
+31.06% |
| Retail |
$RLX |
788.26 |
+9.33 |
+1.20% |
+20.70% |
| Gold & Silver |
$XAU |
104.64 |
-1.17 |
-1.11% |
-36.81% |
| Bank |
$BKX |
59.85 |
+1.06 |
+1.80% |
+16.71% |
| Biotech |
$BTK |
2,065.51 |
+39.38 |
+1.94% |
+33.51% |
|
|
|
 |
Technically Strong Despite Newly Noted Fundamental Shortcoming
Kenneth J. Gruneisen - Passed the CAN SLIM® Master's Exam
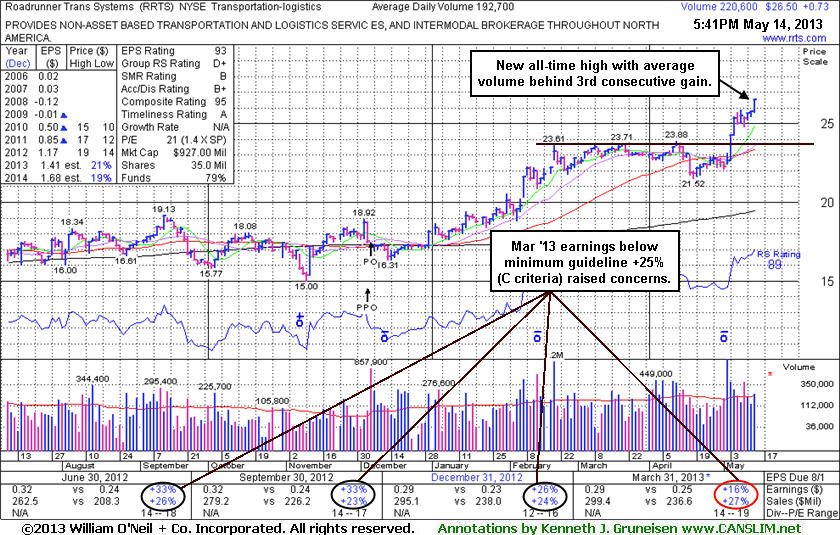
Roadrunner Transportation Systems Inc (RRTS $+0.73 or +2.83% to 26.50) finished strong today with a gain on average volume for another new all-time high, getting more extended from its latest base. Prior highs in the $23 area define support to watch above its 50-day moving average (DMA) line. Fundamentally, concerns have been raised by its report of earnings +16% on +27% sales revenues for the quarter ended March 31, 2013 versus the year ago period, below the +25% minimum earnings guideline (C criteria). Investors who may own it might choose to give the stock the benefit of the doubt unless it flashes any weak action, however a disciplined investor following the fact-based system would usually avoid making new buying efforts in any companies failing to solidly satisfy the fundamental guidelines.
Its last appearance in this FSU section was on 4/23/13 with an annotated graph under the headline, " Groups' Weakness and Slump Under 50 Day Moving Average Line Hurt Stance " after its violation of the recent low and slump below its 50-day moving average (DMA) line triggered technical sell signals. It was then noted - "Decelerating sales revenues and earnings increases in sequential quarterly comparisons through the Dec '12 quarter are noted as a concern. It is more ideal when a company shows accelerating sales revenues and earnings increases." It showed resilience near its 50 DMA line, then started the month of May with a spike higher with heavy volume behind big gains.
The number of top-rated funds owning its shares rose from 168 in Jun '12 to 197 in Mar '13, a reassuring sign concerning the I criteria. The company completed a new Public Offering on 12/06/12 and, technically, it broke out above previously stubborn resistance in $19 area with volume-driven gains in January. Regular readers may recall that, based on weak action, RRTS had been dropped from the Featured Stocks list on 5/18/12 following a choppy period.
|
|
|
Color Codes Explained :
Y - Better candidates highlighted by our
staff of experts.
G - Previously featured
in past reports as yellow but may no longer be buyable under the
guidelines.
***Last / Change / Volume data in this table is the closing quote data***
Symbol/Exchange
Company Name
Industry Group |
PRICE |
CHANGE
(%Change) |
Day High |
Volume
(% DAV)
(% 50 day avg vol) |
52 Wk Hi
% From Hi |
Featured
Date |
Price
Featured |
Pivot Featured |
|
Max Buy |
AL
-
NYSE
Air Lease Corp Cl A
DIVERSIFIED SERVICES - Rental and Leasing Services
|
$28.37
|
-1.17
-3.96% |
$29.59
|
939,138
201.14% of 50 DAV
50 DAV is 466,900
|
$31.00
-8.48%
|
5/9/2013
|
$30.95
|
PP = $29.38
|
|
MB = $30.85
|
 Most Recent Note - 5/14/2013 4:25:53 PM
Y - Finished near its 50 DMA line and near the session low with concerns raised by today's 3rd consecutive loss backed by above average volume, action indicating distributional pressure. Recently reported earnings +38% on +45% sales revenues for the Mar '13 quarter after highlighted in yellow in the 5/09/13 mid-day report (read here) with a pivot point cited based on its 4/09/13 high while rallying from a "double bottom" base.
>>> The latest Featured Stock Update with an annotated graph appeared on 5/9/2013. Click here.
View all notes |
Alert me of new notes |
CANSLIM.net Company Profile |
SEC |
Zacks Reports |
StockTalk |
News |
Chart |
Request a new note
C
A N
S L
I M


|
AMBA
-
NASDAQ
Ambarella Inc
ELECTRONICS - Semiconductor - Specialized
|
$14.15
|
-0.97
-6.42% |
$15.50
|
1,684,246
302.70% of 50 DAV
50 DAV is 556,400
|
$16.00
-11.56%
|
5/6/2013
|
$15.31
|
PP = $16.10
|
|
MB = $16.91
|
Most Recent Note - 5/14/2013 4:27:08 PM
Y - Finished near the session low today with a damaging loss on above average volume. Previous notes cautioned - "Volume-driven gains above the new pivot point are needed to trigger a new technical buy signal. Still basing, with near-term resistance due to overhead supply up through the $16 level. Found encouraging support at its 50 DMA line and flashed above average volume behind recent gains while building on a new base."
>>> The latest Featured Stock Update with an annotated graph appeared on 5/6/2013. Click here.
View all notes |
Alert me of new notes |
CANSLIM.net Company Profile |
SEC |
Zacks Reports |
StockTalk |
News |
Chart |
Request a new note
C
A N
S L
I M
|
CELG
-
NASDAQ
Celgene Corp
DRUGS - Drug Manufacturers - Major
|
$130.17
|
+0.51
0.39% |
$131.82
|
3,787,553
119.97% of 50 DAV
50 DAV is 3,157,000
|
$131.13
-0.73%
|
3/27/2013
|
$113.24
|
PP = $115.54
|
|
MB = $121.32
|
Most Recent Note - 5/13/2013 6:01:50 PM
G - Rallied to another new high with today's 2nd consecutive gain backed by slightly above average volume. Found support at its 50 DMA line during its recent consolidation. It is extended from any sound base pattern. See the latest FSU analysis for more details and a new annotated graph.
>>> The latest Featured Stock Update with an annotated graph appeared on 5/13/2013. Click here.
View all notes |
Alert me of new notes |
CANSLIM.net Company Profile |
SEC |
Zacks Reports |
StockTalk |
News |
Chart |
Request a new note
C
A N
S L
I M
|
CMCSA
-
NASDAQ
Comcast Corp Cl A
MEDIA - CATV Systems
|
$43.33
|
+0.14
0.32% |
$43.64
|
9,921,269
83.53% of 50 DAV
50 DAV is 11,877,300
|
$43.36
-0.07%
|
12/3/2012
|
$37.08
|
PP = $38.06
|
|
MB = $39.96
|
Most Recent Note - 5/13/2013 6:02:32 PM
G - Despite fundamental concerns repeatedly noted it remains perched at its 52-week high. Reported earnings +13% on +3% sales revenues for the Mar '13 quarter, the 2nd consecutive quarterly comparison with earnings well below the +25% minimum guideline (C criteria).
>>> The latest Featured Stock Update with an annotated graph appeared on 4/16/2013. Click here.
View all notes |
Alert me of new notes |
CANSLIM.net Company Profile |
SEC |
Zacks Reports |
StockTalk |
News |
Chart |
Request a new note
C
A N
S L
I M
|
EQM
-
NYSE
E Q T Midstream Partners
ENERGY - Oil and Gas Pipelines
|
$47.69
|
-0.34
-0.71% |
$47.90
|
39,312
49.14% of 50 DAV
50 DAV is 80,000
|
$49.10
-2.87%
|
4/25/2013
|
$40.16
|
PP = $40.84
|
|
MB = $42.88
|
Most Recent Note - 5/14/2013 4:37:15 PM
G - Volume totals have been cooling while holding its ground near its all-time high, a sign that few investors have headed for the exit. It is extended from its latest base, meanwhile prior highs in the $40 area define support to watch along with its 50 DMA line.
>>> The latest Featured Stock Update with an annotated graph appeared on 4/25/2013. Click here.
View all notes |
Alert me of new notes |
CANSLIM.net Company Profile |
SEC |
Zacks Reports |
StockTalk |
News |
Chart |
Request a new note
C
A N
S L
I M
|
Symbol/Exchange
Company Name
Industry Group |
PRICE |
CHANGE
(%Change) |
Day High |
Volume
(% DAV)
(% 50 day avg vol) |
52 Wk Hi
% From Hi |
Featured
Date |
Price
Featured |
Pivot Featured |
|
Max Buy |
FLT
-
NYSE
Fleetcor Technologies
DIVERSIFIED SERVICES - Business/Management Services
|
$84.21
|
+1.86
2.26% |
$84.54
|
899,000
101.82% of 50 DAV
50 DAV is 882,900
|
$85.56
-1.58%
|
3/21/2013
|
$71.14
|
PP = $73.00
|
|
MB = $76.65
|
Most Recent Note - 5/14/2013 4:29:09 PM
G - Another gain with average volume for a best-ever close, getting more extended from any sound base pattern. Its 50 DMA line and recent low ($70.09) define near-term support where violations would raise more serious concerns and trigger worrisome technical sell signals.
>>> The latest Featured Stock Update with an annotated graph appeared on 5/8/2013. Click here.
View all notes |
Alert me of new notes |
CANSLIM.net Company Profile |
SEC |
Zacks Reports |
StockTalk |
News |
Chart |
Request a new note
C
A N
S L
I M
|
LNKD
-
NYSE
Linkedin Corp Class A
INTERNET - Internet Information Providers
|
$184.40
|
+9.37
5.35% |
$185.48
|
3,905,611
169.31% of 50 DAV
50 DAV is 2,306,800
|
$202.91
-9.12%
|
4/12/2013
|
$182.69
|
PP = $184.25
|
|
MB = $193.46
|
Most Recent Note - 5/14/2013 4:22:59 PM
Y - Finished strong after rebounding above its 50 DMA line with a solid gain backed by above average volume helping its technical stance improve, and its color code is changed to yellow. Recent lows in the $171 area define important near-term support above the 4/03/13 low ($165), levels where subsequent violations may raise greater concerns and trigger more worrisome technical sell signals.
>>> The latest Featured Stock Update with an annotated graph appeared on 4/29/2013. Click here.
View all notes |
Alert me of new notes |
CANSLIM.net Company Profile |
SEC |
Zacks Reports |
StockTalk |
News |
Chart |
Request a new note
C
A N
S L
I M
|
LOPE
-
NASDAQ
Grand Canyon Education
DIVERSIFIED SERVICES - Education and; Training Services
|
$30.45
|
+0.88
2.98% |
$31.24
|
864,242
240.87% of 50 DAV
50 DAV is 358,800
|
$29.93
1.74%
|
5/10/2013
|
$29.03
|
PP = $27.28
|
|
MB = $28.64
|
Most Recent Note - 5/14/2013 12:39:22 PM
G - Color code is changed to green while rallying for a considerable gain today, getting too extended from prior highs. Stubbornly held its ground since featured in the 5/10/13 mid-day report and in greater detail in the Featured Stock Update (FSU) section following a recent "breakaway gap". Prior highs in the $27 area define initial support to watch on pullbacks.
>>> The latest Featured Stock Update with an annotated graph appeared on 5/10/2013. Click here.
View all notes |
Alert me of new notes |
CANSLIM.net Company Profile |
SEC |
Zacks Reports |
StockTalk |
News |
Chart |
Request a new note
C
A N
S L
I M
|
MRLN
-
NASDAQ
Marlin Business Services
DIVERSIFIED SERVICES - Rental and Leasing Services
|
$25.09
|
+0.00
0.00% |
$25.51
|
21,876
87.86% of 50 DAV
50 DAV is 24,900
|
$25.97
-3.39%
|
3/15/2013
|
$22.29
|
PP = $23.18
|
|
MB = $24.34
|
Most Recent Note - 5/13/2013 6:03:51 PM
G - Pulled back again today on below average volume yet it remains above its "max buy" level. No resistance remains due to overhead supply. Prior highs in the $23 area define support to watch on pullbacks.
>>> The latest Featured Stock Update with an annotated graph appeared on 5/2/2013. Click here.
View all notes |
Alert me of new notes |
CANSLIM.net Company Profile |
SEC |
Zacks Reports |
StockTalk |
News |
Chart |
Request a new note
C
A N
S L
I M
|
N
-
NYSE
Netsuite Inc
DIVERSIFIED SERVICES - Business/Management Services
|
$94.62
|
+2.51
2.73% |
$94.78
|
325,864
89.87% of 50 DAV
50 DAV is 362,600
|
$92.93
1.82%
|
12/12/2012
|
$64.75
|
PP = $67.12
|
|
MB = $70.48
|
Most Recent Note - 5/14/2013 4:31:27 PM
G - Technically it is extended, hitting yet another new all-time high with today's 3rd consecutive gain backed average volume. Fundamentally, concerns were raised as it recently reported earnings -33% on +32% sales revenues for the Mar '13 quarter, marking a 2nd consecutive quarterly comparison with earnings below the +25% minimum guideline (C criteria).
>>> The latest Featured Stock Update with an annotated graph appeared on 4/22/2013. Click here.
View all notes |
Alert me of new notes |
CANSLIM.net Company Profile |
SEC |
Zacks Reports |
StockTalk |
News |
Chart |
Request a new note
C
A N
S L
I M
|
Symbol/Exchange
Company Name
Industry Group |
PRICE |
CHANGE
(%Change) |
Day High |
Volume
(% DAV)
(% 50 day avg vol) |
52 Wk Hi
% From Hi |
Featured
Date |
Price
Featured |
Pivot Featured |
|
Max Buy |
NSM
-
NYSE
Nationstar Mtg Hldgs Inc
FINANCIAL SERVICES - Credit Services
|
$44.96
|
+1.15
2.62% |
$46.91
|
2,239,639
189.11% of 50 DAV
50 DAV is 1,184,300
|
$44.49
1.06%
|
5/7/2013
|
$39.71
|
PP = $42.34
|
|
MB = $44.46
|
Most Recent Note - 5/14/2013 2:19:00 PM
G - Color code is changed to green after rallying beyond its "max buy" level for another new all-time high with today's 7th consecutive volume-driven gain. Technically, the gain above its new pivot point on 5/09/13 triggered a technical buy signal. Highlighted in the 5/07/13 mid-day report with an annotated daily graph (read here) and covered in more detail in the latest FSU analysis with an annotated weekly graph.
>>> The latest Featured Stock Update with an annotated graph appeared on 5/7/2013. Click here.
View all notes |
Alert me of new notes |
CANSLIM.net Company Profile |
SEC |
Zacks Reports |
StockTalk |
News |
Chart |
Request a new note
C
A N
S L
I M
|
PRAA
-
NASDAQ
Portfolio Recovery Assoc
DIVERSIFIED SERVICES - Business/Management Services
|
$148.97
|
+2.04
1.39% |
$149.69
|
121,081
178.32% of 50 DAV
50 DAV is 67,900
|
$147.48
1.01%
|
5/1/2013
|
$130.77
|
PP = $127.88
|
|
MB = $134.27
|
Most Recent Note - 5/14/2013 2:21:10 PM
G - Spiking further into new high territory with today's 12th consecutive gain, getting very extended. Prior highs near $127 define near-term support to watch on pullbacks.
>>> The latest Featured Stock Update with an annotated graph appeared on 5/1/2013. Click here.
View all notes |
Alert me of new notes |
CANSLIM.net Company Profile |
SEC |
Zacks Reports |
StockTalk |
News |
Chart |
Request a new note
C
A N
S L
I M
|
PRLB
-
NYSE
Proto Labs Inc
MANUFACTURING - Small Tools and Accessories
|
$56.79
|
-0.13
-0.23% |
$59.24
|
467,920
86.88% of 50 DAV
50 DAV is 538,600
|
$59.84
-5.10%
|
5/3/2013
|
$54.77
|
PP = $54.01
|
|
MB = $56.71
|
Most Recent Note - 5/13/2013 4:01:29 PM
G - Gapped down today, retreating from its 52-week high and pulling back near its "max buy" level with light volume behind its loss. Prior highs in the $54-55 area define initial support to watch above its 50 DMA line.
>>> The latest Featured Stock Update with an annotated graph appeared on 5/3/2013. Click here.
View all notes |
Alert me of new notes |
CANSLIM.net Company Profile |
SEC |
Zacks Reports |
StockTalk |
News |
Chart |
Request a new note
C
A N
S L
I M
|
RRTS
-
NYSE
Roadrunner Trans Systems
TRANSPORTATION - Air Delivery and Freight Service
|
$26.50
|
+0.73
2.83% |
$26.54
|
220,601
114.48% of 50 DAV
50 DAV is 192,700
|
$25.85
2.51%
|
4/3/2013
|
$22.77
|
PP = $23.75
|
|
MB = $24.94
|
Most Recent Note - 5/14/2013 4:33:16 PM
G - Finished strong today with a gain on average volume for another new all-time high, getting more extended from its latest base. Prior highs in the $23 area define initial support to watch above its 50 DMA line.
>>> The latest Featured Stock Update with an annotated graph appeared on 5/14/2013. Click here.
View all notes |
Alert me of new notes |
CANSLIM.net Company Profile |
SEC |
Zacks Reports |
StockTalk |
News |
Chart |
Request a new note
C
A N
S L
I M
|
VRX
-
NYSE
Valeant Pharmaceuticals
DRUGS - Drug Manufacturers - Other
|
$77.30
|
+1.41
1.86% |
$77.44
|
1,425,063
96.87% of 50 DAV
50 DAV is 1,471,100
|
$76.57
0.95%
|
4/30/2013
|
$60.24
|
PP = $76.66
|
|
MB = $80.49
|
Most Recent Note - 5/13/2013 6:06:02 PM
Y- Finished 19 cents off its best-ever close with today's gain on average volume. The 50 DMA line and recent low ($69.87 on 4/04/13) define important support where subsequent violations may trigger technical sell signals. Prior reports cautioned - "Sub par earnings for the Mar '13 quarter below the +25% minimum guideline (C criteria) raised fundamental concerns."
>>> The latest Featured Stock Update with an annotated graph appeared on 4/30/2013. Click here.
View all notes |
Alert me of new notes |
CANSLIM.net Company Profile |
SEC |
Zacks Reports |
StockTalk |
News |
Chart |
Request a new note
C
A N
S L
I M
|
Symbol/Exchange
Company Name
Industry Group |
PRICE |
CHANGE
(%Change) |
Day High |
Volume
(% DAV)
(% 50 day avg vol) |
52 Wk Hi
% From Hi |
Featured
Date |
Price
Featured |
Pivot Featured |
|
Max Buy |
|
|
|
THESE ARE NOT BUY RECOMMENDATIONS!
Comments contained in the body of this report are technical
opinions only. The material herein has been obtained
from sources believed to be reliable and accurate, however,
its accuracy and completeness cannot be guaranteed.
This site is not an investment advisor, hence it does
not endorse or recommend any securities or other investments.
Any recommendation contained in this report may not
be suitable for all investors and it is not to be deemed
an offer or solicitation on our part with respect to
the purchase or sale of any securities. All trademarks,
service marks and trade names appearing in this report
are the property of their respective owners, and are
likewise used for identification purposes only.
This report is a service available
only to active Paid Premium Members.
You may opt-out of receiving report notifications
at any time. Questions or comments may be submitted
by writing to Premium Membership Services 665 S.E. 10 Street, Suite 201 Deerfield Beach, FL 33441-5634 or by calling 1-800-965-8307
or 954-785-1121.
|
|
|

