***Last / Change / Volume data in this table is the closing quote data***
Symbol/Exchange
Company Name
Industry Group |
PRICE |
CHANGE
(%Change) |
Day High |
Volume
(% DAV)
(% 50 day avg vol) |
52 Wk Hi
% From Hi |
Featured
Date |
Price
Featured |
Pivot Featured |
|
Max Buy |
ACN
-
NYSE
Accenture Plc
DIVERSIFIED SERVICES - Business/Management Services
|
$58.93
|
+0.12
0.20% |
$60.07
|
5,148,975
143.24% of 50 DAV
50 DAV is 3,594,700
|
$65.89
-10.56%
|
3/23/2012
|
$64.13
|
PP = $63.76
|
|
MB = $66.95
|
 Most Recent Note - 5/15/2012 8:05:20 PM
G - Halted its slide above its 200 DMA line after triggering technical sell signals while slumping under prior highs in the $62-63 area and violating its 50 DMA line.
>>> The latest Featured Stock Update with an annotated graph appeared on 3/23/2012. Click here.
View all notes |
Alert me of new notes |
CANSLIM.net Company Profile |
SEC |
Zacks Reports |
StockTalk |
News |
Chart |
Request a new note
C
A N
S L
I M


|
ADS
-
NYSE
Alliance Data Sys Corp
COMPUTER SOFTWARE and SERVICES - Information and Delivery Service
|
$126.27
|
+0.17
0.13% |
$127.40
|
362,136
63.58% of 50 DAV
50 DAV is 569,600
|
$130.66
-3.36%
|
1/17/2012
|
$108.24
|
PP = $107.43
|
|
MB = $112.80
|
Most Recent Note - 5/15/2012 8:34:03 PM
G - Holding its ground near its 50 DMA line. The recent low ($122.70 on 5/09/12) defines important support where a violation would complete a bearish head-and-shoulders pattern and trigger a worrisome technical sell signal. Sub par earnings increases in the 2 latest quarterly reports (Dec '11 and Mar '12) raised fundamental concerns.
>>> The latest Featured Stock Update with an annotated graph appeared on 4/24/2012. Click here.
View all notes |
Alert me of new notes |
CANSLIM.net Company Profile |
SEC |
Zacks Reports |
StockTalk |
News |
Chart |
Request a new note
C
A N
S L
I M
|
ALLT
-
NASDAQ
Allot Communications Ltd
COMPUTER SOFTWARE andamp; SERVICES - Technical andamp; System Software
|
$23.40
|
-0.08
-0.34% |
$23.66
|
341,848
67.59% of 50 DAV
50 DAV is 505,800
|
$26.97
-13.24%
|
3/13/2012
|
$19.72
|
PP = $18.91
|
|
MB = $19.86
|
Most Recent Note - 5/11/2012 4:06:20 PM
G - Posted a gain with light volume and stayed above its 50 DMA line today after 3 losses with above average volume in the prior 4 sessions. It is extended from its prior base. The recent low ($22.46 on 4/23/12) define near-term support that coincides with its 50 DMA line.
>>> The latest Featured Stock Update with an annotated graph appeared on 3/19/2012. Click here.
View all notes |
Alert me of new notes |
CANSLIM.net Company Profile |
SEC |
Zacks Reports |
StockTalk |
News |
Chart |
Request a new note
C
A N
S L
I M
|
ALXN
-
NASDAQ
Alexion Pharmaceuticals
DRUGS - Drug Manufacturers - Other
|
$86.73
|
+0.71
0.83% |
$87.67
|
1,075,858
87.70% of 50 DAV
50 DAV is 1,226,700
|
$95.01
-8.71%
|
5/1/2012
|
$91.73
|
PP = $95.11
|
|
MB = $99.87
|
Most Recent Note - 5/15/2012 8:08:19 PM
G - Outlook remains questionable until it rebounds above its 50 DMA line. Meanwhile it is consolidating well above its 200 DMA line that defines the next important chart support level .
>>> The latest Featured Stock Update with an annotated graph appeared on 4/16/2012. Click here.
View all notes |
Alert me of new notes |
CANSLIM.net Company Profile |
SEC |
Zacks Reports |
StockTalk |
News |
Chart |
Request a new note
C
A N
S L
I M
|
ARBA
-
NASDAQ
Ariba Inc
INTERNET - Internet Software and Services
|
$37.92
|
-0.33
-0.86% |
$38.62
|
739,204
74.58% of 50 DAV
50 DAV is 991,200
|
$40.45
-6.25%
|
4/27/2012
|
$38.53
|
PP = $37.24
|
|
MB = $39.10
|
Most Recent Note - 5/11/2012 1:22:25 PM
G - Trading above its "max buy" level today. Held its ground stubbornly since its technical breakout on 5 times average volume when highlighted in yellow in the 4/27/12 mid-day breakouts report (read here). Support to watch is at prior highs in the $35-37 area.
>>> The latest Featured Stock Update with an annotated graph appeared on 4/30/2012. Click here.
View all notes |
Alert me of new notes |
CANSLIM.net Company Profile |
SEC |
Zacks Reports |
StockTalk |
News |
Chart |
Request a new note
C
A N
S L
I M
|
Symbol/Exchange
Company Name
Industry Group |
PRICE |
CHANGE
(%Change) |
Day High |
Volume
(% DAV)
(% 50 day avg vol) |
52 Wk Hi
% From Hi |
Featured
Date |
Price
Featured |
Pivot Featured |
|
Max Buy |
CDNS
-
NASDAQ
Cadence Design Systems
COMPUTER SOFTWARE and SERVICES - Technical and System Software
|
$10.79
|
-0.01
-0.09% |
$11.01
|
2,008,057
74.91% of 50 DAV
50 DAV is 2,680,700
|
$12.60
-14.37%
|
2/3/2012
|
$11.66
|
PP = $11.15
|
|
MB = $11.71
|
Most Recent Note - 5/15/2012 8:36:36 PM
Consolidating above its 200 DMA line, failing to rebound after its 50 DMA line acted as resistance. It will be dropped from the Featured Stocks list based on weak technical action.
>>> The latest Featured Stock Update with an annotated graph appeared on 3/28/2012. Click here.
View all notes |
Alert me of new notes |
CANSLIM.net Company Profile |
SEC |
Zacks Reports |
StockTalk |
News |
Chart |
Request a new note
C
A N
S L
I M
|
CERN
-
NASDAQ
Cerner Corp
COMPUTER SOFTWARE and SERVICES - Healthcare Information Service
|
$79.95
|
+0.72
0.91% |
$81.75
|
1,379,378
119.98% of 50 DAV
50 DAV is 1,149,700
|
$84.10
-4.93%
|
4/27/2012
|
$77.23
|
PP = $78.63
|
|
MB = $82.56
|
Most Recent Note - 5/15/2012 8:40:27 PM
Y - Color code is changed to yellow while holding its ground above its pivot point and staying near its all-time high after testing near prior chart highs that acted as support. Market weakness (M criteria) is an overriding concern that argues against new buying efforts until a new confirmed rally with a follow-through day by at least one of the major averages.
>>> The latest Featured Stock Update with an annotated graph appeared on 5/1/2012. Click here.
View all notes |
Alert me of new notes |
CANSLIM.net Company Profile |
SEC |
Zacks Reports |
StockTalk |
News |
Chart |
Request a new note
C
A N
S L
I M
|
CMCSA
-
NASDAQ
Comcast Corp Cl A
MEDIA - CATV Systems
|
$28.85
|
-0.04
-0.14% |
$29.33
|
11,380,854
89.83% of 50 DAV
50 DAV is 12,669,600
|
$30.88
-6.56%
|
5/2/2012
|
$30.04
|
PP = $30.51
|
|
MB = $32.04
|
Most Recent Note - 5/15/2012 8:11:13 PM
G - Color code is changed to green after slumping under its 50 DMA line and negating its recent breakout. Prior low ($28.54 on 4/10/12) defines the next important chart support level to watch where a violation may trigger a more worrisome technical sell signal.
>>> The latest Featured Stock Update with an annotated graph appeared on 5/7/2012. Click here.
View all notes |
Alert me of new notes |
CANSLIM.net Company Profile |
SEC |
Zacks Reports |
StockTalk |
News |
Chart |
Request a new note
C
A N
S L
I M
|
COO
-
NYSE
Cooper Companies Inc
HEALTH SERVICES - Medical Instruments and Supplies
|
$86.90
|
-0.52
-0.59% |
$88.02
|
204,793
46.08% of 50 DAV
50 DAV is 444,400
|
$89.31
-2.70%
|
3/9/2012
|
$83.05
|
PP = $81.02
|
|
MB = $85.07
|
Most Recent Note - 5/10/2012 11:16:41 AM
G - Volume totals have been light this week while consolidating near its 52-week and all-time highs and staying above its "max buy" level. It is extended from its prior base. Prior highs in the $83-84 area define near-term support above its 50 DMA line.
>>> The latest Featured Stock Update with an annotated graph appeared on 3/9/2012. Click here.
View all notes |
Alert me of new notes |
CANSLIM.net Company Profile |
SEC |
Zacks Reports |
StockTalk |
News |
Chart |
Request a new note
C
A N
S L
I M
|
DG
-
NYSE
Dollar General Corp
RETAIL - Discount, Variety Stores
|
$47.00
|
+0.18
0.38% |
$47.38
|
1,401,541
55.15% of 50 DAV
50 DAV is 2,541,200
|
$48.76
-3.61%
|
5/7/2012
|
$48.51
|
PP = $47.69
|
|
MB = $50.07
|
Most Recent Note - 5/15/2012 8:42:32 PM
Y - Stubbornly holding its ground near its 52-week high and pivot point. It has encountered some distributional pressure while market conditions (M criteria) turned for the worse.
>>> The latest Featured Stock Update with an annotated graph appeared on 5/9/2012. Click here.
View all notes |
Alert me of new notes |
CANSLIM.net Company Profile |
SEC |
Zacks Reports |
StockTalk |
News |
Chart |
Request a new note
C
A N
S L
I M
|
Symbol/Exchange
Company Name
Industry Group |
PRICE |
CHANGE
(%Change) |
Day High |
Volume
(% DAV)
(% 50 day avg vol) |
52 Wk Hi
% From Hi |
Featured
Date |
Price
Featured |
Pivot Featured |
|
Max Buy |
DISH
-
NASDAQ
Dish Network Corp Cl A
CONSUMER DURABLES - Electronic Equipment
|
$30.17
|
-0.42
-1.37% |
$30.85
|
1,217,001
52.14% of 50 DAV
50 DAV is 2,334,300
|
$35.64
-15.35%
|
3/7/2012
|
$30.83
|
PP = $30.10
|
|
MB = $31.61
|
Most Recent Note - 5/15/2012 8:44:35 PM
Failing to rebound above its 50 DMA line after a violation raising concerns and triggering a technical sell signal. Reported earnings -34% on +11% sales revenues for the quarter ended March 31, 2012, below the guideline for the C criteria which calls for earnings +25% or more. Based on weak technical action and weaker earnings it will be dropped from the Featured Stocks list tonight.
>>> The latest Featured Stock Update with an annotated graph appeared on 3/14/2012. Click here.
View all notes |
Alert me of new notes |
CANSLIM.net Company Profile |
SEC |
Zacks Reports |
StockTalk |
News |
Chart |
Request a new note
C
A N
S L
I M
|
EXPE
-
NASDAQ
Expedia Inc
INTERNET - Internet Information Providers
|
$41.68
|
+0.28
0.68% |
$42.32
|
4,019,021
91.95% of 50 DAV
50 DAV is 4,370,800
|
$43.92
-5.10%
|
4/27/2012
|
$41.80
|
PP = $35.57
|
|
MB = $37.35
|
Most Recent Note - 5/10/2012 11:06:58 AM
G - Volume totals have been cooling while consolidating in a tight range this week. Quickly got extended from its prior base following its appearance highlighted in yellow in the 4/27/12 mid-day breakouts report (read here) after a considerable "breakaway gap" up.
>>> The latest Featured Stock Update with an annotated graph appeared on 5/3/2012. Click here.
View all notes |
Alert me of new notes |
CANSLIM.net Company Profile |
SEC |
Zacks Reports |
StockTalk |
News |
Chart |
Request a new note
C
A N
S L
I M
|
FEIC
-
NASDAQ
F E I Co
ELECTRONICS - Diversified Electronics
|
$46.02
|
+0.46
1.01% |
$46.52
|
292,146
92.13% of 50 DAV
50 DAV is 317,100
|
$52.01
-11.52%
|
12/7/2011
|
$41.41
|
PP = $42.35
|
|
MB = $44.47
|
Most Recent Note - 5/15/2012 8:14:54 PM
Its outlook get worse the longer it lingers below its 50 DMA line following its recent violation which triggered a technical sell signal. Based on weak action and deteriorating fundamentals it will be dropped from the Featured Stocks list tonight. Reported earnings +17% on +10% sales revenues for the quarter ended March 31, 2012 versus the year ago period. Concerns were raised by its 2 consecutive quarters below the +25% minimum guideline for earnings growth.
>>> The latest Featured Stock Update with an annotated graph appeared on 3/12/2012. Click here.
View all notes |
Alert me of new notes |
CANSLIM.net Company Profile |
SEC |
Zacks Reports |
StockTalk |
News |
Chart |
Request a new note
C
A N
S L
I M
|
GNC
-
NYSE
G N C Holdings Inc
RETAIL - Drug Stores
|
$38.99
|
+0.38
0.98% |
$39.14
|
1,230,854
59.33% of 50 DAV
50 DAV is 2,074,700
|
$41.95
-7.06%
|
1/19/2012
|
$28.99
|
PP = $29.60
|
|
MB = $31.08
|
Most Recent Note - 5/14/2012 5:48:58 PM
G - Down today on higher volume, finishing -8.0% off its all-time high today. Support to watch is at prior highs near $36 above its 50 DMA line. Reported earnings +82% on +23% sales revenues for the quarter ended March 31, 2012 versus the year ago period.
>>> The latest Featured Stock Update with an annotated graph appeared on 4/26/2012. Click here.
View all notes |
Alert me of new notes |
CANSLIM.net Company Profile |
SEC |
Zacks Reports |
StockTalk |
News |
Chart |
Request a new note
C
A N
S L
I M
|
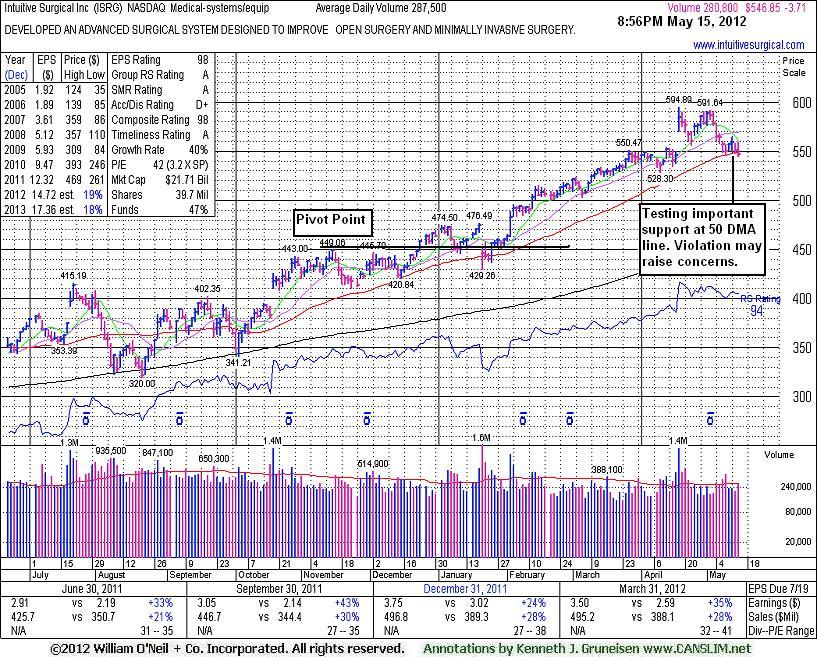
ISRG
-
NASDAQ
Intuitive Surgical Inc
HEALTH SERVICES - Medical Appliances and Equipment
|
$546.85
|
-3.71
-0.67% |
$558.89
|
285,401
99.27% of 50 DAV
50 DAV is 287,500
|
$594.89
-8.08%
|
12/20/2011
|
$442.43
|
PP = $449.16
|
|
MB = $471.62
|
Most Recent Note - 5/15/2012 9:08:35 PM
G - Consolidating near its 50 DMA line that defines important support. See the latest FSU analysis for more details and a new annotated graph.
>>> The latest Featured Stock Update with an annotated graph appeared on 5/15/2012. Click here.
View all notes |
Alert me of new notes |
CANSLIM.net Company Profile |
SEC |
Zacks Reports |
StockTalk |
News |
Chart |
Request a new note
C
A N
S L
I M
|
Symbol/Exchange
Company Name
Industry Group |
PRICE |
CHANGE
(%Change) |
Day High |
Volume
(% DAV)
(% 50 day avg vol) |
52 Wk Hi
% From Hi |
Featured
Date |
Price
Featured |
Pivot Featured |
|
Max Buy |
JAZZ
-
NASDAQ
Jazz Pharmaceuticals Plc
DRUGS - Biotechnology
|
$45.22
|
-2.65
-5.54% |
$47.81
|
1,445,659
152.74% of 50 DAV
50 DAV is 946,500
|
$54.50
-17.03%
|
4/27/2012
|
$51.93
|
PP = $51.39
|
|
MB = $53.96
|
Most Recent Note - 5/15/2012 8:18:50 PM
Down again today with higher above average volume, encountering more worrisome distributional pressure while slumping toward its 200 DMA line and finishing -17% off its 52-week high. Prior lows in the $42 area define the next important support level to watch. Based on technical weakness it will be dropped from the Featured Stocks list tonight.
>>> The latest Featured Stock Update with an annotated graph appeared on 4/27/2012. Click here.
View all notes |
Alert me of new notes |
CANSLIM.net Company Profile |
SEC |
Zacks Reports |
StockTalk |
News |
Chart |
Request a new note
C
A N
S L
I M
|
LULU
-
NASDAQ
Lululemon Athletica
MANUFACTURING - Textile Manufacturing
|
$70.65
|
-1.58
-2.19% |
$73.30
|
2,770,331
128.04% of 50 DAV
50 DAV is 2,163,600
|
$81.09
-12.87%
|
5/1/2012
|
$76.05
|
PP = $77.23
|
|
MB = $81.09
|
Most Recent Note - 5/15/2012 8:21:17 PM
G - Down today with higher volume indicative of distributional pressure. Raised concerns by violating its 50 DMA line, and now its prior low ($69.64 on 4/24/12) defines important near-term support where further deterioration would more serious concerns.
>>> The latest Featured Stock Update with an annotated graph appeared on 4/12/2012. Click here.
View all notes |
Alert me of new notes |
CANSLIM.net Company Profile |
SEC |
Zacks Reports |
StockTalk |
News |
Chart |
Request a new note
C
A N
S L
I M
|
MA
-
NYSE
Mastercard Inc Cl A
DIVERSIFIED SERVICES - Business/Management Services
|
$414.47
|
+0.03
0.01% |
$419.97
|
676,823
74.46% of 50 DAV
50 DAV is 909,000
|
$466.98
-11.24%
|
3/12/2012
|
$419.86
|
PP = $428.67
|
|
MB = $450.10
|
Most Recent Note - 5/15/2012 8:23:40 PM
G - Ended in the lower third of its intra-day range today while posting a small gain on very light volume. Last week's 50 DMA line violation raised concerns, and its subsequent deterioration below its prior low ($420.75 on 4/23/12) raised even greater concerns.
>>> The latest Featured Stock Update with an annotated graph appeared on 4/11/2012. Click here.
View all notes |
Alert me of new notes |
CANSLIM.net Company Profile |
SEC |
Zacks Reports |
StockTalk |
News |
Chart |
Request a new note
C
A N
S L
I M
|
MG
-
NYSE
Mistras Group Inc
DIVERSIFIED SERVICES - Bulding and Faci;ity Management Services
|
$23.70
|
+0.25
1.07% |
$24.00
|
87,145
88.11% of 50 DAV
50 DAV is 98,900
|
$26.24
-9.68%
|
3/22/2012
|
$24.96
|
PP = $26.34
|
|
MB = $27.66
|
Most Recent Note - 5/15/2012 8:25:15 PM
G - Consolidating in a tight trading range near its 50 DMA line for more than a month, holding its ground above its 200 DMA line. Previously noted - "A volume-driven gain above its recent chart high ($25.49 on 3/21/12) may help trigger a proper technical buy signal after a new base formation, however no new (lower) pivot point is currently being cited, and it may continue encountering stubborn resistance."
>>> The latest Featured Stock Update with an annotated graph appeared on 4/2/2012. Click here.
View all notes |
Alert me of new notes |
CANSLIM.net Company Profile |
SEC |
Zacks Reports |
StockTalk |
News |
Chart |
Request a new note
C
A N
S L
I M
|
NTES
-
NASDAQ
Netease Inc Adr
INTERNET - Internet Information Providers
|
$56.78
|
+0.52
0.92% |
$57.33
|
586,664
89.40% of 50 DAV
50 DAV is 656,200
|
$61.45
-7.60%
|
3/19/2012
|
$56.18
|
PP = $55.10
|
|
MB = $57.86
|
Most Recent Note - 5/11/2012 1:30:30 PM
G - Up today without great volume, yet rebounding above its 50 DMA line. Prior low ($55.34 on 4/10/12) defines the next important chart support to watch.
>>> The latest Featured Stock Update with an annotated graph appeared on 3/27/2012. Click here.
View all notes |
Alert me of new notes |
CANSLIM.net Company Profile |
SEC |
Zacks Reports |
StockTalk |
News |
Chart |
Request a new note
C
A N
S L
I M
|
Symbol/Exchange
Company Name
Industry Group |
PRICE |
CHANGE
(%Change) |
Day High |
Volume
(% DAV)
(% 50 day avg vol) |
52 Wk Hi
% From Hi |
Featured
Date |
Price
Featured |
Pivot Featured |
|
Max Buy |
RRTS
-
NYSE
Roadrunner Trans Systems
TRANSPORTATION - Air Delivery and Freight Service
|
$17.95
|
-0.01
-0.06% |
$18.05
|
69,765
73.13% of 50 DAV
50 DAV is 95,400
|
$19.06
-5.82%
|
5/3/2012
|
$18.20
|
PP = $18.69
|
|
MB = $19.62
|
Most Recent Note - 5/10/2012 11:25:37 AM
Y - Holding its ground this week, not making meaningful price progress following its recent streak of volume-driven gains. It encountered resistance and still needs a strong finish above the pivot point cited to clinch a proper technical buy signal.
>>> The latest Featured Stock Update with an annotated graph appeared on 4/9/2012. Click here.
View all notes |
Alert me of new notes |
CANSLIM.net Company Profile |
SEC |
Zacks Reports |
StockTalk |
News |
Chart |
Request a new note
C
A N
S L
I M
|
SHOO
-
NASDAQ
Steven Madden Limited
CONSUMER NON-DURABLES - Textile - Apparel Footwear
|
$40.51
|
+0.52
1.30% |
$40.94
|
390,948
115.97% of 50 DAV
50 DAV is 337,100
|
$45.70
-11.36%
|
4/27/2012
|
$43.20
|
PP = $45.32
|
|
MB = $47.59
|
Most Recent Note - 5/10/2012 6:17:45 PM
G - Technical deterioration below the recent low ($40.91 on 4/24/12) has raised more serious concerns after earnings growth for the quarter ended March 31, 2012 versus the year ago period was below the +25% minimum guideline. See latest FSU analysis for more details and a new annotated graph.
>>> The latest Featured Stock Update with an annotated graph appeared on 5/10/2012. Click here.
View all notes |
Alert me of new notes |
CANSLIM.net Company Profile |
SEC |
Zacks Reports |
StockTalk |
News |
Chart |
Request a new note
C
A N
S L
I M
|
SWI
-
NYSE
Solarwinds Inc
COMPUTER SOFTWARE and SERVICES - Application Software
|
$44.92
|
+0.88
2.00% |
$46.23
|
819,751
73.13% of 50 DAV
50 DAV is 1,120,900
|
$47.66
-5.75%
|
4/26/2012
|
$45.15
|
PP = $42.32
|
|
MB = $44.44
|
Most Recent Note - 5/15/2012 12:45:23 PM
G - Rallying well above its "max buy" level with today's gain. It triggered a technical buy signal on 4/26/12 as it was featured in the mid-day report and noted - "Reported earnings +43% on +39% sales revenues for the quarter ended March 31, 2012 versus the year ago period. It held its ground stubbornly after violating its 50 DMA line when a damaging loss with above average volume triggered technical sell signals on 4/10/12 and it was dropped from the Featured Stocks list. Earnings below the +25% guideline for the Dec '11 quarter (+21%) had also raised fundamental concerns at that time, however the stock's resilience and impressive acceleration means that 3 of the past 4 quarterly comparisons are now above the minimum guideline concerning the C criteria. Its annual earnings (A criteria) history has been strong."
>>> The latest Featured Stock Update with an annotated graph appeared on 3/16/2012. Click here.
View all notes |
Alert me of new notes |
CANSLIM.net Company Profile |
SEC |
Zacks Reports |
StockTalk |
News |
Chart |
Request a new note
C
A N
S L
I M
|
SXCI
-
NASDAQ
S X C Health Solutions
COMPUTER SOFTWARE and SERVICES - Healthcare Information Service
|
$91.13
|
-0.32
-0.35% |
$92.59
|
674,478
64.69% of 50 DAV
50 DAV is 1,042,600
|
$100.50
-9.32%
|
2/23/2012
|
$68.24
|
PP = $66.05
|
|
MB = $69.35
|
Most Recent Note - 5/11/2012 4:00:28 PM
G - Up today with heavier volume after pricing a new Public Offering. Consolidating in a tight range since it posted huge volume-driven gains on 4/18 and 4/19 while rallying on M&A news.
>>> The latest Featured Stock Update with an annotated graph appeared on 3/6/2012. Click here.
View all notes |
Alert me of new notes |
CANSLIM.net Company Profile |
SEC |
Zacks Reports |
StockTalk |
News |
Chart |
Request a new note
C
A N
S L
I M
|
TDC
-
NYSE
Teradata Corp
COMPUTER SOFTWARE and SERVICES - Technical and; System Software
|
$69.61
|
+0.01
0.01% |
$70.57
|
2,241,784
144.34% of 50 DAV
50 DAV is 1,553,100
|
$79.89
-12.87%
|
5/3/2012
|
$79.06
|
PP = $70.73
|
|
MB = $74.27
|
Most Recent Note - 5/11/2012 4:08:44 PM
Y - After encountering distributional pressure this week it is still holding its ground still above its pivot point. Its 50 DMA line defines additional near-term support to watch.
>>> The latest Featured Stock Update with an annotated graph appeared on 5/8/2012. Click here.
View all notes |
Alert me of new notes |
CANSLIM.net Company Profile |
SEC |
Zacks Reports |
StockTalk |
News |
Chart |
Request a new note
C
A N
S L
I M
|
Symbol/Exchange
Company Name
Industry Group |
PRICE |
CHANGE
(%Change) |
Day High |
Volume
(% DAV)
(% 50 day avg vol) |
52 Wk Hi
% From Hi |
Featured
Date |
Price
Featured |
Pivot Featured |
|
Max Buy |
TDG
-
NYSE
Transdigm Group Inc
AEROSPACE/DEFENSE - Aerospace/Defense Products and; Services
|
$123.65
|
-1.28
-1.02% |
$125.21
|
420,406
91.47% of 50 DAV
50 DAV is 459,600
|
$132.69
-6.81%
|
2/29/2012
|
$120.10
|
PP = $118.93
|
|
MB = $124.88
|
Most Recent Note - 5/15/2012 8:29:39 PM
G - Consolidating since hitting a new all-time high with a volume-driven gain on 5/08/12. It has quietly pulled back below its "max buy" level, however poor market conditions (M criteria) argue against making any new buying efforts until a new confirmed rally by at least one of the major averages with a solid follow-through day. Prior highs in the $118-121 area define chart support to watch on pullbacks.
>>> The latest Featured Stock Update with an annotated graph appeared on 3/30/2012. Click here.
View all notes |
Alert me of new notes |
CANSLIM.net Company Profile |
SEC |
Zacks Reports |
StockTalk |
News |
Chart |
Request a new note
C
A N
S L
I M
|
TNGO
-
NASDAQ
Tangoe Inc
COMPUTER SOFTWARE and SERVICES - Technical and System Software
|
$21.81
|
-0.24
-1.09% |
$22.51
|
313,491
49.74% of 50 DAV
50 DAV is 630,200
|
$23.05
-5.38%
|
3/27/2012
|
$19.35
|
PP = $20.00
|
|
MB = $21.00
|
Most Recent Note - 5/11/2012 4:03:58 PM
G - It found impressive support at its 50 DMA line and now it is extended from its prior base. Up today with light volume while rallying further above its "max buy" level for a best-ever close.
>>> The latest Featured Stock Update with an annotated graph appeared on 4/3/2012. Click here.
View all notes |
Alert me of new notes |
CANSLIM.net Company Profile |
SEC |
Zacks Reports |
StockTalk |
News |
Chart |
Request a new note
C
A N
S L
I M
|
TSCO
-
NASDAQ
Tractor Supply Co
SPECIALTY RETAIL - Specialty Retail, Other
|
$97.18
|
-0.97
-0.99% |
$98.83
|
871,149
106.88% of 50 DAV
50 DAV is 815,100
|
$101.20
-3.97%
|
5/1/2012
|
$98.38
|
PP = $101.30
|
|
MB = $106.37
|
Most Recent Note - 5/15/2012 8:31:01 PM
Y - Still consolidating above its 50 DMA line which recently acted as support. Volume-driven gains to new highs didn't trigger a new (or add-on) technical buy signal in recent weeks.
>>> The latest Featured Stock Update with an annotated graph appeared on 4/17/2012. Click here.
View all notes |
Alert me of new notes |
CANSLIM.net Company Profile |
SEC |
Zacks Reports |
StockTalk |
News |
Chart |
Request a new note
C
A N
S L
I M
|
UA
-
NYSE
Under Armour Inc Cl A
CONSUMER NON-DURABLES - Textile - Apparel Clothing
|
$94.60
|
+0.54
0.57% |
$95.93
|
990,597
105.13% of 50 DAV
50 DAV is 942,300
|
$102.86
-8.03%
|
2/15/2012
|
$85.77
|
PP = $84.86
|
|
MB = $89.10
|
Most Recent Note - 5/15/2012 8:48:15 PM
G - The longer it lingers below its 50 DMA line the worse its outlook gets. That short-term average has acted as resistance following the violation on 5/08/12 which triggered technical sell signals. Concerns were raised by weaker fundamentals. Reported earnings +22% on +23% sales revenues for the quarter ended March 31, 2012 versus the year ago period, its first quarterly earnings increase below the +25% minimum guideline in more than 2 years.
>>> The latest Featured Stock Update with an annotated graph appeared on 4/4/2012. Click here.
View all notes |
Alert me of new notes |
CANSLIM.net Company Profile |
SEC |
Zacks Reports |
StockTalk |
News |
Chart |
Request a new note
C
A N
S L
I M
|
V
-
NYSE
Visa Inc Cl A
DIVERSIFIED SERVICES - Business/Management Services
|
$116.61
|
-0.11
-0.09% |
$117.90
|
3,147,367
93.20% of 50 DAV
50 DAV is 3,377,000
|
$125.35
-6.97%
|
3/12/2012
|
$116.53
|
PP = $119.46
|
|
MB = $125.43
|
Most Recent Note - 5/10/2012 11:28:36 AM
G - Consolidating just under its 50 DMA line which has acted as a resistance level after the technical violation on 5/03/12. Color code is changed to green. A rebound above its 50 DMA line is needed for its technical stance and outlook to improve.
>>> The latest Featured Stock Update with an annotated graph appeared on 3/7/2012. Click here.
View all notes |
Alert me of new notes |
CANSLIM.net Company Profile |
SEC |
Zacks Reports |
StockTalk |
News |
Chart |
Request a new note
C
A N
S L
I M
|
Symbol/Exchange
Company Name
Industry Group |
PRICE |
CHANGE
(%Change) |
Day High |
Volume
(% DAV)
(% 50 day avg vol) |
52 Wk Hi
% From Hi |
Featured
Date |
Price
Featured |
Pivot Featured |
|
Max Buy |
VSI
-
NYSE
Vitamin Shoppe Inc
SPECIALTY RETAIL - Specialty Retail, Other
|
$52.88
|
-0.91
-1.69% |
$54.00
|
719,710
161.12% of 50 DAV
50 DAV is 446,700
|
$55.29
-4.36%
|
4/25/2012
|
$47.77
|
PP = $48.46
|
|
MB = $50.88
|
Most Recent Note - 5/15/2012 12:31:41 PM
G -Hovering near its 52-week high today. Volume totals have been cooling while holding its ground following considerable volume-driven gains last week bucking a broadly negative market. It is extended from its prior base.
>>> The latest Featured Stock Update with an annotated graph appeared on 4/25/2012. Click here.
View all notes |
Alert me of new notes |
CANSLIM.net Company Profile |
SEC |
Zacks Reports |
StockTalk |
News |
Chart |
Request a new note
C
A N
S L
I M
|
WFM
-
NASDAQ
Whole Foods Market Inc
RETAIL - Grocery Stores
|
$87.23
|
-0.22
-0.25% |
$88.66
|
1,502,183
97.61% of 50 DAV
50 DAV is 1,538,900
|
$91.50
-4.67%
|
5/3/2012
|
$90.28
|
PP = $86.45
|
|
MB = $90.77
|
Most Recent Note - 5/11/2012 7:07:48 PM
Y - Consolidating above prior highs since its considerable "breakaway gap" on 5/03/12 that cleared an orderly flat base pattern. The is no resistance remaining due to overhead supply. See the latest FSU analysis for more details and a new annotated graph.
>>> The latest Featured Stock Update with an annotated graph appeared on 5/11/2012. Click here.
View all notes |
Alert me of new notes |
CANSLIM.net Company Profile |
SEC |
Zacks Reports |
StockTalk |
News |
Chart |
Request a new note
C
A N
S L
I M
|