***Last / Change / Volume data in this table is the closing quote data***
Symbol/Exchange
Company Name
Industry Group |
PRICE |
CHANGE
(%Change) |
Day High |
Volume
(% DAV)
(% 50 day avg vol) |
52 Wk Hi
% From Hi |
Featured
Date |
Price
Featured |
Pivot Featured |
|
Max Buy |
ACN
-
NYSE
Accenture Plc
DIVERSIFIED SERVICES - Business/Management Services
|
$58.81
|
+0.20
0.34% |
$59.17
|
4,031,759
113.18% of 50 DAV
50 DAV is 3,562,100
|
$65.89
-10.75%
|
3/23/2012
|
$64.13
|
PP = $63.76
|
|
MB = $66.95
|
Most Recent Note - 5/7/2012 1:23:00 PM
G - Triggering a worrisome technical sell signal as it gapped down today, sinking under prior highs in the $62-63 area. A weak finish on the prior session led to a close just below its 50 DMA line. Its color code is changed to green.
>>> The latest Featured Stock Update with an annotated graph appeared on 3/23/2012. Click here.
View all notes |
Alert me of new notes |
CANSLIM.net Company Profile |
SEC |
Zacks Reports |
StockTalk |
News |
Chart |
Request a new note
C
A N
S L
I M


|
ADS
-
NYSE
Alliance Data Sys Corp
COMPUTER SOFTWARE and SERVICES - Information and Delivery Service
|
$126.10
|
-1.10
-0.86% |
$126.59
|
644,698
113.60% of 50 DAV
50 DAV is 567,500
|
$130.66
-3.49%
|
1/17/2012
|
$108.24
|
PP = $107.43
|
|
MB = $112.80
|
Most Recent Note - 5/8/2012 6:24:55 PM
G - Finished near the session high and just below its 50 DMA line after today's 4th consecutive loss with below average volume. Sub par earnings increases in the 2 latest quarterly reports (Dec '11 and Mar '12) raised fundamental concerns. Its prior low ($122.78 on 4/10/12) defines the next important support to watch where any violation would trigger a more worrisome technical sell signal.
>>> The latest Featured Stock Update with an annotated graph appeared on 4/24/2012. Click here.
View all notes |
Alert me of new notes |
CANSLIM.net Company Profile |
SEC |
Zacks Reports |
StockTalk |
News |
Chart |
Request a new note
C
A N
S L
I M
|
ALLT
-
NASDAQ
Allot Communications Ltd
COMPUTER SOFTWARE andamp; SERVICES - Technical andamp; System Software
|
$23.48
|
-0.06
-0.25% |
$24.00
|
344,379
68.38% of 50 DAV
50 DAV is 503,600
|
$26.97
-12.94%
|
3/13/2012
|
$19.72
|
PP = $18.91
|
|
MB = $19.86
|
Most Recent Note - 5/11/2012 4:06:20 PM
G - Posted a gain with light volume and stayed above its 50 DMA line today after 3 losses with above average volume in the prior 4 sessions. It is extended from its prior base. The recent low ($22.46 on 4/23/12) define near-term support that coincides with its 50 DMA line.
>>> The latest Featured Stock Update with an annotated graph appeared on 3/19/2012. Click here.
View all notes |
Alert me of new notes |
CANSLIM.net Company Profile |
SEC |
Zacks Reports |
StockTalk |
News |
Chart |
Request a new note
C
A N
S L
I M
|
ALXN
-
NASDAQ
Alexion Pharmaceuticals
DRUGS - Drug Manufacturers - Other
|
$86.02
|
-0.27
-0.31% |
$86.39
|
895,851
72.60% of 50 DAV
50 DAV is 1,233,900
|
$95.01
-9.46%
|
5/1/2012
|
$91.73
|
PP = $95.11
|
|
MB = $99.87
|
Most Recent Note - 5/7/2012 9:52:21 AM
G - Gapped down today after violating its 50 DMA line on the prior session and finishing near the session low. Did not trade above the new pivot point cited based on its 3/26/12 high plus 10 cents after building an orderly flat base. Previously noted - "The late-stage base may be a riskier set-up, yet volume-driven gains could trigger a new (or add-on) technical buy signal."
>>> The latest Featured Stock Update with an annotated graph appeared on 4/16/2012. Click here.
View all notes |
Alert me of new notes |
CANSLIM.net Company Profile |
SEC |
Zacks Reports |
StockTalk |
News |
Chart |
Request a new note
C
A N
S L
I M
|
ARBA
-
NASDAQ
Ariba Inc
INTERNET - Internet Software and Services
|
$38.25
|
-0.92
-2.35% |
$38.75
|
747,145
74.96% of 50 DAV
50 DAV is 996,700
|
$40.45
-5.44%
|
4/27/2012
|
$38.53
|
PP = $37.24
|
|
MB = $39.10
|
Most Recent Note - 5/11/2012 1:22:25 PM
G - Trading above its "max buy" level today. Held its ground stubbornly since its technical breakout on 5 times average volume when highlighted in yellow in the 4/27/12 mid-day breakouts report (read here). Support to watch is at prior highs in the $35-37 area.
>>> The latest Featured Stock Update with an annotated graph appeared on 4/30/2012. Click here.
View all notes |
Alert me of new notes |
CANSLIM.net Company Profile |
SEC |
Zacks Reports |
StockTalk |
News |
Chart |
Request a new note
C
A N
S L
I M
|
Symbol/Exchange
Company Name
Industry Group |
PRICE |
CHANGE
(%Change) |
Day High |
Volume
(% DAV)
(% 50 day avg vol) |
52 Wk Hi
% From Hi |
Featured
Date |
Price
Featured |
Pivot Featured |
|
Max Buy |
CDNS
-
NASDAQ
Cadence Design Systems
COMPUTER SOFTWARE and SERVICES - Technical and System Software
|
$10.80
|
-0.11
-1.01% |
$10.90
|
1,726,875
64.08% of 50 DAV
50 DAV is 2,694,700
|
$12.60
-14.29%
|
2/3/2012
|
$11.66
|
PP = $11.15
|
|
MB = $11.71
|
Most Recent Note - 5/8/2012 6:33:21 PM
G - Finished at the session high today after slumping near its 200 DMA line then rebounding for a small gain after a positive reversal. A rebound above its 50 DMA line is needed for its technical stance and outlook to improve.
>>> The latest Featured Stock Update with an annotated graph appeared on 3/28/2012. Click here.
View all notes |
Alert me of new notes |
CANSLIM.net Company Profile |
SEC |
Zacks Reports |
StockTalk |
News |
Chart |
Request a new note
C
A N
S L
I M
|
CERN
-
NASDAQ
Cerner Corp
COMPUTER SOFTWARE and SERVICES - Healthcare Information Service
|
$79.23
|
-0.69
-0.86% |
$79.95
|
705,530
61.01% of 50 DAV
50 DAV is 1,156,400
|
$84.10
-5.79%
|
4/27/2012
|
$77.23
|
PP = $78.63
|
|
MB = $82.56
|
Most Recent Note - 5/9/2012 12:09:26 PM
G - Gapped down today amid widespread market weakness. Its early loss again tested near prior chart highs that now define a support level.
>>> The latest Featured Stock Update with an annotated graph appeared on 5/1/2012. Click here.
View all notes |
Alert me of new notes |
CANSLIM.net Company Profile |
SEC |
Zacks Reports |
StockTalk |
News |
Chart |
Request a new note
C
A N
S L
I M
|
CMCSA
-
NASDAQ
Comcast Corp Cl A
MEDIA - CATV Systems
|
$28.89
|
-0.49
-1.67% |
$29.33
|
14,271,140
113.20% of 50 DAV
50 DAV is 12,606,800
|
$30.88
-6.43%
|
5/2/2012
|
$30.04
|
PP = $30.51
|
|
MB = $32.04
|
Most Recent Note - 5/7/2012 6:26:56 PM
Y - Hovering near its 50 DMA line. Encountered distributional pressure after its 5/01/12 volume-driven gain triggered a technical buy signal while capping a streak of 6 consecutive gains to a new 52-week high and trading above its 2007 high. See the latest FSU analysis for more details and a new annotated graph.
>>> The latest Featured Stock Update with an annotated graph appeared on 5/7/2012. Click here.
View all notes |
Alert me of new notes |
CANSLIM.net Company Profile |
SEC |
Zacks Reports |
StockTalk |
News |
Chart |
Request a new note
C
A N
S L
I M
|
COO
-
NYSE
Cooper Companies Inc
HEALTH SERVICES - Medical Instruments and Supplies
|
$87.42
|
-0.75
-0.85% |
$88.19
|
162,670
36.35% of 50 DAV
50 DAV is 447,500
|
$89.31
-2.12%
|
3/9/2012
|
$83.05
|
PP = $81.02
|
|
MB = $85.07
|
Most Recent Note - 5/10/2012 11:16:41 AM
G - Volume totals have been light this week while consolidating near its 52-week and all-time highs and staying above its "max buy" level. It is extended from its prior base. Prior highs in the $83-84 area define near-term support above its 50 DMA line.
>>> The latest Featured Stock Update with an annotated graph appeared on 3/9/2012. Click here.
View all notes |
Alert me of new notes |
CANSLIM.net Company Profile |
SEC |
Zacks Reports |
StockTalk |
News |
Chart |
Request a new note
C
A N
S L
I M
|
DG
-
NYSE
Dollar General Corp
RETAIL - Discount, Variety Stores
|
$46.82
|
-0.35
-0.74% |
$47.61
|
1,953,457
76.98% of 50 DAV
50 DAV is 2,537,700
|
$48.76
-3.98%
|
5/7/2012
|
$48.51
|
PP = $47.69
|
|
MB = $50.07
|
Most Recent Note - 5/9/2012 5:25:33 PM
Y - Technically, volume-driven gains helped it recently rally from a 5-week flat base, however it has encountered some distributional pressure while market conditions (M criteria) turned for the worse. See the latest FSU analysis for more details and a new annotated graph.
>>> The latest Featured Stock Update with an annotated graph appeared on 5/9/2012. Click here.
View all notes |
Alert me of new notes |
CANSLIM.net Company Profile |
SEC |
Zacks Reports |
StockTalk |
News |
Chart |
Request a new note
C
A N
S L
I M
|
Symbol/Exchange
Company Name
Industry Group |
PRICE |
CHANGE
(%Change) |
Day High |
Volume
(% DAV)
(% 50 day avg vol) |
52 Wk Hi
% From Hi |
Featured
Date |
Price
Featured |
Pivot Featured |
|
Max Buy |
DISH
-
NASDAQ
Dish Network Corp Cl A
CONSUMER DURABLES - Electronic Equipment
|
$30.59
|
-0.24
-0.78% |
$30.97
|
1,626,941
68.04% of 50 DAV
50 DAV is 2,391,100
|
$35.64
-14.17%
|
3/7/2012
|
$30.83
|
PP = $30.10
|
|
MB = $31.61
|
Most Recent Note - 5/10/2012 11:21:37 AM
G - Reported earnings -34% on +11% sales revenues for the quarter ended March 31, 2012, below the guideline for the C criteria which calls for earnings +25% or more. It has slumped under its 50 DMA line raising concerns and triggering a technical sell signal.
>>> The latest Featured Stock Update with an annotated graph appeared on 3/14/2012. Click here.
View all notes |
Alert me of new notes |
CANSLIM.net Company Profile |
SEC |
Zacks Reports |
StockTalk |
News |
Chart |
Request a new note
C
A N
S L
I M
|
EXPE
-
NASDAQ
Expedia Inc
INTERNET - Internet Information Providers
|
$41.40
|
+0.29
0.71% |
$42.07
|
3,611,650
83.04% of 50 DAV
50 DAV is 4,349,400
|
$43.92
-5.74%
|
4/27/2012
|
$41.80
|
PP = $35.57
|
|
MB = $37.35
|
Most Recent Note - 5/10/2012 11:06:58 AM
G - Volume totals have been cooling while consolidating in a tight range this week. Quickly got extended from its prior base following its appearance highlighted in yellow in the 4/27/12 mid-day breakouts report (read here) after a considerable "breakaway gap" up.
>>> The latest Featured Stock Update with an annotated graph appeared on 5/3/2012. Click here.
View all notes |
Alert me of new notes |
CANSLIM.net Company Profile |
SEC |
Zacks Reports |
StockTalk |
News |
Chart |
Request a new note
C
A N
S L
I M
|
FEIC
-
NASDAQ
F E I Co
ELECTRONICS - Diversified Electronics
|
$45.56
|
-0.51
-1.11% |
$45.81
|
241,617
75.55% of 50 DAV
50 DAV is 319,800
|
$52.01
-12.40%
|
12/7/2011
|
$41.41
|
PP = $42.35
|
|
MB = $44.47
|
Most Recent Note - 5/7/2012 4:46:17 PM
G - Sank to its 50 DMA line today with a 3rd consecutive loss on near average volume since its "positive reversal" on 5/02/12 after reporting earnings +17% on +10% sales revenues for the quarter ended March 31, 2012 versus the year ago period. Disciplined investors make sell decisions based upon technical action alone, whereas buy decisions are to be made only when both fundamental and technical criteria met. Concerns were raised by its 2 consecutive quarters below the +25% minimum guideline for earnings growth.
>>> The latest Featured Stock Update with an annotated graph appeared on 3/12/2012. Click here.
View all notes |
Alert me of new notes |
CANSLIM.net Company Profile |
SEC |
Zacks Reports |
StockTalk |
News |
Chart |
Request a new note
C
A N
S L
I M
|
GNC
-
NYSE
G N C Holdings Inc
RETAIL - Drug Stores
|
$38.61
|
-1.87
-4.62% |
$40.61
|
2,166,574
105.41% of 50 DAV
50 DAV is 2,055,300
|
$41.95
-7.96%
|
1/19/2012
|
$28.99
|
PP = $29.60
|
|
MB = $31.08
|
 Most Recent Note - 5/14/2012 5:48:58 PM
G - Down today on higher volume, finishing -8.0% off its all-time high today. Support to watch is at prior highs near $36 above its 50 DMA line. Reported earnings +82% on +23% sales revenues for the quarter ended March 31, 2012 versus the year ago period.
>>> The latest Featured Stock Update with an annotated graph appeared on 4/26/2012. Click here.
View all notes |
Alert me of new notes |
CANSLIM.net Company Profile |
SEC |
Zacks Reports |
StockTalk |
News |
Chart |
Request a new note
C
A N
S L
I M
|
ISRG
-
NASDAQ
Intuitive Surgical Inc
HEALTH SERVICES - Medical Appliances and Equipment
|
$550.56
|
-8.39
-1.50% |
$557.73
|
205,651
71.36% of 50 DAV
50 DAV is 288,200
|
$594.89
-7.45%
|
12/20/2011
|
$442.43
|
PP = $449.16
|
|
MB = $471.62
|
Most Recent Note - 5/10/2012 11:11:12 AM
G - Today it is consolidating near its 50 DMA line that defines important support after 6 consecutive losses. Last week's loss broke a streak of 11 consecutive weekly gains.
>>> The latest Featured Stock Update with an annotated graph appeared on 3/1/2012. Click here.
View all notes |
Alert me of new notes |
CANSLIM.net Company Profile |
SEC |
Zacks Reports |
StockTalk |
News |
Chart |
Request a new note
C
A N
S L
I M
|
Symbol/Exchange
Company Name
Industry Group |
PRICE |
CHANGE
(%Change) |
Day High |
Volume
(% DAV)
(% 50 day avg vol) |
52 Wk Hi
% From Hi |
Featured
Date |
Price
Featured |
Pivot Featured |
|
Max Buy |
JAZZ
-
NASDAQ
Jazz Pharmaceuticals Plc
DRUGS - Biotechnology
|
$47.87
|
-2.58
-5.11% |
$50.58
|
1,024,766
109.09% of 50 DAV
50 DAV is 939,400
|
$54.50
-12.17%
|
4/27/2012
|
$51.93
|
PP = $51.39
|
|
MB = $53.96
|
Most Recent Note - 5/14/2012 5:47:37 PM
G - Down today with above average volume closing just below its 50 DMA line, and its color code is changed to green. It stalled after a considerable gap up gain on 4/27/12 backed by 4 times average volume technically cleared a "double bottom" base pattern. Prior lows and its 200 DMA line coincide in the $42 area defining the next important support level to watch.
>>> The latest Featured Stock Update with an annotated graph appeared on 4/27/2012. Click here.
View all notes |
Alert me of new notes |
CANSLIM.net Company Profile |
SEC |
Zacks Reports |
StockTalk |
News |
Chart |
Request a new note
C
A N
S L
I M
|
LULU
-
NASDAQ
Lululemon Athletica
MANUFACTURING - Textile Manufacturing
|
$72.23
|
-1.31
-1.78% |
$73.66
|
1,879,285
86.92% of 50 DAV
50 DAV is 2,162,200
|
$81.09
-10.93%
|
5/1/2012
|
$76.05
|
PP = $77.23
|
|
MB = $81.09
|
Most Recent Note - 5/8/2012 11:16:38 AM
G - Down considerably today, raising concerns while violating its 50 DMA line with volume running at an above average pace, and its color code is changed to green. Prior low ($69.64 on 4/24/12) defines important near-term support where further deterioration would raise greater concerns.
>>> The latest Featured Stock Update with an annotated graph appeared on 4/12/2012. Click here.
View all notes |
Alert me of new notes |
CANSLIM.net Company Profile |
SEC |
Zacks Reports |
StockTalk |
News |
Chart |
Request a new note
C
A N
S L
I M
|
MA
-
NYSE
Mastercard Inc Cl A
DIVERSIFIED SERVICES - Business/Management Services
|
$414.44
|
-7.96
-1.88% |
$421.00
|
1,216,311
134.55% of 50 DAV
50 DAV is 904,000
|
$466.98
-11.25%
|
3/12/2012
|
$419.86
|
PP = $428.67
|
|
MB = $450.10
|
Most Recent Note - 5/8/2012 11:18:57 AM
G - Loss today has it slumping under its 50 DMA line for the first time since 2/01/12, raising concerns. Prior low ($420.75 on 4/23/12) defines near-term support where further deterioration would raise greater concerns.
>>> The latest Featured Stock Update with an annotated graph appeared on 4/11/2012. Click here.
View all notes |
Alert me of new notes |
CANSLIM.net Company Profile |
SEC |
Zacks Reports |
StockTalk |
News |
Chart |
Request a new note
C
A N
S L
I M
|
MG
-
NYSE
Mistras Group Inc
DIVERSIFIED SERVICES - Bulding and Faci;ity Management Services
|
$23.45
|
-0.53
-2.21% |
$23.95
|
165,802
169.01% of 50 DAV
50 DAV is 98,100
|
$26.24
-10.63%
|
3/22/2012
|
$24.96
|
PP = $26.34
|
|
MB = $27.66
|
Most Recent Note - 5/7/2012 1:15:32 PM
G - Trading up above its 50 DMA line today. The next near-term support level is its 200 DMA line. Previously noted - "A volume-driven gain above its recent chart high ($25.49 on 3/21/12) may help trigger a proper technical buy signal after a new base formation, however no new (lower) pivot point is currently being cited, and it may continue encountering stubborn resistance."
>>> The latest Featured Stock Update with an annotated graph appeared on 4/2/2012. Click here.
View all notes |
Alert me of new notes |
CANSLIM.net Company Profile |
SEC |
Zacks Reports |
StockTalk |
News |
Chart |
Request a new note
C
A N
S L
I M
|
NTES
-
NASDAQ
Netease Inc Adr
INTERNET - Internet Information Providers
|
$56.26
|
-1.00
-1.75% |
$57.82
|
334,929
50.08% of 50 DAV
50 DAV is 668,800
|
$61.45
-8.45%
|
3/19/2012
|
$56.18
|
PP = $55.10
|
|
MB = $57.86
|
Most Recent Note - 5/11/2012 1:30:30 PM
G - Up today without great volume, yet rebounding above its 50 DMA line. Prior low ($55.34 on 4/10/12) defines the next important chart support to watch.
>>> The latest Featured Stock Update with an annotated graph appeared on 3/27/2012. Click here.
View all notes |
Alert me of new notes |
CANSLIM.net Company Profile |
SEC |
Zacks Reports |
StockTalk |
News |
Chart |
Request a new note
C
A N
S L
I M
|
Symbol/Exchange
Company Name
Industry Group |
PRICE |
CHANGE
(%Change) |
Day High |
Volume
(% DAV)
(% 50 day avg vol) |
52 Wk Hi
% From Hi |
Featured
Date |
Price
Featured |
Pivot Featured |
|
Max Buy |
PCLN
-
NASDAQ
Priceline.Com Inc
INTERNET - Internet Software and Services
|
$663.18
|
-12.21
-1.81% |
$673.88
|
1,084,043
85.73% of 50 DAV
50 DAV is 1,264,500
|
$774.96
-14.42%
|
4/27/2012
|
$539.46
|
PP = $774.96
|
|
MB = $813.71
|
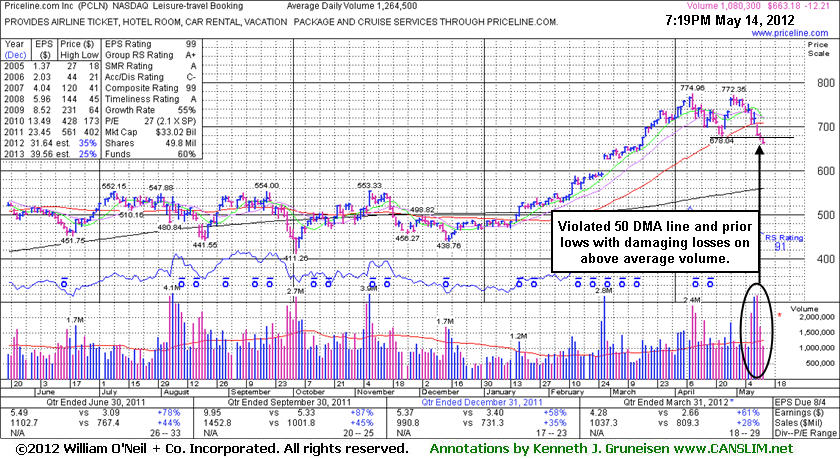
Most Recent Note - 5/14/2012 7:33:08 PM
Slumped further below its 50 DMA line and prior low ($678.04 on 4/24/12), failing to rebound after damaging losses. Only a prompt rebound above its 50 DMA line would help its outlook, but it now faces resistance due to overhead supply up through the $774 level. Based on weak action it will be dropped from the Featured Stocks list tonight. See the latest FSU analysis for more details and a new annotated graph.
>>> The latest Featured Stock Update with an annotated graph appeared on 5/14/2012. Click here.
View all notes |
Alert me of new notes |
CANSLIM.net Company Profile |
SEC |
Zacks Reports |
StockTalk |
News |
Chart |
Request a new note
C
A N
S L
I M
|
RAX
-
NYSE
Rackspace Hosting Inc
INTERNET - Internet Software and; Services
|
$51.41
|
-0.95
-1.81% |
$51.94
|
2,333,497
114.44% of 50 DAV
50 DAV is 2,039,100
|
$60.55
-15.09%
|
4/26/2012
|
$58.39
|
PP = $59.53
|
|
MB = $62.51
|
Most Recent Note - 5/14/2012 7:34:48 PM
Failed to rebound after damaging losses and fell for a 7th consecutive loss today. Only a prompt rebound above its 50 DMA line would help its outlook, but it now faces resistance due to overhead supply up through the $60 level. Based on weak action it will be dropped from the Featured Stocks list tonight.
>>> The latest Featured Stock Update with an annotated graph appeared on 4/10/2012. Click here.
View all notes |
Alert me of new notes |
CANSLIM.net Company Profile |
SEC |
Zacks Reports |
StockTalk |
News |
Chart |
Request a new note
C
A N
S L
I M
|
RGR
-
NYSE
Sturm Ruger & Co Inc
CONSUMER DURABLES - Sporting Goods
|
$46.90
|
-2.95
-5.92% |
$49.58
|
727,004
127.99% of 50 DAV
50 DAV is 568,000
|
$58.42
-19.72%
|
3/22/2012
|
$46.49
|
PP = $46.78
|
|
MB = $49.12
|
Most Recent Note - 5/14/2012 7:15:14 PM
Slumped back below its 50 DMA line with today's damaging loss on above average volume leading to a close -19.7% off its 52-week high. A prompt rebound above its 50 DMA line may help its outlook, yet it now faces overhead supply which may act as resistance up through the $58 level. Based on weak action it will be dropped from the Featured Stocks list tonight.
>>> The latest Featured Stock Update with an annotated graph appeared on 3/22/2012. Click here.
View all notes |
Alert me of new notes |
CANSLIM.net Company Profile |
SEC |
Zacks Reports |
StockTalk |
News |
Chart |
Request a new note
C
A N
S L
I M
|
RRTS
-
NYSE
Roadrunner Trans Systems
TRANSPORTATION - Air Delivery and Freight Service
|
$17.96
|
-0.04
-0.22% |
$18.29
|
120,621
128.46% of 50 DAV
50 DAV is 93,900
|
$19.06
-5.77%
|
5/3/2012
|
$18.20
|
PP = $18.69
|
|
MB = $19.62
|
Most Recent Note - 5/10/2012 11:25:37 AM
Y - Holding its ground this week, not making meaningful price progress following its recent streak of volume-driven gains. It encountered resistance and still needs a strong finish above the pivot point cited to clinch a proper technical buy signal.
>>> The latest Featured Stock Update with an annotated graph appeared on 4/9/2012. Click here.
View all notes |
Alert me of new notes |
CANSLIM.net Company Profile |
SEC |
Zacks Reports |
StockTalk |
News |
Chart |
Request a new note
C
A N
S L
I M
|
SHFL
-
NASDAQ
Shuffle Master Inc
MANUFACTURING - Diversified Machinery
|
$15.60
|
-0.68
-4.18% |
$16.05
|
794,432
116.90% of 50 DAV
50 DAV is 679,600
|
$18.77
-16.89%
|
3/6/2012
|
$17.07
|
PP = $15.25
|
|
MB = $16.01
|
Most Recent Note - 5/14/2012 10:28:58 AM
Gapped down today, slumping further below its 50 DMA line and further below its prior low ($16.14 on 4/10/12), raising more serious concerns. Based on damaging losses it will be dropped from the Featured Stocks list tonight. Only a rebound above its 50 DMA line would help its technical stance improve.
>>> The latest Featured Stock Update with an annotated graph appeared on 3/15/2012. Click here.
View all notes |
Alert me of new notes |
CANSLIM.net Company Profile |
SEC |
Zacks Reports |
StockTalk |
News |
Chart |
Request a new note
C
A N
S L
I M
|
Symbol/Exchange
Company Name
Industry Group |
PRICE |
CHANGE
(%Change) |
Day High |
Volume
(% DAV)
(% 50 day avg vol) |
52 Wk Hi
% From Hi |
Featured
Date |
Price
Featured |
Pivot Featured |
|
Max Buy |
SHOO
-
NASDAQ
Steven Madden Limited
CONSUMER NON-DURABLES - Textile - Apparel Footwear
|
$39.99
|
-0.34
-0.84% |
$40.47
|
317,315
91.71% of 50 DAV
50 DAV is 346,000
|
$45.70
-12.49%
|
4/27/2012
|
$43.20
|
PP = $45.32
|
|
MB = $47.59
|
Most Recent Note - 5/10/2012 6:17:45 PM
G - Technical deterioration below the recent low ($40.91 on 4/24/12) has raised more serious concerns after earnings growth for the quarter ended March 31, 2012 versus the year ago period was below the +25% minimum guideline. See latest FSU analysis for more details and a new annotated graph.
>>> The latest Featured Stock Update with an annotated graph appeared on 5/10/2012. Click here.
View all notes |
Alert me of new notes |
CANSLIM.net Company Profile |
SEC |
Zacks Reports |
StockTalk |
News |
Chart |
Request a new note
C
A N
S L
I M
|
SWI
-
NYSE
Solarwinds Inc
COMPUTER SOFTWARE and SERVICES - Application Software
|
$44.04
|
-0.71
-1.59% |
$44.85
|
611,057
54.34% of 50 DAV
50 DAV is 1,124,500
|
$47.66
-7.60%
|
4/26/2012
|
$45.15
|
PP = $42.32
|
|
MB = $44.44
|
Most Recent Note - 5/11/2012 1:26:12 PM
G - Consolidating near its "max buy" level this week. It triggered a technical buy signal on 4/26/12 as it was featured in the mid-day report and noted - "Reported earnings +43% on +39% sales revenues for the quarter ended March 31, 2012 versus the year ago period. It held its ground stubbornly after violating its 50 DMA line when a damaging loss with above average volume triggered technical sell signals on 4/10/12 and it was dropped from the Featured Stocks list. Earnings below the +25% guideline for the Dec '11 quarter (+21%) had also raised fundamental concerns at that time, however the stock's resilience and impressive acceleration means that 3 of the past 4 quarterly comparisons are now above the minimum guideline concerning the C criteria. Its annual earnings (A criteria) history has been strong."
>>> The latest Featured Stock Update with an annotated graph appeared on 3/16/2012. Click here.
View all notes |
Alert me of new notes |
CANSLIM.net Company Profile |
SEC |
Zacks Reports |
StockTalk |
News |
Chart |
Request a new note
C
A N
S L
I M
|
SXCI
-
NASDAQ
S X C Health Solutions
COMPUTER SOFTWARE and SERVICES - Healthcare Information Service
|
$91.45
|
-1.75
-1.88% |
$92.75
|
935,135
90.54% of 50 DAV
50 DAV is 1,032,800
|
$100.50
-9.00%
|
2/23/2012
|
$68.24
|
PP = $66.05
|
|
MB = $69.35
|
Most Recent Note - 5/11/2012 4:00:28 PM
G - Up today with heavier volume after pricing a new Public Offering. Consolidating in a tight range since it posted huge volume-driven gains on 4/18 and 4/19 while rallying on M&A news.
>>> The latest Featured Stock Update with an annotated graph appeared on 3/6/2012. Click here.
View all notes |
Alert me of new notes |
CANSLIM.net Company Profile |
SEC |
Zacks Reports |
StockTalk |
News |
Chart |
Request a new note
C
A N
S L
I M
|
TDC
-
NYSE
Teradata Corp
COMPUTER SOFTWARE and SERVICES - Technical and; System Software
|
$69.60
|
-1.54
-2.16% |
$71.77
|
2,376,828
154.81% of 50 DAV
50 DAV is 1,535,300
|
$79.89
-12.88%
|
5/3/2012
|
$79.06
|
PP = $70.73
|
|
MB = $74.27
|
Most Recent Note - 5/11/2012 4:08:44 PM
Y - After encountering distributional pressure this week it is still holding its ground still above its pivot point. Its 50 DMA line defines additional near-term support to watch.
>>> The latest Featured Stock Update with an annotated graph appeared on 5/8/2012. Click here.
View all notes |
Alert me of new notes |
CANSLIM.net Company Profile |
SEC |
Zacks Reports |
StockTalk |
News |
Chart |
Request a new note
C
A N
S L
I M
|
TDG
-
NYSE
Transdigm Group Inc
AEROSPACE/DEFENSE - Aerospace/Defense Products and; Services
|
$124.93
|
-0.81
-0.64% |
$125.92
|
502,330
108.52% of 50 DAV
50 DAV is 462,900
|
$132.69
-5.85%
|
2/29/2012
|
$120.10
|
PP = $118.93
|
|
MB = $124.88
|
Most Recent Note - 5/8/2012 12:31:04 PM
G - Reversed into the red after hitting a new all-time high with today's earlier gains. Reported earnings +72% on +39% sales revenues for the quarter ended March 31, 2012 versus the year ago period. Extended from its prior base and above its "max buy" level. Prior highs in the $118-121 area define chart support to watch on pullbacks.
>>> The latest Featured Stock Update with an annotated graph appeared on 3/30/2012. Click here.
View all notes |
Alert me of new notes |
CANSLIM.net Company Profile |
SEC |
Zacks Reports |
StockTalk |
News |
Chart |
Request a new note
C
A N
S L
I M
|
Symbol/Exchange
Company Name
Industry Group |
PRICE |
CHANGE
(%Change) |
Day High |
Volume
(% DAV)
(% 50 day avg vol) |
52 Wk Hi
% From Hi |
Featured
Date |
Price
Featured |
Pivot Featured |
|
Max Buy |
TIBX
-
NASDAQ
Tibco Software Inc
COMPUTER SOFTWARE and SERVICES - Business Software and Services
|
$29.35
|
-0.72
-2.39% |
$29.93
|
3,161,558
102.13% of 50 DAV
50 DAV is 3,095,600
|
$34.67
-15.34%
|
3/30/2012
|
$31.01
|
PP = $31.25
|
|
MB = $32.81
|
Most Recent Note - 5/14/2012 7:36:14 PM
Slumping under its 50 DMA lineand under prior resistance in the $31 area has not acted as a support level. Only a prompt rebound above its 50 DMA line would help its outlook, but it now faces resistance due to overhead supply up through the $34 level. Based on weak action it will be dropped from the Featured Stocks list tonight.
>>> The latest Featured Stock Update with an annotated graph appeared on 4/5/2012. Click here.
View all notes |
Alert me of new notes |
CANSLIM.net Company Profile |
SEC |
Zacks Reports |
StockTalk |
News |
Chart |
Request a new note
C
A N
S L
I M
|
TNGO
-
NASDAQ
Tangoe Inc
COMPUTER SOFTWARE and SERVICES - Technical and System Software
|
$22.05
|
-0.67
-2.95% |
$22.37
|
325,689
51.52% of 50 DAV
50 DAV is 632,100
|
$23.05
-4.34%
|
3/27/2012
|
$19.35
|
PP = $20.00
|
|
MB = $21.00
|
Most Recent Note - 5/11/2012 4:03:58 PM
G - It found impressive support at its 50 DMA line and now it is extended from its prior base. Up today with light volume while rallying further above its "max buy" level for a best-ever close.
>>> The latest Featured Stock Update with an annotated graph appeared on 4/3/2012. Click here.
View all notes |
Alert me of new notes |
CANSLIM.net Company Profile |
SEC |
Zacks Reports |
StockTalk |
News |
Chart |
Request a new note
C
A N
S L
I M
|
TSCO
-
NASDAQ
Tractor Supply Co
SPECIALTY RETAIL - Specialty Retail, Other
|
$98.15
|
-0.49
-0.50% |
$99.34
|
1,045,621
130.57% of 50 DAV
50 DAV is 800,800
|
$101.20
-3.01%
|
5/1/2012
|
$98.38
|
PP = $101.30
|
|
MB = $106.37
|
Most Recent Note - 5/8/2012 6:29:41 PM
Y - Pulled back and tested support at its 50 DMA line today yet rebounded to finish near the session high. Volume-driven gains to new highs didn't trigger a new (or add-on) technical buy signal in recent weeks.
>>> The latest Featured Stock Update with an annotated graph appeared on 4/17/2012. Click here.
View all notes |
Alert me of new notes |
CANSLIM.net Company Profile |
SEC |
Zacks Reports |
StockTalk |
News |
Chart |
Request a new note
C
A N
S L
I M
|
UA
-
NYSE
Under Armour Inc Cl A
CONSUMER NON-DURABLES - Textile - Apparel Clothing
|
$94.06
|
-0.76
-0.80% |
$94.97
|
673,675
71.03% of 50 DAV
50 DAV is 948,400
|
$102.86
-8.56%
|
2/15/2012
|
$85.77
|
PP = $84.86
|
|
MB = $89.10
|
Most Recent Note - 5/9/2012 1:06:34 PM
G - Rising back toward its 50 DMA line with today's gain. That short-term average may now act as a resistance level following the violation on the prior session which triggered technical sell signals. Concerns were raised by weaker fundamentals. Reported earnings +22% on +23% sales revenues for the quarter ended March 31, 2012 versus the year ago period, its first quarterly earnings increase below the +25% minimum guideline in more than 2 years.
>>> The latest Featured Stock Update with an annotated graph appeared on 4/4/2012. Click here.
View all notes |
Alert me of new notes |
CANSLIM.net Company Profile |
SEC |
Zacks Reports |
StockTalk |
News |
Chart |
Request a new note
C
A N
S L
I M
|
V
-
NYSE
Visa Inc Cl A
DIVERSIFIED SERVICES - Business/Management Services
|
$116.72
|
-1.20
-1.02% |
$118.36
|
4,061,604
121.00% of 50 DAV
50 DAV is 3,356,800
|
$125.35
-6.88%
|
3/12/2012
|
$116.53
|
PP = $119.46
|
|
MB = $125.43
|
Most Recent Note - 5/10/2012 11:28:36 AM
G - Consolidating just under its 50 DMA line which has acted as a resistance level after the technical violation on 5/03/12. Color code is changed to green. A rebound above its 50 DMA line is needed for its technical stance and outlook to improve.
>>> The latest Featured Stock Update with an annotated graph appeared on 3/7/2012. Click here.
View all notes |
Alert me of new notes |
CANSLIM.net Company Profile |
SEC |
Zacks Reports |
StockTalk |
News |
Chart |
Request a new note
C
A N
S L
I M
|
Symbol/Exchange
Company Name
Industry Group |
PRICE |
CHANGE
(%Change) |
Day High |
Volume
(% DAV)
(% 50 day avg vol) |
52 Wk Hi
% From Hi |
Featured
Date |
Price
Featured |
Pivot Featured |
|
Max Buy |
VMW
-
NYSE
Vmware Inc Cl A
COMPUTER SOFTWARE andamp; SERVICES - Technical andamp; System Software
|
$100.67
|
-1.65
-1.61% |
$102.41
|
954,359
57.86% of 50 DAV
50 DAV is 1,649,500
|
$118.79
-15.25%
|
4/18/2012
|
$110.04
|
PP = $115.29
|
|
MB = $121.05
|
Most Recent Note - 5/14/2012 7:38:03 PM
Failed to rebound after violating its 50 DMA line undercutting its prior low ($102.66 on 4/24/12). Only a prompt rebound above its 50 DMA line would help its outlook, but it now faces resistance due to overhead supply up through the $118 level. Based on weak action it will be dropped from the Featured Stocks list tonight.
>>> The latest Featured Stock Update with an annotated graph appeared on 4/18/2012. Click here.
View all notes |
Alert me of new notes |
CANSLIM.net Company Profile |
SEC |
Zacks Reports |
StockTalk |
News |
Chart |
Request a new note
C
A N
S L
I M
|
VSI
-
NYSE
Vitamin Shoppe Inc
SPECIALTY RETAIL - Specialty Retail, Other
|
$53.79
|
-0.36
-0.66% |
$54.40
|
469,141
105.95% of 50 DAV
50 DAV is 442,800
|
$55.29
-2.71%
|
4/25/2012
|
$47.77
|
PP = $48.46
|
|
MB = $50.88
|
Most Recent Note - 5/11/2012 4:10:22 PM
G -Perched at it 52-week high today following considerable volume-driven gains this week bucking a broadly negative market. It is extended from its prior base.
>>> The latest Featured Stock Update with an annotated graph appeared on 4/25/2012. Click here.
View all notes |
Alert me of new notes |
CANSLIM.net Company Profile |
SEC |
Zacks Reports |
StockTalk |
News |
Chart |
Request a new note
C
A N
S L
I M
|
WFM
-
NASDAQ
Whole Foods Market Inc
RETAIL - Grocery Stores
|
$87.45
|
-1.09
-1.23% |
$88.13
|
1,499,992
97.20% of 50 DAV
50 DAV is 1,543,200
|
$91.50
-4.43%
|
5/3/2012
|
$90.28
|
PP = $86.45
|
|
MB = $90.77
|
Most Recent Note - 5/11/2012 7:07:48 PM
Y - Consolidating above prior highs since its considerable "breakaway gap" on 5/03/12 that cleared an orderly flat base pattern. The is no resistance remaining due to overhead supply. See the latest FSU analysis for more details and a new annotated graph.
>>> The latest Featured Stock Update with an annotated graph appeared on 5/11/2012. Click here.
View all notes |
Alert me of new notes |
CANSLIM.net Company Profile |
SEC |
Zacks Reports |
StockTalk |
News |
Chart |
Request a new note
C
A N
S L
I M
|