You are not logged in.
This means you
CAN ONLY VIEW reports that were published prior to Tuesday, July 9, 2024.
You
MUST UPGRADE YOUR MEMBERSHIP if you want to see any current reports.
AFTER MARKET UPDATE - TUESDAY, MAY 14TH, 2024
Previous After Market Report Next After Market Report >>>
|
|
|
|
DOW |
+126.60 |
39,558.11 |
+0.32% |
|
Volume |
1,042,632,959 |
+10% |
|
Volume |
7,315,764,900 |
+62% |
|
NASDAQ |
+122.94 |
16,511.18 |
+0.75% |
|
Advancers |
1,860 |
67% |
|
Advancers |
2,783 |
66% |
|
S&P 500 |
+25.26 |
5,246.68 |
+0.48% |
|
Decliners |
920 |
33% |
|
Decliners |
1,445 |
34% |
|
Russell 2000 |
+23.57 |
2,085.69 |
+1.14% |
|
52 Wk Highs |
149 |
|
|
52 Wk Highs |
161 |
|
|
S&P 600 |
+14.21 |
1,340.43 |
+1.07% |
|
52 Wk Lows |
13 |
|
|
52 Wk Lows |
76 |
|
|
Tuesday's new all-time high for the Nasdaq Composite Index signaled a new confirmed uptrend for the market (M criteria). New buying efforts should only be made in stocks meeting all key criteria under the fact-based investment system's guidelines.
|
 |
Nasdaq Composite New High Signals Uptrend for Major Indices
Kenneth J. Gruneisen - Passed the CAN SLIM® Master's Exam
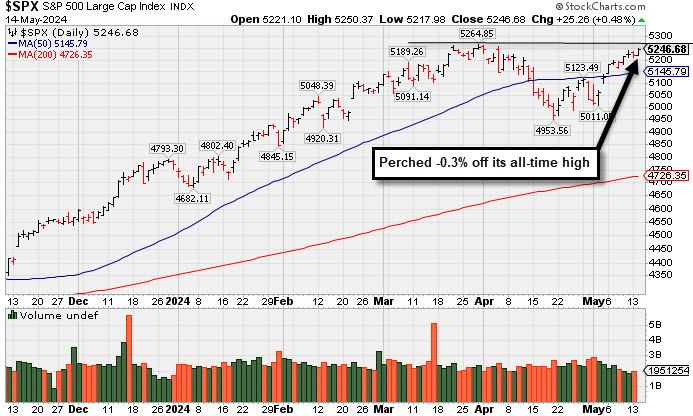
The major indices all settled at or near session highs, which marked a fresh all-time closing high for the Nasdaq Composite. The S&P 500 settled within ten points of its all-time high close. The Russell 2000 continued its recent outperformance, gaining +1.2%.Volume reported was higher than the prior session totals on the NYSE and on the Nasdaq exchange. Breadth clearly had a positive bias as advancers led decliners by a 2-1 margin on the NYSE and nearly 2-1 on the Nasdaq exchange. There were 60 high-ranked companies from the Leaders List that hit new 52-week highs and were listed on the BreakOuts Page versus 59 on the prior session. New 52-week highs totals outnumbered new 52-week lows on the NYSE and on the Nasdaq exchange. The major indices are now in a confirmed uptrend (M criteria) based upon the new high close by the Nasdaq Composite Index.
PICTURED: The S&P 500 Index is perched -0.3% off its all-time high.
The April Producer Price Index (PPI) headline inflation readings were hotter-than-expected, up 0.5% month-over-month for total PPI and core PPI versus an expected 0.3% and 0.2%, respectively. Sizable downward revisions to last month's readings kept the market response more mixed rather than negative. Fed Chair Powell called the data "quite mixed" in a moderated discussion at the Foreign Bankers' Association's annual meeting. The 10-yr note yield settled the session at 4.45%.
Another meme stock rally saw GameStop (GME +60.10%) and AMC Entertainment (AMC +31.98%) both trade up more than 100% at one point before profit-taking activity. Meanwhile, Dow component Home Depot (HD -0.13%) was slightly lower after its earnings report revealed disappointing sales activity at the home improvement retailer.
Eight of the 11 S&P 500 sectors settled with gains led by information technology (+0.9%) and real estate (+0.7%). The consumer staples sector was the worst performer, logging a 0.2% gain.
|
 Kenneth J. Gruneisen started out as a licensed stockbroker in August 1987, a couple of months prior to the historic stock market crash that took the Dow Jones Industrial Average down -22.6% in a single day. He has published daily fact-based fundamental and technical analysis on high-ranked stocks online for two decades. Through FACTBASEDINVESTING.COM, Kenneth provides educational articles, news, market commentary, and other information regarding proven investment systems that work in good times and bad.
Comments contained in the body of this report are technical opinions only and are not necessarily those of Gruneisen Growth Corp. The material herein has been obtained from sources believed to be reliable and accurate, however, its accuracy and completeness cannot be guaranteed. Our firm, employees, and customers may effect transactions, including transactions contrary to any recommendation herein, or have positions in the securities mentioned herein or options with respect thereto. Any recommendation contained in this report may not be suitable for all investors and it is not to be deemed an offer or solicitation on our part with respect to the purchase or sale of any securities. |
|
 |
Financial, Tech, and Commodity-Linked Groups Rose
Kenneth J. Gruneisen - Passed the CAN SLIM® Master's Exam
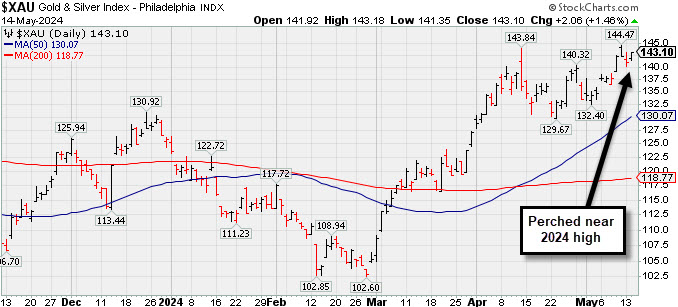
The Bank Index ($BKX +0.91%) and the Broker/Dealer Index ($XBD +1.15%) posted influential gains on Tuesday while the Retail Index ($RLX +0.12%) inched higher. The tech sector had a positive bias as the Networking Index ($NWX +3.04%) outpaced the Semiconductor Index ($SOX +1.68%) while the Biotech Index ($BTK +0.55%) posted a smaller gain. The Gold & Silver Index ($XAU +1.46%) and the Oil Services ($OSX +0.99%) both finished higher, meanwhile, the Integrated Oil Index ($XOI -0.45%) ended slightly lower.
![]() PICTURED: The Gold & Silver Index ($XAU +1.46%) is consolidating well above its 50-day moving average (DMA) line near its 2024 high.
| Oil Services |
$OSX |
87.83 |
+0.86 |
+0.99% |
+4.71% |
| Integrated Oil |
$XOI |
2,105.66 |
-9.51 |
-0.45% |
+13.06% |
| Semiconductor |
$SOX |
4,903.93 |
+80.85 |
+1.68% |
+17.45% |
| Networking |
$NWX |
790.58 |
+23.31 |
+3.04% |
-5.07% |
| Broker/Dealer |
$XBD |
625.85 |
+7.12 |
+1.15% |
+12.30% |
| Gold & Silver |
$XAU |
143.10 |
+2.06 |
+1.46% |
+13.85% |
| Bank |
$BKX |
106.54 |
+0.96 |
+0.91% |
+10.96% |
| Biotech |
$BTK |
5,209.41 |
+28.31 |
+0.55% |
-3.86% |
|
|
|
 |
Stubbornly Held Ground and Posted Quiet Gain for Best-Ever Close
Kenneth J. Gruneisen - Passed the CAN SLIM® Master's Exam
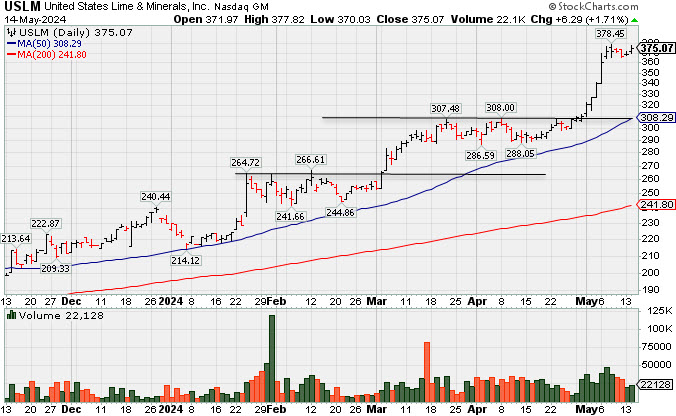
U.S. Lime & Minerals (USLM +$6.29 or +1.71% to $375.07) has been consolidating in a tight range near its all-time high following a recent streak of 9 consecutive volume-driven gains. Its 50-day moving average (DMA) line ($308) coincides with prior highs defining important near-term support to watch on pullbacks. During the ongoing market correction (M criteria) greater caution is important for all investors. New buying efforts should be avoided until a follow-through day signals a new confirmed uptrend.
Bullish action came after it reported Mar '24 quarterly earnings +31% on +7% sales revenues versus the year-ago period. USLM has a highest possible Earnings Per Share Rating of 99. Prior quarterly and annual earnings (C and A criteria) history has been strong, a good match with the fact-based investment system's guidelines. The thinly traded firm has only 5.7 million shares outstanding (S criteria), which can contribute to greater price volatility in the event of institutional buying or selling.
USLM was highlighted in yellow in the 2/09/24 mid-day report (read here) and last shown in this FSU section on 4/26/24 with an annotated graph under the headline, "Trading in Tight Range Near High". The number of top-rated funds owning its shares rose from 192 in Mar '23 to 228 in Mar '24, a reassuring sign concerning the I criteria. Its current Up/Down Volume Ratio of 1.6 is an unbiased indication its shares have been under accumulation over the past 50 days. |
|
|
Color Codes Explained :
Y - Better candidates highlighted by our
staff of experts.
G - Previously featured
in past reports as yellow but may no longer be buyable under the
guidelines.
***Last / Change / Volume data in this table is the closing quote data***
Symbol/Exchange
Company Name
Industry Group |
PRICE |
CHANGE
(%Change) |
Day High |
Volume
(% DAV)
(% 50 day avg vol) |
52 Wk Hi
% From Hi |
Featured
Date |
Price
Featured |
Pivot Featured |
|
Max Buy |
 AXON
-
NASDAQ
AXON
-
NASDAQ
Axon Enterprise
Security/Sfty
|
$296.46
|
-3.77
-1.26% |
$299.01
|
952,753
192.48% of 50 DAV
50 DAV is 495,000
|
$329.87
-10.13%
|
4/5/2024
|
$309.90
|
PP = $325.73
|
|
MB = $342.02
|
 Most Recent Note - 5/14/2024 4:44:40 PM
G - Posted a 6th consecutive loss today undercutting the prior low but finished in the upper third of its intra-day range. A rebound above the 50 DMA line is needed for its outlook to improve. Reported Mar '24 quarterly earnings +31% on +34% sales revenues versus the year-ago period. Fundamentals remain strong.
>>> FEATURED STOCK ARTICLE : Found Support Near 50-Day Moving Average After Recent Stall - 4/29/2024 |
View all notes |
Set NEW NOTE alert |
Company Profile |
SEC
News |
Chart |
Request a new note
C
A
S
I |
TDG
-
NYSE
TransDigm Group
Aerospace/Defense
|
$1,275.77
|
-4.79
-0.37% |
$1,279.40
|
308,132
154.84% of 50 DAV
50 DAV is 199,000
|
$1,330.82
-4.14%
|
4/12/2024
|
$1,224.21
|
PP = $1,246.32
|
|
MB = $1,308.64
|
Most Recent Note - 5/13/2024 5:47:51 PM
G - Pulled back for a 2nd loss today with higher volume after 7 consecutive gains as it rose to new all-time highs. It is extended from any sound base and its 50 DMA line ($1,226) defines near-term support to watch on pullbacks. Reported Mar '24 quarterly earnings +34% on +21% sales revenues versus the year-ago period.
>>> FEATURED STOCK ARTICLE : Found Support at 50-Day Moving Average Line and Hit New High - 4/30/2024 |
View all notes |
Set NEW NOTE alert |
Company Profile |
SEC
News |
Chart |
Request a new note
C
A
S
I |
USLM
-
NASDAQ
U.S. Lime & Minerals
Bldg-Cement/Concrt/Ag
|
$375.07
|
+6.29
1.71% |
$377.82
|
22,129
85.11% of 50 DAV
50 DAV is 26,000
|
$378.45
-0.89%
|
2/9/2024
|
$254.68
|
PP = $265.09
|
|
MB = $278.34
|
Most Recent Note - 5/14/2024 4:41:59 PM
G - Posted a quiet gain today for a best-ever close. Stubbornly holding its ground after a recent streak of 9 consecutive volume-driven gains into new all-time high territory. Its 50 DMA line ($310) defines important near-term support to watch on pullbacks. Fundamentals remain strong. See the latest FSU analysis for more details and a new annotated graph.
>>> FEATURED STOCK ARTICLE : Stubbornly Held Ground and Posted Quiet Gain for Best-Ever Close - 5/14/2024 |
View all notes |
Set NEW NOTE alert |
Company Profile |
SEC
News |
Chart |
Request a new note
C
A
S
I |
|
|
|
THESE ARE NOT BUY RECOMMENDATIONS!
Comments contained in the body of this report are technical
opinions only. The material herein has been obtained
from sources believed to be reliable and accurate, however,
its accuracy and completeness cannot be guaranteed.
This site is not an investment advisor, hence it does
not endorse or recommend any securities or other investments.
Any recommendation contained in this report may not
be suitable for all investors and it is not to be deemed
an offer or solicitation on our part with respect to
the purchase or sale of any securities. All trademarks,
service marks and trade names appearing in this report
are the property of their respective owners, and are
likewise used for identification purposes only.
This report is a service available
only to active Paid Premium Members.
You may opt-out of receiving report notifications
at any time. Questions or comments may be submitted
by writing to Premium Membership Services 665 S.E. 10 Street, Suite 201 Deerfield Beach, FL 33441-5634 or by calling 1-800-965-8307
or 954-785-1121.
|
|
|