You are not logged in.
This means you
CAN ONLY VIEW reports that were published prior to Thursday, April 10, 2025.
You
MUST UPGRADE YOUR MEMBERSHIP if you want to see any current reports.
AFTER MARKET UPDATE - MONDAY, MAY 13TH, 2024
Previous After Market Report Next After Market Report >>>
|
|
|
|
DOW |
-81.33 |
39,431.51 |
-0.21% |
|
Volume |
945,557,693 |
+6% |
|
Volume |
4,515,106,000 |
+2% |
|
NASDAQ |
+47.37 |
16,388.24 |
+0.29% |
|
Advancers |
1,421 |
52% |
|
Advancers |
2,281 |
54% |
|
S&P 500 |
-1.26 |
5,221.42 |
-0.02% |
|
Decliners |
1,309 |
48% |
|
Decliners |
1,957 |
46% |
|
Russell 2000 |
+2.35 |
2,062.12 |
+0.11% |
|
52 Wk Highs |
149 |
|
|
52 Wk Highs |
142 |
|
|
S&P 600 |
+1.84 |
1,326.22 |
+0.14% |
|
52 Wk Lows |
17 |
|
|
52 Wk Lows |
90 |
|
|
Conditions are technically still considered a market "correction" (M criteria). Investors are still cautioned about making new buying efforts until a solid follow-through day marked by higher volume is noted confirming a new uptrend.
|
 |
Major Indices Were Mixed and Little Changed Again
Kenneth J. Gruneisen - Passed the CAN SLIM® Master's Exam
The major indices had another mixed and indecisive session on Monday. Volume reported was higher than the prior session totals on the NYSE and on the Nasdaq exchange. Breadth had a slightly positive tilt as advancers led decliners by a very narrow margin on the NYSE and on the Nasdaq exchange. Leadership thinned as there were 59 high-ranked companies from the Leaders List that hit new 52-week highs and were listed on the BreakOuts Page versus 98 on the prior session. New 52-week highs totals contracted yet outnumbered new 52-week lows on the NYSE and on the Nasdaq exchange. The major indices remain in a market correction (M criteria). Patience is important for all investors until a follow-through day signals a new confirmed uptrend.
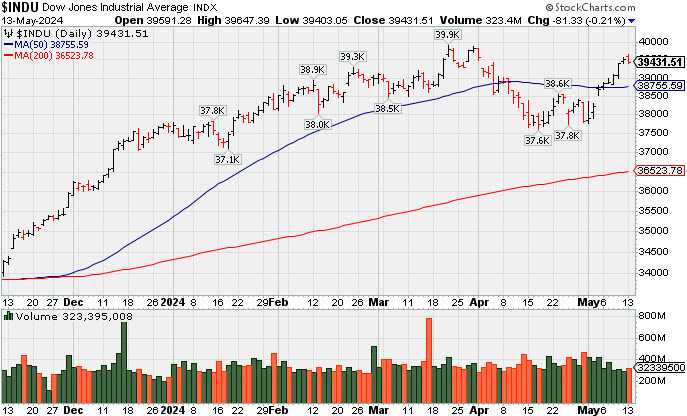
PICTURED: The Dow Jones Industrial Average paused on Monday after rebounding above its 50-day moving average (DMA) line toward the prior high with a streak of 8 consecutive gains.
The New York Fed's latest Survey of Consumer Expectations showed an increase in year-ahead inflation expectations to 3.3% from 3.0%. The 10-yr note yield settled two basis points lower at 4.48% and the 2-yr note yield settled one basis point lower at 4.86%. The market appeared mostly indecisive ahead of the release of the April Producer Price Index due at 8:30 ET Tuesday. The April Consumer Price Index will be released Wednesday at 8:30 ET. Earnings results are also due this week from Dow components Home Depot (HD -1.58%), Cisco (CSCO +1.29%), and Walmart (WMT -0.12%).
Some stocks closed with outsized gains as GameStop (GME +74.40%) surged following the first X post by "Roaring Kitty" in three years. Meanwhile, Beyond Inc (BYON +17.38%), Koss Corp (KOSS +36.66%), and AMC Entertainment (AMC +78.35%) also benefitted from speculative buying interest.
|
 Kenneth J. Gruneisen started out as a licensed stockbroker in August 1987, a couple of months prior to the historic stock market crash that took the Dow Jones Industrial Average down -22.6% in a single day. He has published daily fact-based fundamental and technical analysis on high-ranked stocks online for two decades. Through FACTBASEDINVESTING.COM, Kenneth provides educational articles, news, market commentary, and other information regarding proven investment systems that work in good times and bad.
Comments contained in the body of this report are technical opinions only and are not necessarily those of Gruneisen Growth Corp. The material herein has been obtained from sources believed to be reliable and accurate, however, its accuracy and completeness cannot be guaranteed. Our firm, employees, and customers may effect transactions, including transactions contrary to any recommendation herein, or have positions in the securities mentioned herein or options with respect thereto. Any recommendation contained in this report may not be suitable for all investors and it is not to be deemed an offer or solicitation on our part with respect to the purchase or sale of any securities. |
|
 |
Retail, Bank, and Gold & Silver Indexes Fell
Kenneth J. Gruneisen - Passed the CAN SLIM® Master's Exam
The Retail Index ($RLX -0.54%) and the Bank Index ($BKX -0.44) ended Monday's session small losses while the Broker/Dealer Index ($XBD -0.00%) was unchanged. The tech sector had a positive bias as the Semiconductor Index ($SOX +0.31%) and Networking Index ($NWX +0.29%) both edged higher and the Biotech Index ($BTK +1.12%) posted a solid gain. The Gold & Silver Index ($XAU -0.84%) slumped and the Integrated Oil Index ($XOI -0.46%) ended lower while the Oil Services ($OSX +0.38%) edged higher.
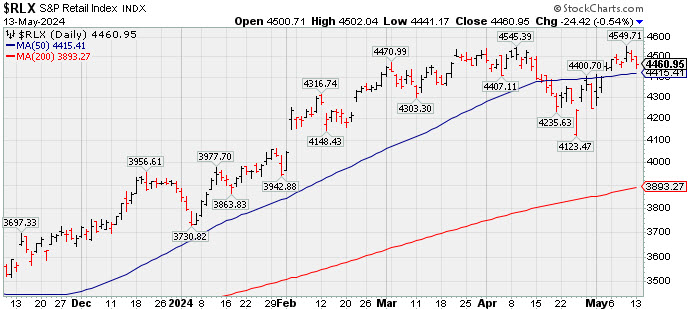
![]() PICTURED: The Retail Index ($RLX -0.54%) is consolidating above its 50-day moving average (DMA) line after touching a new 52-week high last week.
| Oil Services |
$OSX |
86.97 |
+0.33 |
+0.38% |
+3.68% |
| Integrated Oil |
$XOI |
2,115.17 |
-9.70 |
-0.46% |
+13.57% |
| Semiconductor |
$SOX |
4,823.09 |
+15.06 |
+0.31% |
+15.51% |
| Networking |
$NWX |
767.27 |
+2.22 |
+0.29% |
-7.87% |
| Broker/Dealer |
$XBD |
618.73 |
+0.03 |
+0.00% |
+11.02% |
| Retail |
$RLX |
4,460.95 |
-24.42 |
-0.54% |
+14.71% |
| Gold & Silver |
$XAU |
141.04 |
-1.19 |
-0.84% |
+12.21% |
| Bank |
$BKX |
105.58 |
-0.46 |
-0.44% |
+9.96% |
| Biotech |
$BTK |
5,181.10 |
+57.13 |
+1.12% |
-4.39% |
|
|
|
 |
Featured Stocks
Kenneth J. Gruneisen - Passed the CAN SLIM® Master's Exam
|
|
|
Color Codes Explained :
Y - Better candidates highlighted by our
staff of experts.
G - Previously featured
in past reports as yellow but may no longer be buyable under the
guidelines.
***Last / Change / Volume data in this table is the closing quote data***
Symbol/Exchange
Company Name
Industry Group |
PRICE |
CHANGE
(%Change) |
Day High |
Volume
(% DAV)
(% 50 day avg vol) |
52 Wk Hi
% From Hi |
Featured
Date |
Price
Featured |
Pivot Featured |
|
Max Buy |
 AXON
-
NASDAQ
AXON
-
NASDAQ
Axon Enterprise
Security/Sfty
|
$300.23
|
-3.20
-1.05% |
$305.11
|
481,514
95.73% of 50 DAV
50 DAV is 503,000
|
$329.87
-8.99%
|
4/5/2024
|
$309.90
|
PP = $325.73
|
|
MB = $342.02
|
 Most Recent Note - 5/13/2024 5:46:54 PM
G - Fell further below its 50 DMA line ($310) with today's 5th consecutive loss. More damaging losses below the prior low ($291.35 on 4/19/24) would trigger a worrisome technical sell signal. Reported Mar '24 quarterly earnings +31% on +34% sales revenues versus the year-ago period. Fundamentals remain strong.
>>> FEATURED STOCK ARTICLE : Found Support Near 50-Day Moving Average After Recent Stall - 4/29/2024 |
View all notes |
Set NEW NOTE alert |
Company Profile |
SEC
News |
Chart |
Request a new note
C
A
S
I |
TDG
-
NYSE
TransDigm Group
Aerospace/Defense
|
$1,280.56
|
-29.93
-2.28% |
$1,317.81
|
245,927
124.21% of 50 DAV
50 DAV is 198,000
|
$1,330.82
-3.78%
|
4/12/2024
|
$1,224.21
|
PP = $1,246.32
|
|
MB = $1,308.64
|
Most Recent Note - 5/13/2024 5:47:51 PM
G - Pulled back for a 2nd loss today with higher volume after 7 consecutive gains as it rose to new all-time highs. It is extended from any sound base and its 50 DMA line ($1,226) defines near-term support to watch on pullbacks. Reported Mar '24 quarterly earnings +34% on +21% sales revenues versus the year-ago period.
>>> FEATURED STOCK ARTICLE : Found Support at 50-Day Moving Average Line and Hit New High - 4/30/2024 |
View all notes |
Set NEW NOTE alert |
Company Profile |
SEC
News |
Chart |
Request a new note
C
A
S
I |
USLM
-
NASDAQ
U.S. Lime & Minerals
Bldg-Cement/Concrt/Ag
|
$368.78
|
+2.52
0.69% |
$372.00
|
19,646
75.56% of 50 DAV
50 DAV is 26,000
|
$378.45
-2.56%
|
2/9/2024
|
$254.68
|
PP = $265.09
|
|
MB = $278.34
|
Most Recent Note - 5/13/2024 5:48:54 PM
G - Volume is cooling while stubbornly holding its ground after a noted streak of 9 consecutive gains into new all-time high territory. Its 50 DMA line ($306) and recent lows define near-term support to watch. Bullish action came after it reported Mar '24 quarterly earnings +31% on +7% sales revenues versus the year-ago period.
>>> FEATURED STOCK ARTICLE : Trading in Tight Range Near High - 4/26/2024 |
View all notes |
Set NEW NOTE alert |
Company Profile |
SEC
News |
Chart |
Request a new note
C
A
S
I |
|
|
|
THESE ARE NOT BUY RECOMMENDATIONS!
Comments contained in the body of this report are technical
opinions only. The material herein has been obtained
from sources believed to be reliable and accurate, however,
its accuracy and completeness cannot be guaranteed.
This site is not an investment advisor, hence it does
not endorse or recommend any securities or other investments.
Any recommendation contained in this report may not
be suitable for all investors and it is not to be deemed
an offer or solicitation on our part with respect to
the purchase or sale of any securities. All trademarks,
service marks and trade names appearing in this report
are the property of their respective owners, and are
likewise used for identification purposes only.
This report is a service available
only to active Paid Premium Members.
You may opt-out of receiving report notifications
at any time. Questions or comments may be submitted
by writing to Premium Membership Services 665 S.E. 10 Street, Suite 201 Deerfield Beach, FL 33441-5634 or by calling 1-800-965-8307
or 954-785-1121.
|
|
|