You are not logged in.
This means you
CAN ONLY VIEW reports that were published prior to Monday, April 14, 2025.
You
MUST UPGRADE YOUR MEMBERSHIP if you want to see any current reports.
AFTER MARKET UPDATE - MONDAY, MAY 13TH, 2013
Previous After Market Report Next After Market Report >>>
|
|
|
|
DOW |
-26.81 |
15,091.68 |
-0.18% |
|
Volume |
593,724,340 |
-6% |
|
Volume |
1,569,155,840 |
-5% |
|
NASDAQ |
+2.21 |
3,438.79 |
+0.06% |
|
Advancers |
1,188 |
38% |
|
Advancers |
1,132 |
44% |
|
S&P 500 |
+0.07 |
1,633.77 |
+0.00% |
|
Decliners |
1,827 |
59% |
|
Decliners |
1,344 |
52% |
|
Russell 2000 |
-1.37 |
973.79 |
-0.14% |
|
52 Wk Highs |
298 |
|
|
52 Wk Highs |
177 |
|
|
S&P 600 |
-1.53 |
547.05 |
-0.28% |
|
52 Wk Lows |
12 |
|
|
52 Wk Lows |
18 |
|
|
 |
Major Averages Ended Mixed With Lighter Volume Totals on the Exchanges
Kenneth J. Gruneisen - Passed the CAN SLIM® Master's Exam
The major averages ended mixed on Monday. The volume totals were reported lighter than the prior session totals on the Nasdaq exchange and on the NYSE. Breadth was negative as decliners led advancing issues by about a 3-2 margin on the NYSE while the mix was closer to even on the Nasdaq exchange. There were 81 high-ranked companies from the CANSLIM.net Leaders List making new 52-week highs and appearing on the CANSLIM.net BreakOuts Page, down from the prior session total of 86 stocks. New 52-week highs outnumbered new 52-week lows on both the NYSE and the Nasdaq exchange. There were gains for 10 of the 15 high-ranked companies currently included on the Featured Stocks Page.
The recent rally stalled as investors weighed taking profits amid mixed economic reports. Retail sales unexpectedly advanced by +0.1% in April and, excluding autos and gasoline, sales increased the most since December 2012. On the downside, business inventories were unchanged for the second consecutive month in March and sales fell by the most in nine months. Meanwhile in Asia, China's fixed-asset investment surprisingly decelerated last month while industrial production trailed estimates.
Overall, sector action was mixed. Materials and Telecommunication were worst performing groups as Peabody Energy Corp (BTU -4.14%) and Sprint Nextel Corp (S -2.45%) pulled back. Energy stocks also fell as crude oil declined for a third day after OPEC boosted its output to the highest level in five months. A rally in Health Care helped limit losses led by Biogen Idec Inc (BIIB +4.46%) and Gilead Sciences Inc (GILD +3.01%). Financials also gained ground as JP Morgan Chase & Co (JPM +1.45%) and BlackRock, Inc(BLK +0.98%) rose.
In fixed-income, Treasuries extended last week's retreat. The 10-year note was down 6/32 to yield 1.92% and the 30-year bond lost over half of a point to yield 3.13%.
The market (M criteria) saw an expansion in leadership (stocks hitting new 52-week highs) that reassured investors a confirmed uptrend is at hand. Watch for new stocks featured in the CANSLIM.net Mid-Day BreakOuts Report. Action-worthy leaders are covered on an ongoing basis with the latest notes and additional resource links included on the Featured Stocks Page. Watch for an announcement via email concerning the next WEBCAST. The webcast will also be available via an updated link highlighted at the top of the Premium Member Homepage.
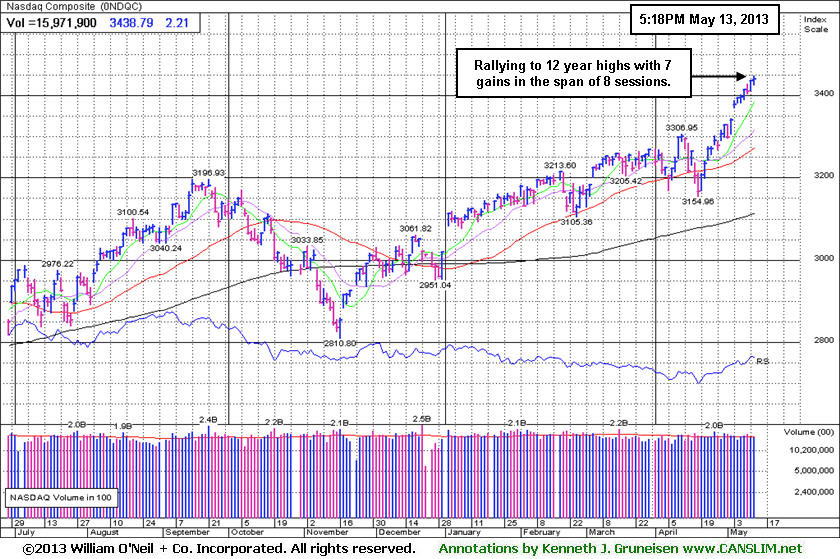
PICTURED: The Nasdaq Composite Index has rallied to 12-year highs with a spurt of 7 gains in the span of 8 sessions. The indices' rally to new highs confirmed the market's uptrend which means odds are favorable for new buying efforts in stocks meeting all of the fact-based investment system's key criteria.
|
 Kenneth J. Gruneisen started out as a licensed stockbroker in August 1987, a couple of months prior to the historic stock market crash that took the Dow Jones Industrial Average down -22.6% in a single day. He has published daily fact-based fundamental and technical analysis on high-ranked stocks online for two decades. Through FACTBASEDINVESTING.COM, Kenneth provides educational articles, news, market commentary, and other information regarding proven investment systems that work in good times and bad.
Comments contained in the body of this report are technical opinions only and are not necessarily those of Gruneisen Growth Corp. The material herein has been obtained from sources believed to be reliable and accurate, however, its accuracy and completeness cannot be guaranteed. Our firm, employees, and customers may effect transactions, including transactions contrary to any recommendation herein, or have positions in the securities mentioned herein or options with respect thereto. Any recommendation contained in this report may not be suitable for all investors and it is not to be deemed an offer or solicitation on our part with respect to the purchase or sale of any securities. |
|
 |
Financial Groups' Positive Bias Underpinned Market
Kenneth J. Gruneisen - Passed the CAN SLIM® Master's Exam
Financial shares had a positive bias on Monday as the Broker/Dealer Index ($XBD +1.06%) outpaced the Bank Index ($BKX +0.44%). The Gold & Silver Index ($XAU -2.50%) was a standout laggard with a large loss. The Biotechnology Index ($BTK +1.40%) led the tech sector higher while Semiconductor Index ($SOX -1.00%) ended lower, and the Networking Index ($NWX +0.04%) and the Internet Index ($IIX +0.05%) each finished virtually unchanged. There was little change for the Retail Index ($RLX +0.15%) and the Healthcare Index ($HMO -0.11%). Energy-related share also showed very little conviction as the Integrated Oil Index ($XOI +0.13%) inched higher while the Oil Services Index ($OSX -0.25%) edged lower.
Charts courtesy www.stockcharts.com
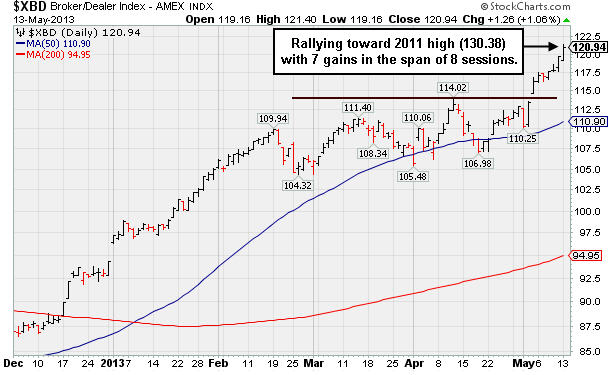
PICTURED: The Broker/Dealer Index ($XBD +1.06%) is rallying toward its 2011 high (130.38) with a streak of 7 gains in the span of 8 sessions.
| Oil Services |
$OSX |
259.04 |
-0.65 |
-0.25% |
+17.66% |
| Healthcare |
$HMO |
3,105.51 |
-3.28 |
-0.11% |
+23.52% |
| Integrated Oil |
$XOI |
1,380.66 |
+1.81 |
+0.13% |
+11.18% |
| Semiconductor |
$SOX |
461.28 |
-4.66 |
-1.00% |
+20.11% |
| Networking |
$NWX |
234.79 |
+0.10 |
+0.04% |
+3.64% |
| Internet |
$IIX |
377.54 |
+0.18 |
+0.05% |
+15.45% |
| Broker/Dealer |
$XBD |
120.94 |
+1.26 |
+1.06% |
+28.21% |
| Retail |
$RLX |
778.93 |
+1.18 |
+0.15% |
+19.27% |
| Gold & Silver |
$XAU |
105.81 |
-2.71 |
-2.50% |
-36.11% |
| Bank |
$BKX |
58.79 |
+0.26 |
+0.44% |
+14.65% |
| Biotech |
$BTK |
2,026.13 |
+27.94 |
+1.40% |
+30.97% |
|
|
|
 |
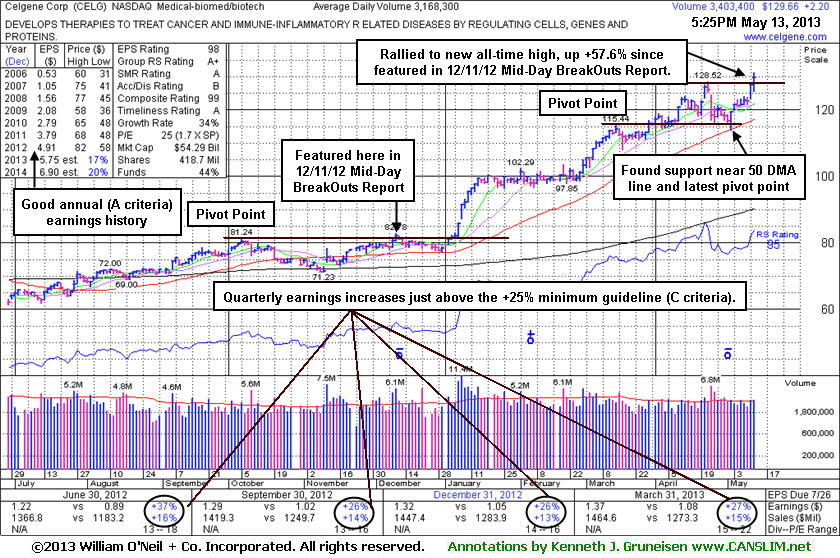
Extended From Base After Tallying +57% Gain in 6-Months
Kenneth J. Gruneisen - Passed the CAN SLIM® Master's Exam
Celgene Corp (CELG +$2.20 or +1.73% to $129.66) rallied to another new high close with its 2nd consecutive big gain with volume slightly above average, getting more extended from any sound base pattern. It found support near its short-term average as it endured some distributional pressure recently. The recent low ($114.05 on 5/02/13) defines important chart support just below its 50-day moving average (DMA) line where subsequent violations may trigger technical sell signals.
It rallied to new highs following its last appearance in this FSU section on 4/19/13 with an annotated graph under the headline, "Perched Near All-Time High After Recent Gains Lacked Great Volume", eventually distancing itself from an advanced "3-weeks tight" base noted earlier. It has traded up as much as +57.6% since it was highlighted in yellow long ago in the 12/11/12 Mid-day BreakOuts Report. While it may go on to produce more climactic gains, keep in mind that after its considerable rally in prior months, its latest rally came from what was considered to be a riskier "late-stage" base. CELG has maintained a strong earnings history (C and A criteria), and it recently reported earnings +27% on +15% sales revenues for the Mar '13 quarter. The number of top-rated funds owning its shares rose from 1,623 in Dec '11 to 1,804 in Mar '13, a reassuring trend concerning the I criteria. However, the company is already well-known by the institutional crowd.
|
|
|
Color Codes Explained :
Y - Better candidates highlighted by our
staff of experts.
G - Previously featured
in past reports as yellow but may no longer be buyable under the
guidelines.
***Last / Change / Volume data in this table is the closing quote data***
Symbol/Exchange
Company Name
Industry Group |
PRICE |
CHANGE
(%Change) |
Day High |
Volume
(% DAV)
(% 50 day avg vol) |
52 Wk Hi
% From Hi |
Featured
Date |
Price
Featured |
Pivot Featured |
|
Max Buy |
AL
-
NYSE
Air Lease Corp Cl A
DIVERSIFIED SERVICES - Rental and Leasing Services
|
$29.54
|
-0.46
-1.53% |
$30.28
|
618,913
130.35% of 50 DAV
50 DAV is 474,800
|
$31.00
-4.71%
|
5/9/2013
|
$30.95
|
PP = $29.38
|
|
MB = $30.85
|
 Most Recent Note - 5/13/2013 3:48:13 PM
Y - Holding its ground near prior highs and only -4.6% off its 52-week high. Recently reported earnings +38% on +45% sales revenues for the Mar '13 quarter after highlighted in yellow in the 5/09/13 mid-day report (read here) with a pivot point cited based on its 4/09/13 high while rallying from a "double bottom" base.
>>> The latest Featured Stock Update with an annotated graph appeared on 5/9/2013. Click here.
View all notes |
Alert me of new notes |
CANSLIM.net Company Profile |
SEC |
Zacks Reports |
StockTalk |
News |
Chart |
Request a new note
C
A N
S L
I M


|
AMBA
-
NASDAQ
Ambarella Inc
ELECTRONICS - Semiconductor - Specialized
|
$15.12
|
+0.79
5.51% |
$15.89
|
2,126,801
412.17% of 50 DAV
50 DAV is 516,000
|
$16.00
-5.50%
|
5/6/2013
|
$15.31
|
PP = $16.10
|
|
MB = $16.91
|
Most Recent Note - 5/13/2013 3:58:59 PM
Y - Tallying a considerable volume-driven gain today, but remaining below its pivot point. Previously cautioned - "Volume-driven gains above the new pivot point are needed to trigger a new technical buy signal. Still basing, with near-term resistance due to overhead supply up through the $16 level. Found encouraging support at its 50 DMA line and flashed above average volume behind recent gains while building on a new base."
>>> The latest Featured Stock Update with an annotated graph appeared on 5/6/2013. Click here.
View all notes |
Alert me of new notes |
CANSLIM.net Company Profile |
SEC |
Zacks Reports |
StockTalk |
News |
Chart |
Request a new note
C
A N
S L
I M
|
CELG
-
NASDAQ
Celgene Corp
DRUGS - Drug Manufacturers - Major
|
$129.66
|
+2.20
1.73% |
$131.13
|
3,423,908
108.07% of 50 DAV
50 DAV is 3,168,300
|
$128.52
0.89%
|
3/27/2013
|
$113.24
|
PP = $115.54
|
|
MB = $121.32
|
Most Recent Note - 5/13/2013 6:01:50 PM
G - Rallied to another new high with today's 2nd consecutive gain backed by slightly above average volume. Found support at its 50 DMA line during its recent consolidation. It is extended from any sound base pattern. See the latest FSU analysis for more details and a new annotated graph.
>>> The latest Featured Stock Update with an annotated graph appeared on 5/13/2013. Click here.
View all notes |
Alert me of new notes |
CANSLIM.net Company Profile |
SEC |
Zacks Reports |
StockTalk |
News |
Chart |
Request a new note
C
A N
S L
I M
|
CMCSA
-
NASDAQ
Comcast Corp Cl A
MEDIA - CATV Systems
|
$43.19
|
+0.11
0.26% |
$43.20
|
9,887,119
82.92% of 50 DAV
50 DAV is 11,924,300
|
$43.36
-0.39%
|
12/3/2012
|
$37.08
|
PP = $38.06
|
|
MB = $39.96
|
Most Recent Note - 5/13/2013 6:02:32 PM
G - Despite fundamental concerns repeatedly noted it remains perched at its 52-week high. Reported earnings +13% on +3% sales revenues for the Mar '13 quarter, the 2nd consecutive quarterly comparison with earnings well below the +25% minimum guideline (C criteria).
>>> The latest Featured Stock Update with an annotated graph appeared on 4/16/2013. Click here.
View all notes |
Alert me of new notes |
CANSLIM.net Company Profile |
SEC |
Zacks Reports |
StockTalk |
News |
Chart |
Request a new note
C
A N
S L
I M
|
EQM
-
NYSE
E Q T Midstream Partners
ENERGY - Oil and Gas Pipelines
|
$48.03
|
-0.03
-0.06% |
$48.63
|
64,864
81.69% of 50 DAV
50 DAV is 79,400
|
$49.10
-2.18%
|
4/25/2013
|
$40.16
|
PP = $40.84
|
|
MB = $42.88
|
Most Recent Note - 5/8/2013 5:25:55 PM
G - Hovering near its 52-week high with above average volume behind today's gain. Prior highs in the $40 area define initial support to watch above its 50 DMA line on pullbacks.
>>> The latest Featured Stock Update with an annotated graph appeared on 4/25/2013. Click here.
View all notes |
Alert me of new notes |
CANSLIM.net Company Profile |
SEC |
Zacks Reports |
StockTalk |
News |
Chart |
Request a new note
C
A N
S L
I M
|
Symbol/Exchange
Company Name
Industry Group |
PRICE |
CHANGE
(%Change) |
Day High |
Volume
(% DAV)
(% 50 day avg vol) |
52 Wk Hi
% From Hi |
Featured
Date |
Price
Featured |
Pivot Featured |
|
Max Buy |
FLT
-
NYSE
Fleetcor Technologies
DIVERSIFIED SERVICES - Business/Management Services
|
$82.35
|
+1.10
1.35% |
$82.47
|
732,581
83.25% of 50 DAV
50 DAV is 880,000
|
$85.56
-3.75%
|
3/21/2013
|
$71.14
|
PP = $73.00
|
|
MB = $76.65
|
Most Recent Note - 5/8/2013 5:23:16 PM
G - Posted a 5th consecutive gain with above average volume for a best ever close, getting more extended from any sound base pattern. Its 50 DMA line and recent low ($70.09) define near-term support where violations would raise more serious concerns and trigger worrisome technical sell signals. See the latest FSU analysis for more details and a new annotated graph.
>>> The latest Featured Stock Update with an annotated graph appeared on 5/8/2013. Click here.
View all notes |
Alert me of new notes |
CANSLIM.net Company Profile |
SEC |
Zacks Reports |
StockTalk |
News |
Chart |
Request a new note
C
A N
S L
I M
|
LNKD
-
NYSE
Linkedin Corp Class A
INTERNET - Internet Information Providers
|
$175.03
|
+1.25
0.72% |
$176.66
|
1,824,131
78.71% of 50 DAV
50 DAV is 2,317,600
|
$202.91
-13.74%
|
4/12/2013
|
$182.69
|
PP = $184.25
|
|
MB = $193.46
|
Most Recent Note - 5/10/2013 6:22:10 PM
G - Slumped below its 50 DMA line with a damaging loss today backed by above average volume triggering another technical sell signal. Gapped down on 5/03/13 undercutting prior highs in the $184 area with heavy volume behind a damaging loss. Reported earnings +200% on +72% sales revenues for the Mar '13 quarter.
>>> The latest Featured Stock Update with an annotated graph appeared on 4/29/2013. Click here.
View all notes |
Alert me of new notes |
CANSLIM.net Company Profile |
SEC |
Zacks Reports |
StockTalk |
News |
Chart |
Request a new note
C
A N
S L
I M
|
LOPE
-
NASDAQ
Grand Canyon Education
DIVERSIFIED SERVICES - Education and; Training Services
|
$29.57
|
-0.27
-0.90% |
$29.93
|
360,675
100.19% of 50 DAV
50 DAV is 360,000
|
$29.90
-1.10%
|
5/10/2013
|
$29.03
|
PP = $27.28
|
|
MB = $28.64
|
Most Recent Note - 5/10/2013 6:24:10 PM
Y - Finished strong after highlighted in yellow in the earlier mid-day report (read here) while consolidating following a considerable "breakaway gap" on 5/08/13. Its pivot point is based on its 2/20/13 high plus 10 cents. A breakaway gap is one noted exception where investors may chase a stock more than +5% above its pivot point. Reported earnings +34% on +21% sales revenues for the March '13 quarter, continuing its streak of strong earnings. Found support near its 50 DMA line and well above its 200 DMA line recently, proving resilient since dropped from the Featured Stocks list on 4/02/13. See the latest FSU analysis for more details and a new annotated graph.
>>> The latest Featured Stock Update with an annotated graph appeared on 5/10/2013. Click here.
View all notes |
Alert me of new notes |
CANSLIM.net Company Profile |
SEC |
Zacks Reports |
StockTalk |
News |
Chart |
Request a new note
C
A N
S L
I M
|
MRLN
-
NASDAQ
Marlin Business Services
DIVERSIFIED SERVICES - Rental and Leasing Services
|
$25.09
|
-0.53
-2.07% |
$25.95
|
20,082
79.38% of 50 DAV
50 DAV is 25,300
|
$25.97
-3.39%
|
3/15/2013
|
$22.29
|
PP = $23.18
|
|
MB = $24.34
|
Most Recent Note - 5/13/2013 6:03:51 PM
G - Pulled back again today on below average volume yet it remains above its "max buy" level. No resistance remains due to overhead supply. Prior highs in the $23 area define support to watch on pullbacks.
>>> The latest Featured Stock Update with an annotated graph appeared on 5/2/2013. Click here.
View all notes |
Alert me of new notes |
CANSLIM.net Company Profile |
SEC |
Zacks Reports |
StockTalk |
News |
Chart |
Request a new note
C
A N
S L
I M
|
N
-
NYSE
Netsuite Inc
DIVERSIFIED SERVICES - Business/Management Services
|
$92.11
|
+1.12
1.23% |
$92.93
|
328,576
89.70% of 50 DAV
50 DAV is 366,300
|
$91.14
1.06%
|
12/12/2012
|
$64.75
|
PP = $67.12
|
|
MB = $70.48
|
Most Recent Note - 5/10/2013 6:11:16 PM
G - Hit yet another new all-time high with today's gain backed by slightly above average volume. Recently reported earnings -33% on +32% sales revenues for the Mar '13 quarter, marking a 2nd consecutive quarterly comparison with earnings below the +25% minimum guideline (C criteria).
>>> The latest Featured Stock Update with an annotated graph appeared on 4/22/2013. Click here.
View all notes |
Alert me of new notes |
CANSLIM.net Company Profile |
SEC |
Zacks Reports |
StockTalk |
News |
Chart |
Request a new note
C
A N
S L
I M
|
Symbol/Exchange
Company Name
Industry Group |
PRICE |
CHANGE
(%Change) |
Day High |
Volume
(% DAV)
(% 50 day avg vol) |
52 Wk Hi
% From Hi |
Featured
Date |
Price
Featured |
Pivot Featured |
|
Max Buy |
NSM
-
NYSE
Nationstar Mtg Hldgs Inc
FINANCIAL SERVICES - Credit Services
|
$43.81
|
+0.07
0.16% |
$44.49
|
1,923,887
166.10% of 50 DAV
50 DAV is 1,158,300
|
$43.99
-0.41%
|
5/7/2013
|
$39.71
|
PP = $42.34
|
|
MB = $44.46
|
Most Recent Note - 5/13/2013 12:43:43 PM
Y - Hitting new 52-week and all-time highs with today's 6th consecutive volume-driven gain. Technically, the gain above its new pivot point on 5/09/13 triggered a technical buy signal. Highlighted in the 5/07/13 mid-day report with an annotated daily graph (read here) and covered in more detail in the latest FSU analysis with an annotated weekly graph.
>>> The latest Featured Stock Update with an annotated graph appeared on 5/7/2013. Click here.
View all notes |
Alert me of new notes |
CANSLIM.net Company Profile |
SEC |
Zacks Reports |
StockTalk |
News |
Chart |
Request a new note
C
A N
S L
I M
|
PRAA
-
NASDAQ
Portfolio Recovery Assoc
DIVERSIFIED SERVICES - Business/Management Services
|
$146.93
|
+0.01
0.01% |
$147.41
|
66,066
97.44% of 50 DAV
50 DAV is 67,800
|
$147.48
-0.37%
|
5/1/2013
|
$130.77
|
PP = $127.88
|
|
MB = $134.27
|
Most Recent Note - 5/10/2013 6:15:51 PM
G - Spiked further into new high territory with its 10th consecutive gain, getting very extended from any sound base. Prior highs near $127 define near-term support to watch on pullbacks. Reported earnings +54% on +21% sales revenues for the Mar '13 quarter.
>>> The latest Featured Stock Update with an annotated graph appeared on 5/1/2013. Click here.
View all notes |
Alert me of new notes |
CANSLIM.net Company Profile |
SEC |
Zacks Reports |
StockTalk |
News |
Chart |
Request a new note
C
A N
S L
I M
|
PRLB
-
NYSE
Proto Labs Inc
MANUFACTURING - Small Tools and Accessories
|
$56.92
|
-2.21
-3.74% |
$58.86
|
349,080
64.29% of 50 DAV
50 DAV is 543,000
|
$59.84
-4.88%
|
5/3/2013
|
$54.77
|
PP = $54.01
|
|
MB = $56.71
|
Most Recent Note - 5/13/2013 4:01:29 PM
G - Gapped down today, retreating from its 52-week high and pulling back near its "max buy" level with light volume behind its loss. Prior highs in the $54-55 area define initial support to watch above its 50 DMA line.
>>> The latest Featured Stock Update with an annotated graph appeared on 5/3/2013. Click here.
View all notes |
Alert me of new notes |
CANSLIM.net Company Profile |
SEC |
Zacks Reports |
StockTalk |
News |
Chart |
Request a new note
C
A N
S L
I M
|
RRTS
-
NYSE
Roadrunner Trans Systems
TRANSPORTATION - Air Delivery and Freight Service
|
$25.77
|
+0.09
0.35% |
$25.84
|
126,538
65.50% of 50 DAV
50 DAV is 193,200
|
$25.85
-0.31%
|
4/3/2013
|
$22.77
|
PP = $23.75
|
|
MB = $24.94
|
Most Recent Note - 5/13/2013 3:55:44 PM
G - Wedging higher with light volume, trading above its "max buy" level and poised for a best-ever close. Prior highs in the $23 area define initial support to watch above its 50 DMA line.
>>> The latest Featured Stock Update with an annotated graph appeared on 4/23/2013. Click here.
View all notes |
Alert me of new notes |
CANSLIM.net Company Profile |
SEC |
Zacks Reports |
StockTalk |
News |
Chart |
Request a new note
C
A N
S L
I M
|
VRX
-
NYSE
Valeant Pharmaceuticals
DRUGS - Drug Manufacturers - Other
|
$75.89
|
+2.37
3.22% |
$76.07
|
1,427,283
96.12% of 50 DAV
50 DAV is 1,484,900
|
$76.57
-0.89%
|
4/30/2013
|
$60.24
|
PP = $76.66
|
|
MB = $80.49
|
Most Recent Note - 5/13/2013 6:06:02 PM
Y- Finished 19 cents off its best-ever close with today's gain on average volume. The 50 DMA line and recent low ($69.87 on 4/04/13) define important support where subsequent violations may trigger technical sell signals. Prior reports cautioned - "Sub par earnings for the Mar '13 quarter below the +25% minimum guideline (C criteria) raised fundamental concerns."
>>> The latest Featured Stock Update with an annotated graph appeared on 4/30/2013. Click here.
View all notes |
Alert me of new notes |
CANSLIM.net Company Profile |
SEC |
Zacks Reports |
StockTalk |
News |
Chart |
Request a new note
C
A N
S L
I M
|
Symbol/Exchange
Company Name
Industry Group |
PRICE |
CHANGE
(%Change) |
Day High |
Volume
(% DAV)
(% 50 day avg vol) |
52 Wk Hi
% From Hi |
Featured
Date |
Price
Featured |
Pivot Featured |
|
Max Buy |
|
|
|
THESE ARE NOT BUY RECOMMENDATIONS!
Comments contained in the body of this report are technical
opinions only. The material herein has been obtained
from sources believed to be reliable and accurate, however,
its accuracy and completeness cannot be guaranteed.
This site is not an investment advisor, hence it does
not endorse or recommend any securities or other investments.
Any recommendation contained in this report may not
be suitable for all investors and it is not to be deemed
an offer or solicitation on our part with respect to
the purchase or sale of any securities. All trademarks,
service marks and trade names appearing in this report
are the property of their respective owners, and are
likewise used for identification purposes only.
This report is a service available
only to active Paid Premium Members.
You may opt-out of receiving report notifications
at any time. Questions or comments may be submitted
by writing to Premium Membership Services 665 S.E. 10 Street, Suite 201 Deerfield Beach, FL 33441-5634 or by calling 1-800-965-8307
or 954-785-1121.
|
|
|

