You are not logged in.
This means you
CAN ONLY VIEW reports that were published prior to Monday, April 14, 2025.
You
MUST UPGRADE YOUR MEMBERSHIP if you want to see any current reports.
AFTER MARKET UPDATE - FRIDAY, MAY 10TH, 2013
Previous After Market Report Next After Market Report >>>
|
|
|
|
DOW |
+35.87 |
15,118.49 |
+0.24% |
|
Volume |
630,480,970 |
-6% |
|
Volume |
1,645,529,770 |
-6% |
|
NASDAQ |
+27.41 |
3,436.58 |
+0.80% |
|
Advancers |
1,900 |
61% |
|
Advancers |
1,659 |
64% |
|
S&P 500 |
+7.03 |
1,633.70 |
+0.43% |
|
Decliners |
1,100 |
35% |
|
Decliners |
837 |
32% |
|
Russell 2000 |
+8.90 |
975.16 |
+0.92% |
|
52 Wk Highs |
317 |
|
|
52 Wk Highs |
196 |
|
|
S&P 600 |
+5.10 |
548.58 |
+0.94% |
|
52 Wk Lows |
15 |
|
|
52 Wk Lows |
23 |
|
|
 |
Major Averages Rose With Lighter Volume to New Record Highs
Kenneth J. Gruneisen - Passed the CAN SLIM® Master's Exam
The major averages were higher on the week as the Dow gained +1.0%, the S&P 500 added +1.2% and the Nasdaq Composite Index was up +1.7%. Behind Friday's small gains for the major indices the volume totals were reported lighter than the prior session totals on the Nasdaq exchange and on the NYSE. Breadth was positive as advancers led decliners by a 2-1 margin on the Nasdaq exchange and nearly 2-1 on the NYSE. There were 86 high-ranked companies from the CANSLIM.net Leaders List making new 52-week highs and appearing on the CANSLIM.net BreakOuts Page, up from the prior session total of 79 stocks. New 52-week highs totals outnumbered new 52-week lows on both the NYSE and the Nasdaq exchange. There were gains for 11 of the 15 high-ranked companies currently included on the Featured Stocks Page.
The major averages were little changed Friday as investors digested comments by Fed Chairman Ben Bernanke. In a speech at the Chicago Fed's conference Bernanke said the central bank continues to watch markets for signs of increased risk taking. Attention will now turn to the meeting of G-7 leaders in London as they discuss measures on improving global growth.
Consumer Discretionary was among the best performing sectors as shares of Priceline.com Inc (PCLN +3.78%) rose despite lowering its second-quarter outlook. The Gap Inc (GPS +5.62%) rallied after reporting a +7.0% increase in April same-store sales. Over in tech, Dell Inc (DELL +0.98%) rose on reports Carl Icahn and Southeastern Asset Management proposed an alternative bid to acquire the computer maker. Energy and materials were the worst performing sectors as a stronger dollar weighed on commodity prices and shares of Halliburton (HAL -0.39%) and Freeport McMoRan Copper & Gold Inc (FCX -0.21%) edged lower.
Treasuries were lower with the 10-year note falling 23/32 to yield 1.89%.
The market (M criteria) saw an expansion in leadership (stocks hitting new 52-week highs) that reassured investors a confirmed uptrend is at hand. Watch for new stocks featured in the CANSLIM.net Mid-Day BreakOuts Report. Action-worthy leaders are covered on an ongoing basis with the latest notes and additional resource links included on the Featured Stocks Page. Watch for an announcement via email concerning the next WEBCAST. The webcast will also be available via an updated link highlighted at the top of the Premium Member Homepage.
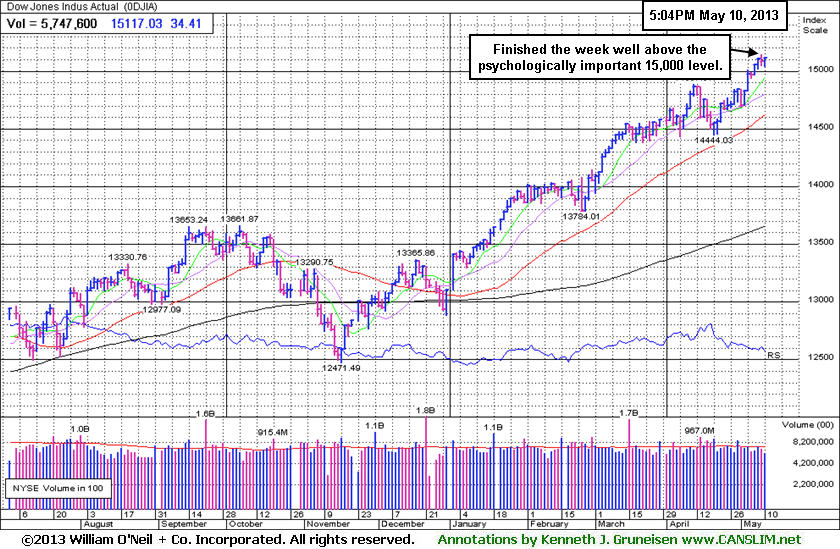
PICTURED: The Dow Jones Industrial Average is perched at its all-time high and finished the week above the psychologically important 15,000. Its 50-day moving average (DMA) line defines near-term support to watch on pullbacks. The indices' rally to new highs confirmed the market's uptrend which means odds are favorable for new buying efforts in stocks meeting all of the fact-based investment system's key criteria.
|
 Kenneth J. Gruneisen started out as a licensed stockbroker in August 1987, a couple of months prior to the historic stock market crash that took the Dow Jones Industrial Average down -22.6% in a single day. He has published daily fact-based fundamental and technical analysis on high-ranked stocks online for two decades. Through FACTBASEDINVESTING.COM, Kenneth provides educational articles, news, market commentary, and other information regarding proven investment systems that work in good times and bad.
Comments contained in the body of this report are technical opinions only and are not necessarily those of Gruneisen Growth Corp. The material herein has been obtained from sources believed to be reliable and accurate, however, its accuracy and completeness cannot be guaranteed. Our firm, employees, and customers may effect transactions, including transactions contrary to any recommendation herein, or have positions in the securities mentioned herein or options with respect thereto. Any recommendation contained in this report may not be suitable for all investors and it is not to be deemed an offer or solicitation on our part with respect to the purchase or sale of any securities. |
|
 |
Tech, Retail, Financial, and Healthcare Groups Rallied
Kenneth J. Gruneisen - Passed the CAN SLIM® Master's Exam
The Retail Index ($RLX +0.99%) posted a solid gain and financial shares were a positive influence on the major averages Friday as the Broker/Dealer Index ($XBD +1.66%) outpaced the Bank Index ($BKX +0.34%). The Biotechnology Index ($BTK +3.37%) led the tech sector higher while the Internet Index ($IIX +1.16%), Networking Index ($NWX +0.80%), and Semiconductor Index ($SOX +0.89%) ended unanimously higher. The Healthcare Index ($HMO +1.52%) also posted a solid gain into new high territory. Meanwhile, weakness in commodity-linked areas led the Gold & Silver Index ($XAU -0.28%), Integrated Oil Index ($XOI -0.51%), and Oil Services Index ($OSX -0.23%) each to finish the session lower.
Charts courtesy www.stockcharts.com
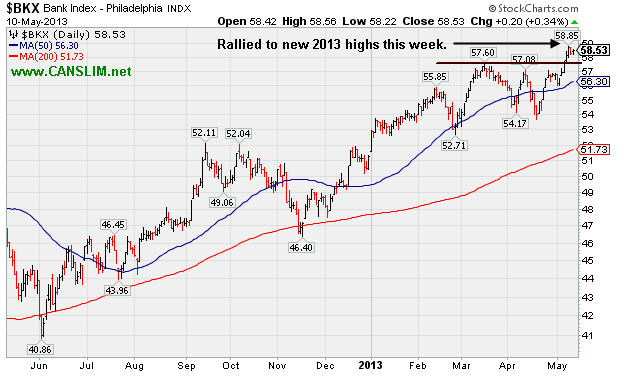
PICTURED: The Bank Index ($BKX +0.34%) rallied to new 2013 highs this week. This is encouraging news for the broader market outlook since financial stocks are a reliable "leading indicator".
| Oil Services |
$OSX |
259.69 |
-0.60 |
-0.23% |
+17.96% |
| Healthcare |
$HMO |
3,108.79 |
+46.46 |
+1.52% |
+23.65% |
| Integrated Oil |
$XOI |
1,378.84 |
-7.12 |
-0.51% |
+11.03% |
| Semiconductor |
$SOX |
465.94 |
+4.09 |
+0.89% |
+21.32% |
| Networking |
$NWX |
234.69 |
+1.87 |
+0.80% |
+3.59% |
| Internet |
$IIX |
377.35 |
+4.31 |
+1.16% |
+15.40% |
| Broker/Dealer |
$XBD |
119.68 |
+1.96 |
+1.66% |
+26.87% |
| Retail |
$RLX |
777.75 |
+7.60 |
+0.99% |
+19.09% |
| Gold & Silver |
$XAU |
108.52 |
-0.31 |
-0.28% |
-34.47% |
| Bank |
$BKX |
58.53 |
+0.20 |
+0.34% |
+14.14% |
| Biotech |
$BTK |
1,998.19 |
+65.10 |
+3.37% |
+29.16% |
|
|
|
 |
Breakaway Gap to All-Time Highs
Kenneth J. Gruneisen - Passed the CAN SLIM® Master's Exam
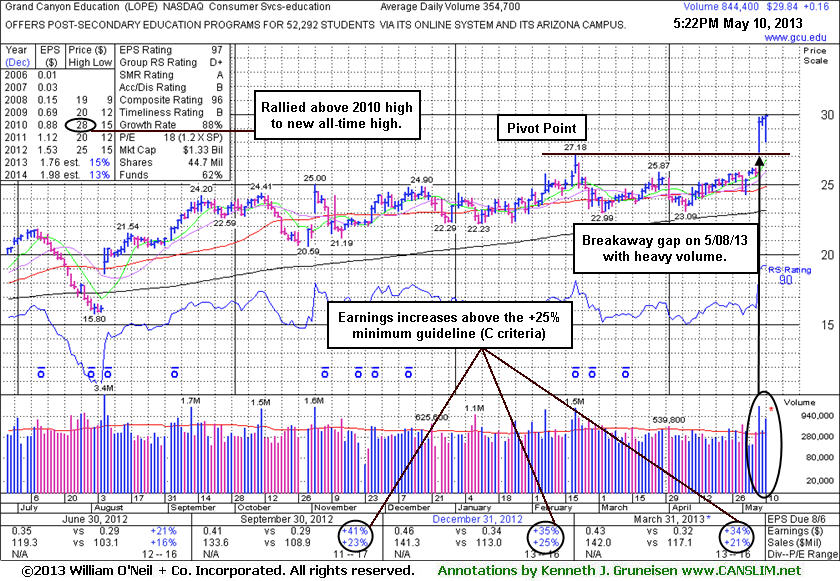
Grand Canyon Education (LOPE -$0.02 or -0.08% to $24.13) was highlighted in yellow in the earlier mid-day report (read here) while consolidating following its considerable "breakaway gap" on 5/08/13. Its pivot point is based on its 2/20/13 high plus 10 cents. A breakaway gap is one noted exception where investors may chase a stock more than +5% above its prior high or pivot point. However, buying further above prior highs increases the chances that a normal pullback may prompt disciplined investors to limit losses and sell if the stock falls more than -7% from their purchase price. The stock spiked into new 52-week high territory with volume-driven gains, and it also rallied into new all-time high territory above its April 2010 high (N criteria), showing bullish technical action which may mark the beginning of a meaningful and sustained advance in price.
The number of top-rated funds owning its shares rose from 200 in Mar '12 to 290 in Mar '13, a reassuring trend concerning the I criteria. Its current Up/Down Volume Ratio of 1.6 is an unbiased indication that its shares have been under accumulation over the past 50 days. It most recently reported earnings +34% on +21% sales revenues for the Mar '13 quarter, and earnings increases were above the +25% minimum earnings guideline (C criteria) the past 3 quarterly comparisons. It found support near its 50-day moving average (DMA) line and well above its 200 DMA line recently, proving resilient after dropped from the Featured Stocks list on 4/02/13. It was last shown in this FSU section on 3/13/13 with an annotated graph under the headline, "Weakening Relative Strength After Negating Breakout". Since then its Relative Strength Rating (90) has improved above the 80+ minimum guideline for buy candidates under the fact-based investment system. The Commercial Services - Schools group now has a D+ Rating, however leadership (L criteria) from at least one other company in the group is an encouraging sign.
|
|
|
Color Codes Explained :
Y - Better candidates highlighted by our
staff of experts.
G - Previously featured
in past reports as yellow but may no longer be buyable under the
guidelines.
***Last / Change / Volume data in this table is the closing quote data***
Symbol/Exchange
Company Name
Industry Group |
PRICE |
CHANGE
(%Change) |
Day High |
Volume
(% DAV)
(% 50 day avg vol) |
52 Wk Hi
% From Hi |
Featured
Date |
Price
Featured |
Pivot Featured |
|
Max Buy |
AL
-
NYSE
Air Lease Corp Cl A
DIVERSIFIED SERVICES - Rental and Leasing Services
|
$30.00
|
-0.58
-1.90% |
$30.19
|
1,364,835
296.19% of 50 DAV
50 DAV is 460,800
|
$31.00
-3.23%
|
5/9/2013
|
$30.95
|
PP = $29.38
|
|
MB = $30.85
|
 Most Recent Note - 5/10/2013 11:57:04 AM
Y - Reported earnings +38% on +45% sales revenues for the Mar '13 quarter. The results missed estimates and it gapped down today. Previously cautioned - "Volume and volatility often increase near earnings news" - as highlighted in yellow in the mid-day report (read here) with a pivot point cited based on its 4/09/13 high while rallying from a "double bottom" base to a new 52-week high. See the latest FSU analysis for more details and an annotated daily graph.
>>> The latest Featured Stock Update with an annotated graph appeared on 5/9/2013. Click here.
View all notes |
Alert me of new notes |
CANSLIM.net Company Profile |
SEC |
Zacks Reports |
StockTalk |
News |
Chart |
Request a new note
C
A N
S L
I M


|
AMBA
-
NASDAQ
Ambarella Inc
ELECTRONICS - Semiconductor - Specialized
|
$14.33
|
+0.52
3.77% |
$14.47
|
475,827
93.67% of 50 DAV
50 DAV is 508,000
|
$16.00
-10.44%
|
5/6/2013
|
$15.31
|
PP = $16.10
|
|
MB = $16.91
|
Most Recent Note - 5/10/2013 6:17:59 PM
Y - Volume-driven gains above the new pivot point are needed to trigger a new technical buy signal. Still basing, with near-term resistance due to overhead supply up through the $16 level. Found encouraging support at its 50 DMA line and flashed above average volume behind recent gains while building on a new base.
>>> The latest Featured Stock Update with an annotated graph appeared on 5/6/2013. Click here.
View all notes |
Alert me of new notes |
CANSLIM.net Company Profile |
SEC |
Zacks Reports |
StockTalk |
News |
Chart |
Request a new note
C
A N
S L
I M
|
CELG
-
NASDAQ
Celgene Corp
DRUGS - Drug Manufacturers - Major
|
$127.46
|
+4.75
3.87% |
$127.47
|
3,356,386
104.19% of 50 DAV
50 DAV is 3,221,500
|
$128.52
-0.82%
|
3/27/2013
|
$113.24
|
PP = $115.54
|
|
MB = $121.32
|
Most Recent Note - 5/10/2013 6:03:04 PM
G - Rallied to a new high close with today's considerable volume-driven gain. Found support at its 50 DMA line during its recent consolidation. It is extended from any sound base pattern.
>>> The latest Featured Stock Update with an annotated graph appeared on 4/19/2013. Click here.
View all notes |
Alert me of new notes |
CANSLIM.net Company Profile |
SEC |
Zacks Reports |
StockTalk |
News |
Chart |
Request a new note
C
A N
S L
I M
|
CMCSA
-
NASDAQ
Comcast Corp Cl A
MEDIA - CATV Systems
|
$43.08
|
+0.12
0.28% |
$43.36
|
6,383,722
53.01% of 50 DAV
50 DAV is 12,043,600
|
$43.36
-0.65%
|
12/3/2012
|
$37.08
|
PP = $38.06
|
|
MB = $39.96
|
Most Recent Note - 5/6/2013 11:41:09 AM
G - Reported earnings +13% on +3% sales revenues for the Mar '13 quarter, the 2nd consecutive quarterly comparison with earnings well below the +25% minimum guideline (C criteria). Despite fundamental concerns repeatedly noted it has found recent support near its 50 DMA line and is perched at its 52-week high.
>>> The latest Featured Stock Update with an annotated graph appeared on 4/16/2013. Click here.
View all notes |
Alert me of new notes |
CANSLIM.net Company Profile |
SEC |
Zacks Reports |
StockTalk |
News |
Chart |
Request a new note
C
A N
S L
I M
|
EQM
-
NYSE
E Q T Midstream Partners
ENERGY - Oil and Gas Pipelines
|
$48.06
|
+0.55
1.16% |
$49.10
|
89,368
109.52% of 50 DAV
50 DAV is 81,600
|
$48.50
-0.91%
|
4/25/2013
|
$40.16
|
PP = $40.84
|
|
MB = $42.88
|
Most Recent Note - 5/8/2013 5:25:55 PM
G - Hovering near its 52-week high with above average volume behind today's gain. Prior highs in the $40 area define initial support to watch above its 50 DMA line on pullbacks.
>>> The latest Featured Stock Update with an annotated graph appeared on 4/25/2013. Click here.
View all notes |
Alert me of new notes |
CANSLIM.net Company Profile |
SEC |
Zacks Reports |
StockTalk |
News |
Chart |
Request a new note
C
A N
S L
I M
|
Symbol/Exchange
Company Name
Industry Group |
PRICE |
CHANGE
(%Change) |
Day High |
Volume
(% DAV)
(% 50 day avg vol) |
52 Wk Hi
% From Hi |
Featured
Date |
Price
Featured |
Pivot Featured |
|
Max Buy |
FLT
-
NYSE
Fleetcor Technologies
DIVERSIFIED SERVICES - Business/Management Services
|
$81.25
|
-0.33
-0.40% |
$81.90
|
744,561
84.37% of 50 DAV
50 DAV is 882,500
|
$85.56
-5.04%
|
3/21/2013
|
$71.14
|
PP = $73.00
|
|
MB = $76.65
|
Most Recent Note - 5/8/2013 5:23:16 PM
G - Posted a 5th consecutive gain with above average volume for a best ever close, getting more extended from any sound base pattern. Its 50 DMA line and recent low ($70.09) define near-term support where violations would raise more serious concerns and trigger worrisome technical sell signals. See the latest FSU analysis for more details and a new annotated graph.
>>> The latest Featured Stock Update with an annotated graph appeared on 5/8/2013. Click here.
View all notes |
Alert me of new notes |
CANSLIM.net Company Profile |
SEC |
Zacks Reports |
StockTalk |
News |
Chart |
Request a new note
C
A N
S L
I M
|
LNKD
-
NYSE
Linkedin Corp Class A
INTERNET - Internet Information Providers
|
$173.78
|
-3.61
-2.04% |
$179.25
|
2,954,588
127.62% of 50 DAV
50 DAV is 2,315,100
|
$202.91
-14.36%
|
4/12/2013
|
$182.69
|
PP = $184.25
|
|
MB = $193.46
|
Most Recent Note - 5/10/2013 6:22:10 PM
G - Slumped below its 50 DMA line with a damaging loss today backed by above average volume triggering another technical sell signal. Gapped down on 5/03/13 undercutting prior highs in the $184 area with heavy volume behind a damaging loss. Reported earnings +200% on +72% sales revenues for the Mar '13 quarter.
>>> The latest Featured Stock Update with an annotated graph appeared on 4/29/2013. Click here.
View all notes |
Alert me of new notes |
CANSLIM.net Company Profile |
SEC |
Zacks Reports |
StockTalk |
News |
Chart |
Request a new note
C
A N
S L
I M
|
LOPE
-
NASDAQ
Grand Canyon Education
DIVERSIFIED SERVICES - Education and; Training Services
|
$29.84
|
+0.16
0.54% |
$29.90
|
844,638
238.13% of 50 DAV
50 DAV is 354,700
|
$29.89
-0.17%
|
5/10/2013
|
$29.03
|
PP = $27.28
|
|
MB = $28.64
|
Most Recent Note - 5/10/2013 6:24:10 PM
Y - Finished strong after highlighted in yellow in the earlier mid-day report (read here) while consolidating following a considerable "breakaway gap" on 5/08/13. Its pivot point is based on its 2/20/13 high plus 10 cents. A breakaway gap is one noted exception where investors may chase a stock more than +5% above its pivot point. Reported earnings +34% on +21% sales revenues for the March '13 quarter, continuing its streak of strong earnings. Found support near its 50 DMA line and well above its 200 DMA line recently, proving resilient since dropped from the Featured Stocks list on 4/02/13. See the latest FSU analysis for more details and a new annotated graph.
>>> The latest Featured Stock Update with an annotated graph appeared on 5/10/2013. Click here.
View all notes |
Alert me of new notes |
CANSLIM.net Company Profile |
SEC |
Zacks Reports |
StockTalk |
News |
Chart |
Request a new note
C
A N
S L
I M
|
MRLN
-
NASDAQ
Marlin Business Services
DIVERSIFIED SERVICES - Rental and Leasing Services
|
$25.62
|
+0.66
2.64% |
$25.83
|
24,387
95.26% of 50 DAV
50 DAV is 25,600
|
$25.97
-1.35%
|
3/15/2013
|
$22.29
|
PP = $23.18
|
|
MB = $24.34
|
Most Recent Note - 5/8/2013 5:24:24 PM
G - Pulled back on below average volume yet it remains above its "max buy" level. No resistance remains due to overhead supply. Prior highs in the $23 area define support to watch on pullbacks.
>>> The latest Featured Stock Update with an annotated graph appeared on 5/2/2013. Click here.
View all notes |
Alert me of new notes |
CANSLIM.net Company Profile |
SEC |
Zacks Reports |
StockTalk |
News |
Chart |
Request a new note
C
A N
S L
I M
|
N
-
NYSE
Netsuite Inc
DIVERSIFIED SERVICES - Business/Management Services
|
$90.99
|
+1.22
1.36% |
$91.14
|
434,396
118.98% of 50 DAV
50 DAV is 365,100
|
$91.02
-0.03%
|
12/12/2012
|
$64.75
|
PP = $67.12
|
|
MB = $70.48
|
Most Recent Note - 5/10/2013 6:11:16 PM
G - Hit yet another new all-time high with today's gain backed by slightly above average volume. Recently reported earnings -33% on +32% sales revenues for the Mar '13 quarter, marking a 2nd consecutive quarterly comparison with earnings below the +25% minimum guideline (C criteria).
>>> The latest Featured Stock Update with an annotated graph appeared on 4/22/2013. Click here.
View all notes |
Alert me of new notes |
CANSLIM.net Company Profile |
SEC |
Zacks Reports |
StockTalk |
News |
Chart |
Request a new note
C
A N
S L
I M
|
Symbol/Exchange
Company Name
Industry Group |
PRICE |
CHANGE
(%Change) |
Day High |
Volume
(% DAV)
(% 50 day avg vol) |
52 Wk Hi
% From Hi |
Featured
Date |
Price
Featured |
Pivot Featured |
|
Max Buy |
NSM
-
NYSE
Nationstar Mtg Hldgs Inc
FINANCIAL SERVICES - Credit Services
|
$43.74
|
+1.39
3.28% |
$43.99
|
2,160,916
191.71% of 50 DAV
50 DAV is 1,127,200
|
$42.61
2.65%
|
5/7/2013
|
$39.71
|
PP = $42.34
|
|
MB = $44.46
|
Most Recent Note - 5/10/2013 6:12:56 PM
Y - Finished strong today with its 5th consecutive volume-driven gain. Technically, the gain above its new pivot point on the prior session triggered a technical buy signal. NSM was highlighted in yellow in the 5/07/13 mid-day report with an annotated daily graph (read here) and covered in more detail in the latest FSU analysis with an annotated weekly graph.
>>> The latest Featured Stock Update with an annotated graph appeared on 5/7/2013. Click here.
View all notes |
Alert me of new notes |
CANSLIM.net Company Profile |
SEC |
Zacks Reports |
StockTalk |
News |
Chart |
Request a new note
C
A N
S L
I M
|
PRAA
-
NASDAQ
Portfolio Recovery Assoc
DIVERSIFIED SERVICES - Business/Management Services
|
$146.92
|
+0.59
0.40% |
$147.48
|
51,999
76.58% of 50 DAV
50 DAV is 67,900
|
$147.00
-0.05%
|
5/1/2013
|
$130.77
|
PP = $127.88
|
|
MB = $134.27
|
Most Recent Note - 5/10/2013 6:15:51 PM
G - Spiked further into new high territory with its 10th consecutive gain, getting very extended from any sound base. Prior highs near $127 define near-term support to watch on pullbacks. Reported earnings +54% on +21% sales revenues for the Mar '13 quarter.
>>> The latest Featured Stock Update with an annotated graph appeared on 5/1/2013. Click here.
View all notes |
Alert me of new notes |
CANSLIM.net Company Profile |
SEC |
Zacks Reports |
StockTalk |
News |
Chart |
Request a new note
C
A N
S L
I M
|
PRLB
-
NYSE
Proto Labs Inc
MANUFACTURING - Small Tools and Accessories
|
$59.13
|
+4.18
7.61% |
$59.84
|
650,339
120.77% of 50 DAV
50 DAV is 538,500
|
$56.59
4.49%
|
5/3/2013
|
$54.77
|
PP = $54.01
|
|
MB = $56.71
|
Most Recent Note - 5/10/2013 10:13:33 AM
G - Gapped up today hitting a new 52-week high and rallying beyond its "max buy" level and its color code is changed to green. Prior highs in the $54-55 area define initial support above its 50 DMA line.
>>> The latest Featured Stock Update with an annotated graph appeared on 5/3/2013. Click here.
View all notes |
Alert me of new notes |
CANSLIM.net Company Profile |
SEC |
Zacks Reports |
StockTalk |
News |
Chart |
Request a new note
C
A N
S L
I M
|
RRTS
-
NYSE
Roadrunner Trans Systems
TRANSPORTATION - Air Delivery and Freight Service
|
$25.68
|
+0.34
1.34% |
$25.74
|
179,713
92.54% of 50 DAV
50 DAV is 194,200
|
$25.85
-0.66%
|
4/3/2013
|
$22.77
|
PP = $23.75
|
|
MB = $24.94
|
Most Recent Note - 5/9/2013 1:25:24 PM
G - Pulling back today on higher volume, trading near its "max buy" level. Prior highs in the $23 area define initial support to watch above its 50 DMA line.
>>> The latest Featured Stock Update with an annotated graph appeared on 4/23/2013. Click here.
View all notes |
Alert me of new notes |
CANSLIM.net Company Profile |
SEC |
Zacks Reports |
StockTalk |
News |
Chart |
Request a new note
C
A N
S L
I M
|
VRX
-
NYSE
Valeant Pharmaceuticals
DRUGS - Drug Manufacturers - Other
|
$73.52
|
+0.78
1.07% |
$74.01
|
2,888,469
199.11% of 50 DAV
50 DAV is 1,450,700
|
$76.57
-3.98%
|
4/30/2013
|
$60.24
|
PP = $76.66
|
|
MB = $80.49
|
Most Recent Note - 5/10/2013 6:20:31 PM
Y- Found support at its 50 DMA line with a gain backed by above average volume. The 50 DMA line and recent low ($69.87 on 4/04/13) define important support where subsequent violations may trigger technical sell signals. Sub par earnings for the Mar '13 quarter below the +25% minimum guideline (C criteria) raised fundamental concerns.
>>> The latest Featured Stock Update with an annotated graph appeared on 4/30/2013. Click here.
View all notes |
Alert me of new notes |
CANSLIM.net Company Profile |
SEC |
Zacks Reports |
StockTalk |
News |
Chart |
Request a new note
C
A N
S L
I M
|
Symbol/Exchange
Company Name
Industry Group |
PRICE |
CHANGE
(%Change) |
Day High |
Volume
(% DAV)
(% 50 day avg vol) |
52 Wk Hi
% From Hi |
Featured
Date |
Price
Featured |
Pivot Featured |
|
Max Buy |
|
|
|
THESE ARE NOT BUY RECOMMENDATIONS!
Comments contained in the body of this report are technical
opinions only. The material herein has been obtained
from sources believed to be reliable and accurate, however,
its accuracy and completeness cannot be guaranteed.
This site is not an investment advisor, hence it does
not endorse or recommend any securities or other investments.
Any recommendation contained in this report may not
be suitable for all investors and it is not to be deemed
an offer or solicitation on our part with respect to
the purchase or sale of any securities. All trademarks,
service marks and trade names appearing in this report
are the property of their respective owners, and are
likewise used for identification purposes only.
This report is a service available
only to active Paid Premium Members.
You may opt-out of receiving report notifications
at any time. Questions or comments may be submitted
by writing to Premium Membership Services 665 S.E. 10 Street, Suite 201 Deerfield Beach, FL 33441-5634 or by calling 1-800-965-8307
or 954-785-1121.
|
|
|

