You are not logged in.
This means you
CAN ONLY VIEW reports that were published prior to Wednesday, April 9, 2025.
You
MUST UPGRADE YOUR MEMBERSHIP if you want to see any current reports.
AFTER MARKET UPDATE - THURSDAY, MAY 9TH, 2013
Previous After Market Report Next After Market Report >>>
|
|
|
|
DOW |
-22.50 |
15,082.62 |
-0.15% |
|
Volume |
670,016,200 |
-8% |
|
Volume |
1,755,660,810 |
+5% |
|
NASDAQ |
-4.10 |
3,409.17 |
-0.12% |
|
Advancers |
1,071 |
34% |
|
Advancers |
966 |
38% |
|
S&P 500 |
-6.02 |
1,626.67 |
-0.37% |
|
Decliners |
1,932 |
62% |
|
Decliners |
1,484 |
58% |
|
Russell 2000 |
-4.15 |
966.26 |
-0.43% |
|
52 Wk Highs |
410 |
|
|
52 Wk Highs |
178 |
|
|
S&P 600 |
-1.85 |
543.48 |
-0.34% |
|
52 Wk Lows |
11 |
|
|
52 Wk Lows |
23 |
|
|
 |
Major Averages Pause at Record Highs
Kenneth J. Gruneisen - Passed the CAN SLIM® Master's Exam
Stocks finished slightly lower as the market took a breather from its recent rally. The volume totals were reported mixed, higher than the prior session total on the Nasdaq exchange and lower on the NYSE. Breadth was negative as decliners led advancers by a 9-5 margin on the NYSE and 8-5 on the Nasdaq exchange. There were 79 high-ranked companies from the CANSLIM.net Leaders List making new 52-week highs and appearing on the CANSLIM.net BreakOuts Page, down from the prior session total of 99 stocks. New 52-week highs totals outnumbered new 52-week lows on both the NYSE and the Nasdaq exchange. There were gains for 7 of the 14 high-ranked companies currently included on the Featured Stocks Page.
The major averages ended the session in negative territory despite receiving an encouraging update on the labor market. Before the open, weekly initial jobless claims unexpectedly declined to a five year low of 323,000. Additional data showed wholesale inventories rose +0.4% in March, slightly higher than the consensus estimate for a +0.3% increase. Attention was also on the currency market as the dollar rallied above 100 yen for the first time since April 2009.
On the earnings front, Green Mountain Coffee Roasters Inc (GMCR +27.84%) gapped and Tesla Motors (TSLA +24.40%) were standout gainers as both stocks gapped up after posting better-than-expected quarterly results. Shares of Rackspace Hosting Inc (RAX -24.66%) and Monster Beverage Corp (MNST -5.2%) retreated after reporting profits below analyst projections.
All 10 sectors in the S&P 500 finished in negative territory. Utilities and telecom were the worst performing groups on the session. Edison International (EIX -2.66%) and AT&T Inc (T -1.32%) both ended lower.
Treasuries erased earlier gains with the 10-year note finishing down 1/32 to yield 1.81%.
The market (M criteria) saw an expansion in leadership (stocks hitting new 52-week highs) that reassured investors a confirmed uptrend is at hand. Watch for new stocks featured in the CANSLIM.net Mid-Day BreakOuts Report. Action-worthy leaders are covered on an ongoing basis with the latest notes and additional resource links included on the Featured Stocks Page. Watch for an announcement via email concerning the next WEBCAST. The webcast will also be available via an updated link highlighted at the top of the Premium Member Homepage.
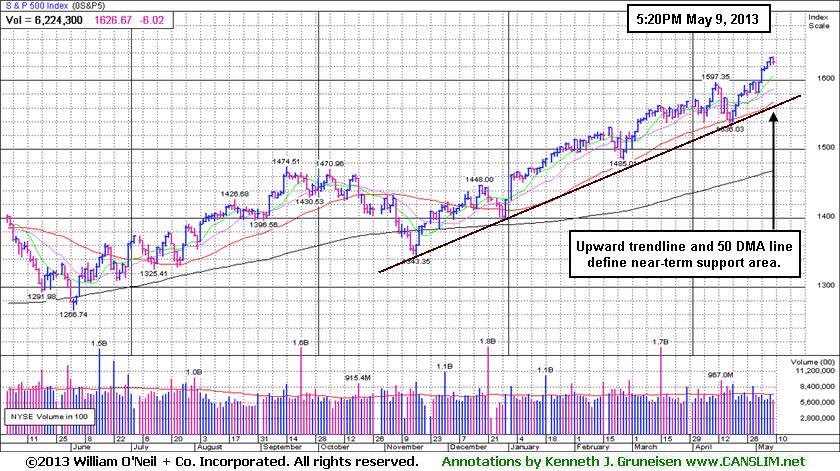
PICTURED: The S&P 500 Index is perched at its all-time high. A multi-month upward trendline and its 50-day moving average (DMA) line define a near-term support area to watch on pullbacks. The indices' rally to new highs confirmed the market's uptrend which means odds are favorable for new buying efforts in stocks meeting all of the fact-based investment system's key criteria.
|
 Kenneth J. Gruneisen started out as a licensed stockbroker in August 1987, a couple of months prior to the historic stock market crash that took the Dow Jones Industrial Average down -22.6% in a single day. He has published daily fact-based fundamental and technical analysis on high-ranked stocks online for two decades. Through FACTBASEDINVESTING.COM, Kenneth provides educational articles, news, market commentary, and other information regarding proven investment systems that work in good times and bad.
Comments contained in the body of this report are technical opinions only and are not necessarily those of Gruneisen Growth Corp. The material herein has been obtained from sources believed to be reliable and accurate, however, its accuracy and completeness cannot be guaranteed. Our firm, employees, and customers may effect transactions, including transactions contrary to any recommendation herein, or have positions in the securities mentioned herein or options with respect thereto. Any recommendation contained in this report may not be suitable for all investors and it is not to be deemed an offer or solicitation on our part with respect to the purchase or sale of any securities. |
|
 |
Healthcare Index Perched at 2013 High
Kenneth J. Gruneisen - Passed the CAN SLIM® Master's Exam
A loss from the Bank Index ($BKX -0.71%) was a negative influence on the major averages while the Broker/Dealer Index ($XBD +0.13%) and Retail Index ($RLX +0.05%) eked out minor gains on Thursday's session. The Networking Index ($NWX +0.11%) and the Healthcare Index ($HMO +0.12%) also inched higher. The tech sector was mixed, with the Semiconductor Index ($SOX +0.52%) posting the best gain, the Biotechnology Index ($BTK -0.64%) slumping and the Internet Index ($IIX +0.01%) fininshing flat. Weakness in energy-related shares led the Integrated Oil Index ($XOI -0.64%) and the Oil Services Index ($OSX -0.23%) lower. The Gold & Silver Index ($XAU -1.48%) was a laggard as it suffered an even larger loss than other groups.
Charts courtesy www.stockcharts.com
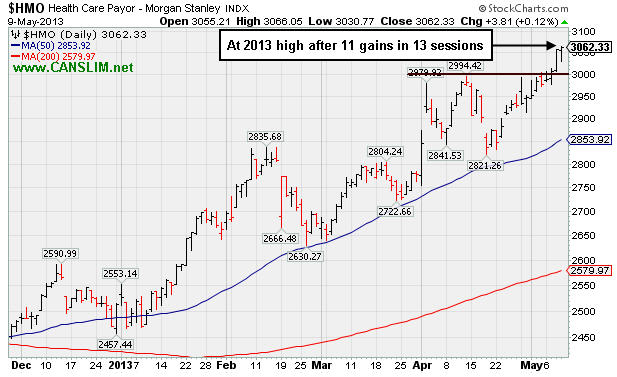
PICTURED: The Healthcare Index ($HMO +0.12%) is perched at its 2013 high after a spurt of 11 gains in 13 sessions.
| Oil Services |
$OSX |
260.29 |
-0.60 |
-0.23% |
+18.23% |
| Healthcare |
$HMO |
3,062.33 |
+3.81 |
+0.12% |
+21.80% |
| Integrated Oil |
$XOI |
1,385.96 |
-8.98 |
-0.64% |
+11.61% |
| Semiconductor |
$SOX |
461.85 |
+2.38 |
+0.52% |
+20.25% |
| Networking |
$NWX |
232.83 |
+0.25 |
+0.11% |
+2.77% |
| Internet |
$IIX |
373.04 |
+0.04 |
+0.01% |
+14.08% |
| Broker/Dealer |
$XBD |
117.72 |
+0.15 |
+0.13% |
+24.80% |
| Retail |
$RLX |
770.15 |
+0.40 |
+0.05% |
+17.93% |
| Gold & Silver |
$XAU |
108.83 |
-1.63 |
-1.48% |
-34.28% |
| Bank |
$BKX |
58.33 |
-0.42 |
-0.71% |
+13.75% |
| Biotech |
$BTK |
1,933.09 |
-12.41 |
-0.64% |
+24.96% |
|
|
|
 |
Trading Lower After Hours Following Earnings Announcement
Kenneth J. Gruneisen - Passed the CAN SLIM® Master's Exam
Often, when a leading stock is setting up to breakout of a solid base it is highlighted in CANSLIM.net's Mid-Day Breakouts Report. The most relevant factors are noted in the report which alerts prudent CANSLIM oriented investors to place the issue in their watch list. After doing any necessary backup research, the investor is prepared to act after the stock triggers a technical buy signal (breaks above its pivot point on more than +50% average turnover) but before it gets too extended from a sound base. In the event the stock fails to trigger a technical buy signal and its price declines then it will simply be removed from the watch list. Disciplined investors know to buy as near as possible to the pivot point and avoid chasing stocks after they have rallied more than +5% above their pivot point. It is crucial to always limit losses whenever any stock heads the wrong direction, and disciplined investors sell if a struggling stock ever falls more than -7% from their purchase price.
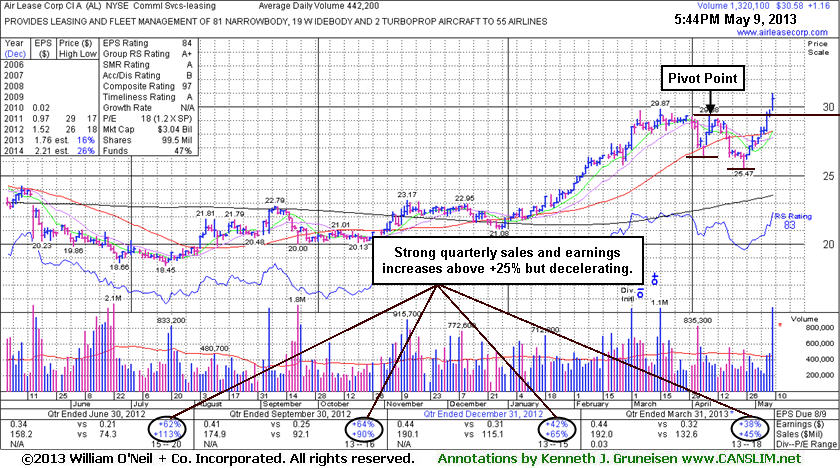
Air Lease Corp (AL +$1.16 or +3.94% to $30.58) was highlighted in yellow with a pivot point based on its 4/09/13 high while rallying from a "double bottom" base to a new 52-week high with above average volume in the earlier mid-day report (read here). Its strong finish for a 6th consecutive gain clinched a technical buy signal, however, members were cautioned - "Volume and volatility often increase near earnings news." After the close it reported earnings +38% on +45% sales revenues for the quarter ended March 31, 2013 versus the year ago period. The result was well above the +25% minimum earnings guideline (C criteria), however it missed analysts' consensus estimates, and the shares traded much lower in the after-hours.
AL undercut the 50-day moving average (DMA) line during its consolidation since noted with caution in the 4/04/13 mid-day report following a volume-driven loss. It found support near prior highs in the $26 area. Recently it had tallied 11 consecutive weekly gains. Decelerating sales revenues and earnings increases in sequential quarterly comparisons through Dec '12 were noted as cause for some concern.
Fundamentals are still strong enough that its earnings history is a good match with the fact-based investment system's fundamental guidelines (C and A criteria). The number of top-rated funds owning its shares rose from 177 in Sep '12 to 192 in Mar '13 which is reassuring concerning the I criteria. Its Up/Down Volume Ratio of 1.4 is also an unbiased indication that its shares have been under accumulation over the past 50 days.
|
|
|
Color Codes Explained :
Y - Better candidates highlighted by our
staff of experts.
G - Previously featured
in past reports as yellow but may no longer be buyable under the
guidelines.
***Last / Change / Volume data in this table is the closing quote data***
Symbol/Exchange
Company Name
Industry Group |
PRICE |
CHANGE
(%Change) |
Day High |
Volume
(% DAV)
(% 50 day avg vol) |
52 Wk Hi
% From Hi |
Featured
Date |
Price
Featured |
Pivot Featured |
|
Max Buy |
AL
-
NYSE
Air Lease Corp Cl A
DIVERSIFIED SERVICES - Rental and Leasing Services
|
$30.58
|
+1.16
3.94% |
$31.00
|
1,329,450
300.64% of 50 DAV
50 DAV is 442,200
|
$29.87
2.38%
|
5/9/2013
|
$30.95
|
PP = $29.38
|
|
MB = $30.85
|
 Most Recent Note - 5/9/2013 6:06:07 PM
Y - Reported earnings +38% on +45% sales revenues for the Mar '13 quarter, however the results missed estimates and it traded lower after hours. Previously cautioned - "Volume and volatility often increase near earnings news" - as highlighted in yellow in the mid-day report (read here)with a pivot point cited based on its 4/09/13 high while rallying from a "double bottom" base to a new 52-week high. See the latest FSU analysis for more details and an annotated daily graph.
>>> The latest Featured Stock Update with an annotated graph appeared on 5/9/2013. Click here.
View all notes |
Alert me of new notes |
CANSLIM.net Company Profile |
SEC |
Zacks Reports |
StockTalk |
News |
Chart |
Request a new note
C
A N
S L
I M


|
AMBA
-
NASDAQ
Ambarella Inc
ELECTRONICS - Semiconductor - Specialized
|
$13.81
|
+0.02
0.15% |
$14.05
|
252,216
50.01% of 50 DAV
50 DAV is 504,300
|
$16.00
-13.69%
|
5/6/2013
|
$15.31
|
PP = $16.10
|
|
MB = $16.91
|
Most Recent Note - 5/7/2013 10:11:09 AM
Y - Pulling back today with volume running at an above average pace. May spend more time basing as it was noted that it faces resistance due to overhead supply up through the $16 level. Found encouraging support at its 50 DMA line and flashed above average volume behind recent gains while building on a new base. Volume-driven gains above the new pivot point are needed to trigger a new technical buy signal. See the latest FSU analysis for more details and a new annotated graph.
>>> The latest Featured Stock Update with an annotated graph appeared on 5/6/2013. Click here.
View all notes |
Alert me of new notes |
CANSLIM.net Company Profile |
SEC |
Zacks Reports |
StockTalk |
News |
Chart |
Request a new note
C
A N
S L
I M
|
CELG
-
NASDAQ
Celgene Corp
DRUGS - Drug Manufacturers - Major
|
$122.71
|
-0.03
-0.02% |
$123.81
|
2,406,389
74.67% of 50 DAV
50 DAV is 3,222,700
|
$128.52
-4.52%
|
3/27/2013
|
$113.24
|
PP = $115.54
|
|
MB = $121.32
|
Most Recent Note - 5/6/2013 6:33:38 PM
G - Found support at its 50 DMA line as it managed a positive reversal on 5/02/13. That session's low ($114.05) defines important near-term support below its short-term average. It is extended from any sound base pattern.
>>> The latest Featured Stock Update with an annotated graph appeared on 4/19/2013. Click here.
View all notes |
Alert me of new notes |
CANSLIM.net Company Profile |
SEC |
Zacks Reports |
StockTalk |
News |
Chart |
Request a new note
C
A N
S L
I M
|
CMCSA
-
NASDAQ
Comcast Corp Cl A
MEDIA - CATV Systems
|
$42.96
|
-0.32
-0.73% |
$43.29
|
7,828,800
64.84% of 50 DAV
50 DAV is 12,073,500
|
$43.36
-0.92%
|
12/3/2012
|
$37.08
|
PP = $38.06
|
|
MB = $39.96
|
Most Recent Note - 5/6/2013 11:41:09 AM
G - Reported earnings +13% on +3% sales revenues for the Mar '13 quarter, the 2nd consecutive quarterly comparison with earnings well below the +25% minimum guideline (C criteria). Despite fundamental concerns repeatedly noted it has found recent support near its 50 DMA line and is perched at its 52-week high.
>>> The latest Featured Stock Update with an annotated graph appeared on 4/16/2013. Click here.
View all notes |
Alert me of new notes |
CANSLIM.net Company Profile |
SEC |
Zacks Reports |
StockTalk |
News |
Chart |
Request a new note
C
A N
S L
I M
|
EQM
-
NYSE
E Q T Midstream Partners
ENERGY - Oil and Gas Pipelines
|
$47.51
|
+0.11
0.23% |
$48.21
|
75,703
93.00% of 50 DAV
50 DAV is 81,400
|
$48.50
-2.04%
|
4/25/2013
|
$40.16
|
PP = $40.84
|
|
MB = $42.88
|
Most Recent Note - 5/8/2013 5:25:55 PM
G - Hovering near its 52-week high with above average volume behind today's gain. Prior highs in the $40 area define initial support to watch above its 50 DMA line on pullbacks.
>>> The latest Featured Stock Update with an annotated graph appeared on 4/25/2013. Click here.
View all notes |
Alert me of new notes |
CANSLIM.net Company Profile |
SEC |
Zacks Reports |
StockTalk |
News |
Chart |
Request a new note
C
A N
S L
I M
|
Symbol/Exchange
Company Name
Industry Group |
PRICE |
CHANGE
(%Change) |
Day High |
Volume
(% DAV)
(% 50 day avg vol) |
52 Wk Hi
% From Hi |
Featured
Date |
Price
Featured |
Pivot Featured |
|
Max Buy |
FLT
-
NYSE
Fleetcor Technologies
DIVERSIFIED SERVICES - Business/Management Services
|
$81.58
|
-1.26
-1.52% |
$83.05
|
534,401
60.56% of 50 DAV
50 DAV is 882,400
|
$85.56
-4.65%
|
3/21/2013
|
$71.14
|
PP = $73.00
|
|
MB = $76.65
|
Most Recent Note - 5/8/2013 5:23:16 PM
G - Posted a 5th consecutive gain with above average volume for a best ever close, getting more extended from any sound base pattern. Its 50 DMA line and recent low ($70.09) define near-term support where violations would raise more serious concerns and trigger worrisome technical sell signals. See the latest FSU analysis for more details and a new annotated graph.
>>> The latest Featured Stock Update with an annotated graph appeared on 5/8/2013. Click here.
View all notes |
Alert me of new notes |
CANSLIM.net Company Profile |
SEC |
Zacks Reports |
StockTalk |
News |
Chart |
Request a new note
C
A N
S L
I M
|
LNKD
-
NYSE
Linkedin Corp Class A
INTERNET - Internet Information Providers
|
$177.39
|
+0.24
0.14% |
$179.65
|
1,701,552
71.87% of 50 DAV
50 DAV is 2,367,500
|
$202.91
-12.58%
|
4/12/2013
|
$182.69
|
PP = $184.25
|
|
MB = $193.46
|
Most Recent Note - 5/6/2013 6:38:26 PM
G - Held its ground today near its 50 DMA line. Gapped down on 5/03/13 undercutting prior highs in the $184 area with heavy volume behind a damaging loss. Reported earnings +200% on +72% sales revenues for the Mar '13 quarter.
>>> The latest Featured Stock Update with an annotated graph appeared on 4/29/2013. Click here.
View all notes |
Alert me of new notes |
CANSLIM.net Company Profile |
SEC |
Zacks Reports |
StockTalk |
News |
Chart |
Request a new note
C
A N
S L
I M
|
MRLN
-
NASDAQ
Marlin Business Services
DIVERSIFIED SERVICES - Rental and Leasing Services
|
$24.96
|
-0.03
-0.12% |
$25.17
|
10,308
39.80% of 50 DAV
50 DAV is 25,900
|
$25.97
-3.89%
|
3/15/2013
|
$22.29
|
PP = $23.18
|
|
MB = $24.34
|
Most Recent Note - 5/8/2013 5:24:24 PM
G - Pulled back on below average volume yet it remains above its "max buy" level. No resistance remains due to overhead supply. Prior highs in the $23 area define support to watch on pullbacks.
>>> The latest Featured Stock Update with an annotated graph appeared on 5/2/2013. Click here.
View all notes |
Alert me of new notes |
CANSLIM.net Company Profile |
SEC |
Zacks Reports |
StockTalk |
News |
Chart |
Request a new note
C
A N
S L
I M
|
N
-
NYSE
Netsuite Inc
DIVERSIFIED SERVICES - Business/Management Services
|
$89.77
|
-0.06
-0.07% |
$90.09
|
161,264
43.77% of 50 DAV
50 DAV is 368,400
|
$91.02
-1.37%
|
12/12/2012
|
$64.75
|
PP = $67.12
|
|
MB = $70.48
|
Most Recent Note - 5/3/2013 6:22:48 PM
G - Hit another new all-time high with today's gain. Its 50 DMA line defines important near-term support to watch. Reported earnings -33% on +32% sales revenues for the Mar '13 quarter, marking a 2nd consecutive quarterly comparison with earnings below the +25% minimum guideline (C criteria).
>>> The latest Featured Stock Update with an annotated graph appeared on 4/22/2013. Click here.
View all notes |
Alert me of new notes |
CANSLIM.net Company Profile |
SEC |
Zacks Reports |
StockTalk |
News |
Chart |
Request a new note
C
A N
S L
I M
|
NSM
-
NYSE
Nationstar Mtg Hldgs Inc
FINANCIAL SERVICES - Credit Services
|
$42.35
|
+1.60
3.93% |
$42.61
|
2,505,093
228.92% of 50 DAV
50 DAV is 1,094,300
|
$42.24
0.26%
|
5/7/2013
|
$39.71
|
PP = $42.34
|
|
MB = $44.46
|
Most Recent Note - 5/9/2013 1:11:18 PM
Y - Hit a new 52-week high with today's 4th consecutive volume-driven gain while approaching its new pivot point based on its 2/15/13 high plus 10 cents. NSM was highlighted in yellow in the 5/07/13 mid-day report with an annotated daily graph (read here) as it returned to the Featured Stocks list. Fundamentals remain favorable with respect to the C and A criteria. See the latest FSU analysis for more details and an annotated weekly graph.
>>> The latest Featured Stock Update with an annotated graph appeared on 5/7/2013. Click here.
View all notes |
Alert me of new notes |
CANSLIM.net Company Profile |
SEC |
Zacks Reports |
StockTalk |
News |
Chart |
Request a new note
C
A N
S L
I M
|
Symbol/Exchange
Company Name
Industry Group |
PRICE |
CHANGE
(%Change) |
Day High |
Volume
(% DAV)
(% 50 day avg vol) |
52 Wk Hi
% From Hi |
Featured
Date |
Price
Featured |
Pivot Featured |
|
Max Buy |
PRAA
-
NASDAQ
Portfolio Recovery Assoc
DIVERSIFIED SERVICES - Business/Management Services
|
$146.33
|
+3.78
2.65% |
$147.00
|
92,977
138.56% of 50 DAV
50 DAV is 67,100
|
$142.55
2.65%
|
5/1/2013
|
$130.77
|
PP = $127.88
|
|
MB = $134.27
|
Most Recent Note - 5/3/2013
G - Spiked further into new high territory while adding to its streak of volume-driven gains including the previously noted "breakaway gap". It is extended from any sound base and prior highs near $127 define near-term support to watch on pullbacks. Reported earnings +54% on +21% sales revenues for the Mar '13 quarter.
>>> The latest Featured Stock Update with an annotated graph appeared on 5/1/2013. Click here.
View all notes |
Alert me of new notes |
CANSLIM.net Company Profile |
SEC |
Zacks Reports |
StockTalk |
News |
Chart |
Request a new note
C
A N
S L
I M
|
PRLB
-
NYSE
Proto Labs Inc
MANUFACTURING - Small Tools and Accessories
|
$54.95
|
+0.19
0.35% |
$55.03
|
283,027
52.08% of 50 DAV
50 DAV is 543,400
|
$56.59
-2.90%
|
5/3/2013
|
$54.77
|
PP = $54.01
|
|
MB = $56.71
|
Most Recent Note - 5/3/2013 6:56:01 PM
Y - Highlighted in yellow in the earlier mid-day report, it posted a gain above the previously cited pivot point backed by +47% above average volume while hitting a new 52-week high triggering a technical buy signal. Reported earnings +46% on +24% sales revenues for the Mar '13 quarter, continuing its strong growth trend satisfying the C criteria. See the latest FSU analysis for more details and a new annotated graph.
>>> The latest Featured Stock Update with an annotated graph appeared on 5/3/2013. Click here.
View all notes |
Alert me of new notes |
CANSLIM.net Company Profile |
SEC |
Zacks Reports |
StockTalk |
News |
Chart |
Request a new note
C
A N
S L
I M
|
RRTS
-
NYSE
Roadrunner Trans Systems
TRANSPORTATION - Air Delivery and Freight Service
|
$25.34
|
-0.18
-0.71% |
$25.44
|
401,425
214.21% of 50 DAV
50 DAV is 187,400
|
$25.85
-1.97%
|
4/3/2013
|
$22.77
|
PP = $23.75
|
|
MB = $24.94
|
Most Recent Note - 5/9/2013 1:25:24 PM
G - Pulling back today on higher volume, trading near its "max buy" level. Prior highs in the $23 area define initial support to watch above its 50 DMA line.
>>> The latest Featured Stock Update with an annotated graph appeared on 4/23/2013. Click here.
View all notes |
Alert me of new notes |
CANSLIM.net Company Profile |
SEC |
Zacks Reports |
StockTalk |
News |
Chart |
Request a new note
C
A N
S L
I M
|
VRX
-
NYSE
Valeant Pharmaceuticals
DRUGS - Drug Manufacturers - Other
|
$72.74
|
-1.12
-1.52% |
$74.09
|
1,267,047
87.44% of 50 DAV
50 DAV is 1,449,000
|
$76.57
-5.00%
|
4/30/2013
|
$60.24
|
PP = $76.66
|
|
MB = $80.49
|
Most Recent Note - 5/6/2013 6:35:45 PM
Y- Sub par earnings for the Mar '13 quarter below the +25% minimum guideline (C criteria) raised fundamental concerns. Its 50 DMA line defines important near-term support above the recent low ($69.87 on 4/04/13). Subsequent violations may trigger technical sell signals.
>>> The latest Featured Stock Update with an annotated graph appeared on 4/30/2013. Click here.
View all notes |
Alert me of new notes |
CANSLIM.net Company Profile |
SEC |
Zacks Reports |
StockTalk |
News |
Chart |
Request a new note
C
A N
S L
I M
|
|
|
|
THESE ARE NOT BUY RECOMMENDATIONS!
Comments contained in the body of this report are technical
opinions only. The material herein has been obtained
from sources believed to be reliable and accurate, however,
its accuracy and completeness cannot be guaranteed.
This site is not an investment advisor, hence it does
not endorse or recommend any securities or other investments.
Any recommendation contained in this report may not
be suitable for all investors and it is not to be deemed
an offer or solicitation on our part with respect to
the purchase or sale of any securities. All trademarks,
service marks and trade names appearing in this report
are the property of their respective owners, and are
likewise used for identification purposes only.
This report is a service available
only to active Paid Premium Members.
You may opt-out of receiving report notifications
at any time. Questions or comments may be submitted
by writing to Premium Membership Services 665 S.E. 10 Street, Suite 201 Deerfield Beach, FL 33441-5634 or by calling 1-800-965-8307
or 954-785-1121.
|
|
|

